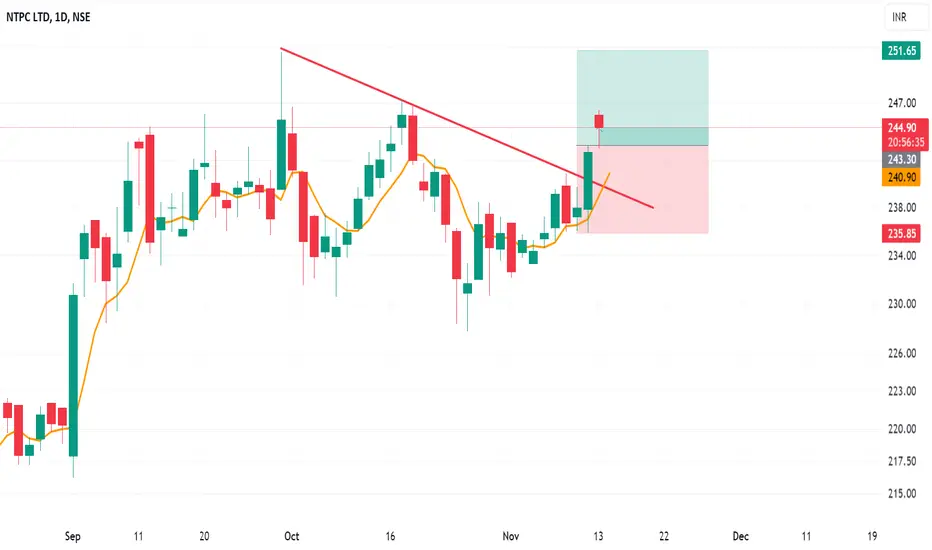
NTPC S/R for 20/9/24Support and Resistance Levels:
Support Levels: These are price points (green line/shade) where a downward trend may be halted due to a concentration of buying interest. Imagine them as a safety net where buyers step in, preventing further decline.
Resistance Levels: Conversely, resistance levels (red line/shade) are where upward trends might stall due to increased selling interest. They act like a ceiling where sellers come in to push prices down.
Breakouts:
Bullish Breakout: When the price moves above resistance, it often indicates strong buying interest and the potential for a continued uptrend. Traders may view this as a signal to buy or hold.
Bearish Breakout: When the price falls below support, it can signal strong selling interest and the potential for a continued downtrend. Traders might see this as a cue to sell or avoid buying.
20 EMA (Exponential Moving Average):
Above 20 EMA: If the stock price is above the 20 EMA, it suggests a potential uptrend or bullish momentum.
Below 20 EMA: If the stock price is below the 20 EMA, it indicates a potential downtrend or bearish momentum.
Trendline: A trendline is a straight line drawn on a chart to represent the general direction of a data point set.
Uptrend Line: Drawn by connecting the lows in an upward trend. Indicates that the price is moving higher over time. Acts as a support level, where prices tend to bounce upward.
Downtrend Line: Drawn by connecting the highs in a downward trend. Indicates that the price is moving lower over time. It acts as a resistance level, where prices tend to drop.
RSI: RSI readings greater than the 70 level are overbought territory, and RSI readings lower than the 30 level are considered oversold territory.
Combining RSI with Support and Resistance:
Support Level: This is a price level where a stock tends to find buying interest, preventing it from falling further. If RSI is showing an oversold condition (below 30) and the price is near or at a strong support level, it could be a good buy signal.
Resistance Level: This is a price level where a stock tends to find selling interest, preventing it from rising further. If RSI is showing an overbought condition (above 70) and the price is near or at a strong resistance level, it could be a signal to sell or short the asset.
Disclaimer:
I am not a SEBI registered. The information provided here is for learning purposes only and should not be interpreted as financial advice. Consider the broader market context and consult with a qualified financial advisor before making investment decisions.
NTPC trade ideas

NTPC BUY BULLISH "NTPC bullish," it seems that the overall sentiment is positive, with many analysts and technical indicators suggesting a potential increase in the stock price

Ntpc LimitedNtpc Limited, two entries possible wit for the price to reach the demand zone and trade.

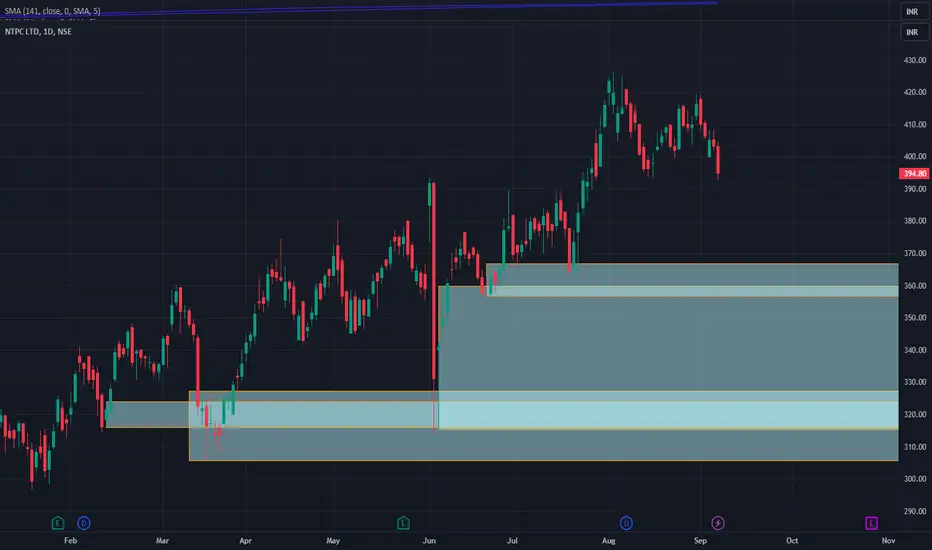
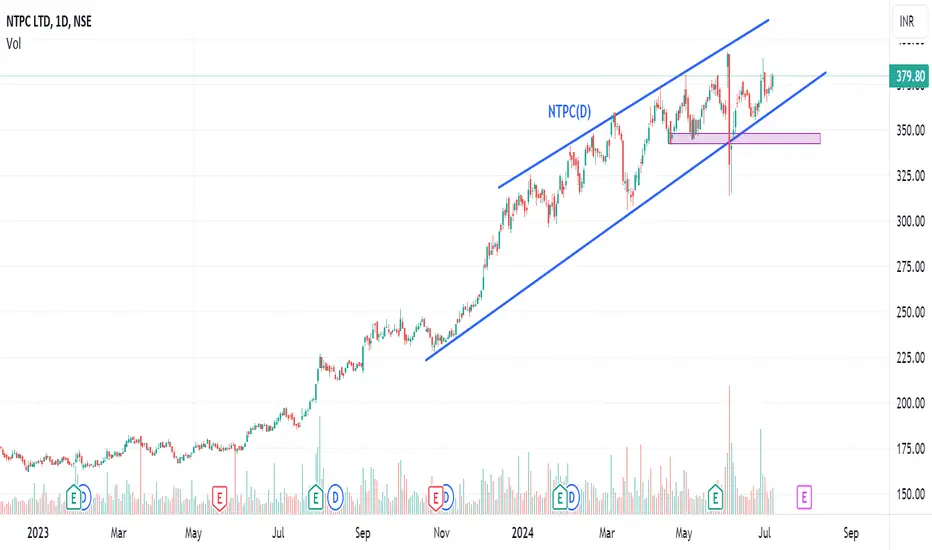
NTPC LONG 366-338 Target 430NTPC Yearly Breakout @243
NTPC 6 Month Breakout @315 315
NTPC Month Demand @360 360
NTPC Weekly Demand @327 327
NTPC Daily Demand @324 324
NTPC Daily Demand @366 366
NTPC Strong Support 338
NTPC TARGET 430
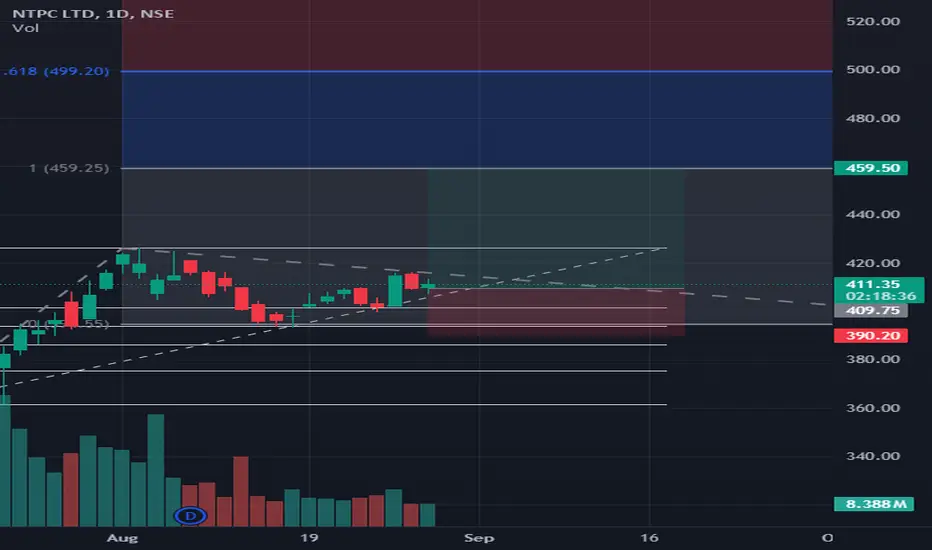
NTPC Ltd. - Daily Chart AnalysisThis daily chart of NTPC Ltd. showcases a potential breakout setup, with the price action nearing a critical resistance level. The chart highlights the following trade parameters:
Entry: Around 411.95 INR
Target: 459.50 INR (Potential upside: 11.52%)
Stop Loss: 390.20 INR (Potential downside: 5.28%)
Risk/Reward Ratio: Approximately 2.18:1
NTPC Ltd. is currently trading within an ascending triangle pattern, a bullish continuation pattern, with potential for a breakout above the current resistance level. The Fibonacci retracement levels provide additional confirmation of support and resistance zones, with the next major target around the 459.50 INR mark. This setup presents a favorable risk/reward ratio for traders looking to capitalize on a potential breakout in the near term.
Review and plan for 2th August 2024 Nifty future and banknifty future analysis and intraday plan in kannada.
Positional trading ideas included.
This video is for information/education purpose only. you are 100% responsible for any actions you take by reading/viewing this post.
please consult your financial advisor before taking any action.
----Vinaykumar hiremath, CMT

NTPC Buy 26 Jun 2024Hey guys,
Check out this NTPC chart for tomorrow. It is showing support at 357 and it has started bullish move yesterday. I see potential till 371.
So, to summarize, Entry at 361, SL 357 and profit 371. See you tomorrow NTPC.
For such analysis, stay tuned.

NTPC UP MOVE?Ntpc can give a good up move with a decent stoploss and for good Targets. This might turn out to be a good swing to positional trade
ENTRY - 370-370.5(after sustaining)
STOPLOSS - 368.5
TARGETS - 382, 390, 396++
Note- if any trade or value that's gone from the marked levels then that's not our trade just let it go or wait for it to come back
I'm not sebi registered this is my personal view
Please like or boost my idea if you like it or traded it
Thankyou

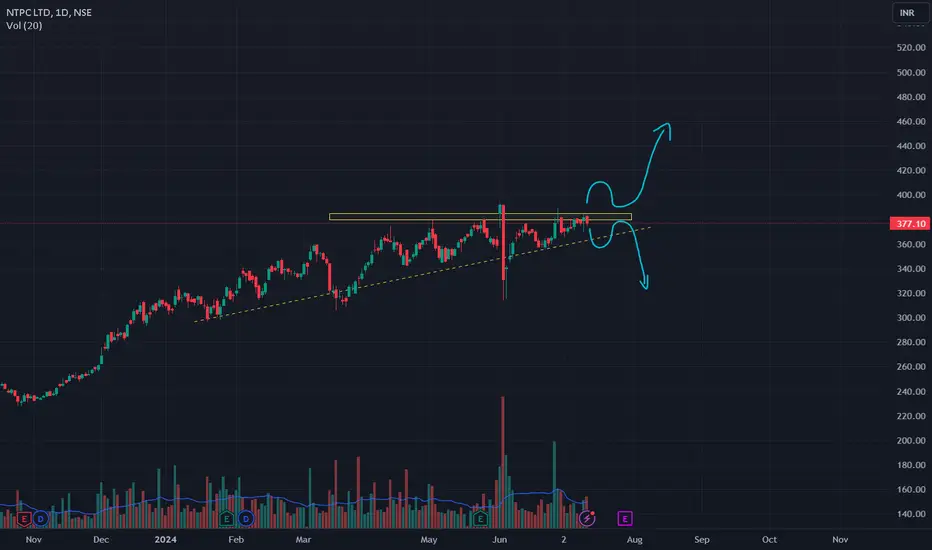
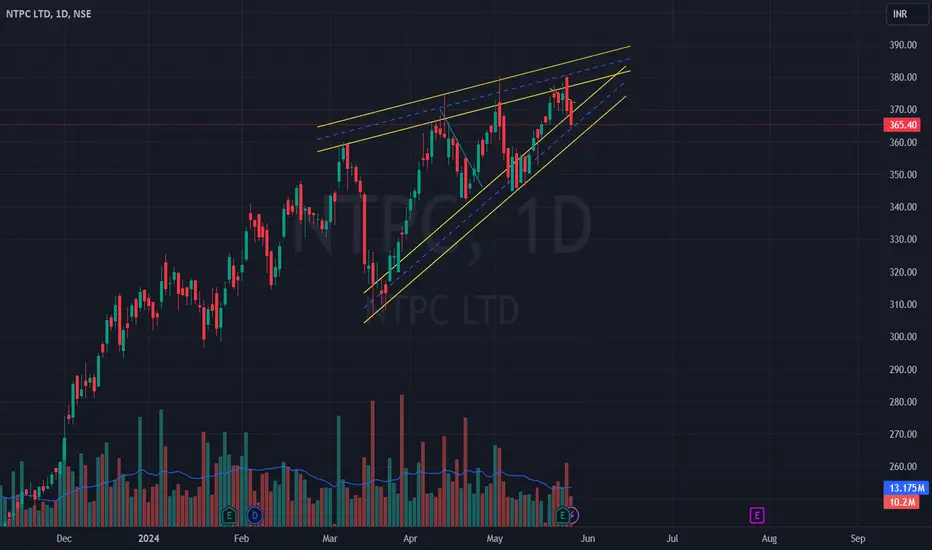
NTPC 1DAYCAN ANYONE GUESS THE PATTERN...??
.
.
.
.
.
.
I Am Not SEBI Registered Analyst. All Post and Levels Posting is only for educational and knowledge purpose. I Am not responsible for your any kind of loss or profit.
No Claim, All Rights Reserved.‼️
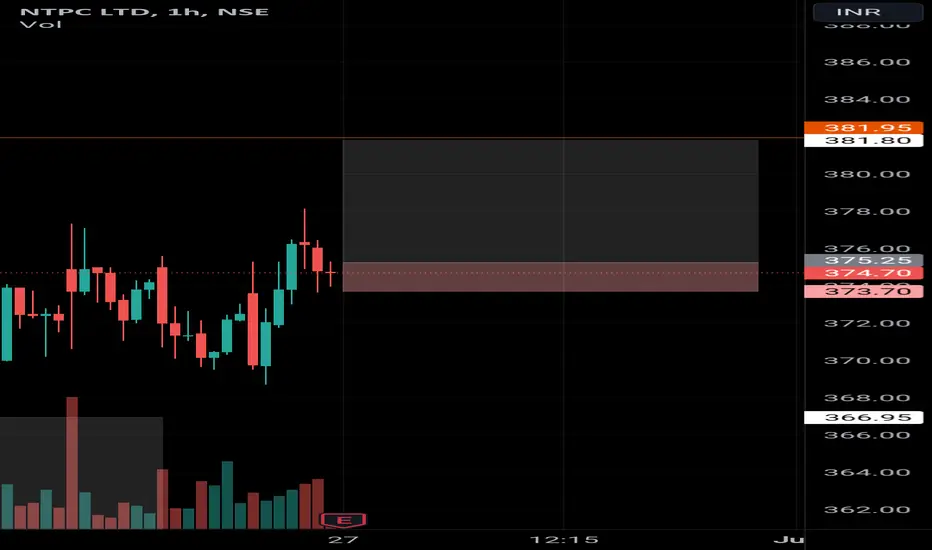
NTPC SWING TO POSITIONAL Ntpc can give a good break out trade with a small STOPLOSS and decent Targets
ENTRY - 375.5
STOPLOSS - 373
TARGETS - 382, 390, 400++
Note- if any trade or value that's gone from the marked levels then that's not our trade just let it go or wait for it to come back
I'm not sebi registered this is my personal view
Please like or boost my idea if you like it or traded it
Thankyou
NTPC SWING TO POSITIONAL Ntpc can give a good up side moment with a decent stoploss and good Targets
ENTRY - 357
STOPLOSS - 354
TARGETS - 367, 375,380++
Note- if any trade or value that's gone from the marked levels then that's not our trade just let it go or wait for it to come back
I'm not sebi registered this is my personal view
Please like or boost my idea if you like it or traded it
Thankyou.

Crossover Trade - NTPC📊 Script: NTPC
📊 Sector: Power Generation & Distribution
📊 Industry: Power Generation And Supply
Key highlights: 💡⚡
📈 Script is trading near upper band of BB.
📈 Already crossover MACD.
📈 Double Moving Averages are on urge of crossover.
📈 Right now RSI is around 64.
📈 One can go for Swing Trade.
⏱️ C.M.P 📑💰- 351
🟢 Target 🎯🏆 - 374
⚠️ Stoploss ☠️🚫 - 343
⚠️ Important: Always maintain your Risk & Reward Ratio.
✅Like and follow to never miss a new idea!✅
Disclaimer: I am not SEBI Registered Advisor. My posts are purely for training and educational purposes.
Eat🍜 Sleep😴 TradingView📈 Repeat 🔁
Happy learning with trading. Cheers!🥂

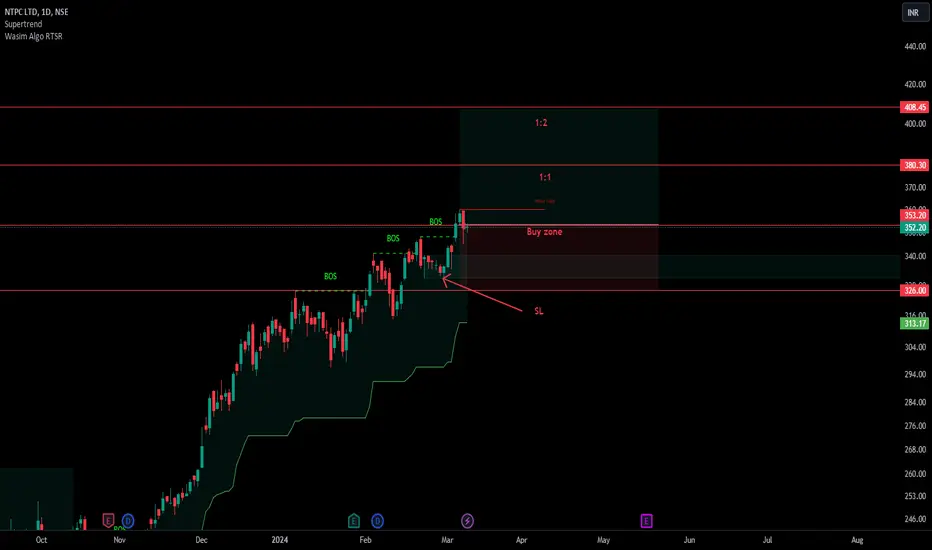
Simple price action... entry when swing high break... SL is swinSimple price action... entry when swing high break... SL is swing low.. Target 1:1, 1:2, 1:3
NTPC INTRADAY TO SWING TRADENTPC can give a sharp or a decent up move with a small STOPLOSS
ENTRY - 242.5
STOPLOSS - 239
TARGETS - 250, 255, 260++
Note- if any trade or value that's gone from the marked levels then that's not our trade just let it go or wait for it to come back
I'm not sebi registered this is my personal view
Please like or boost my idea if you like it or traded it
Thankyou.

NTPC INTRADAY TO SWING TRADE Ntpc INTRADAY to swing trade with a small STOPLOSS and good Target
Entry - above 340
STOPLOSS -337
TARGET - 345,350++
Note- any trade or value that's gone from the marked levels then that's not our trade just let it go or wait for it to come back
I'm not sebi registered this is my personal view

NTPCNTPC
Targets : 250.60, 280.60, 340.60
SL : 220
Please refer the Levels
Hold few days
Please consult your financial advisor before investing
All research for educational purposes only.

NTPC QUARTERLY CHARTNTPC QUARTERLY CHART
Cmp 251.60 Final ellipse breakout @ 202 & life highs breakout @ 243 Target @ 346
This stock has witnessed a multiyear breakout & the target expected is placed @ 346 levels.
It's only an observation & not any suggestion.

NTPC📢breakout stock📢
🫸 Wait for the Retest 🫷
These are swing ideas which you can add your watchlist and analysis for yourself !
Keep on your radar 📡 !
This content only education purpose!
❗I am not sebi ragister❗


NtpcThis is very technically very good for the stock. 316 above looking good. A big moment is coming.