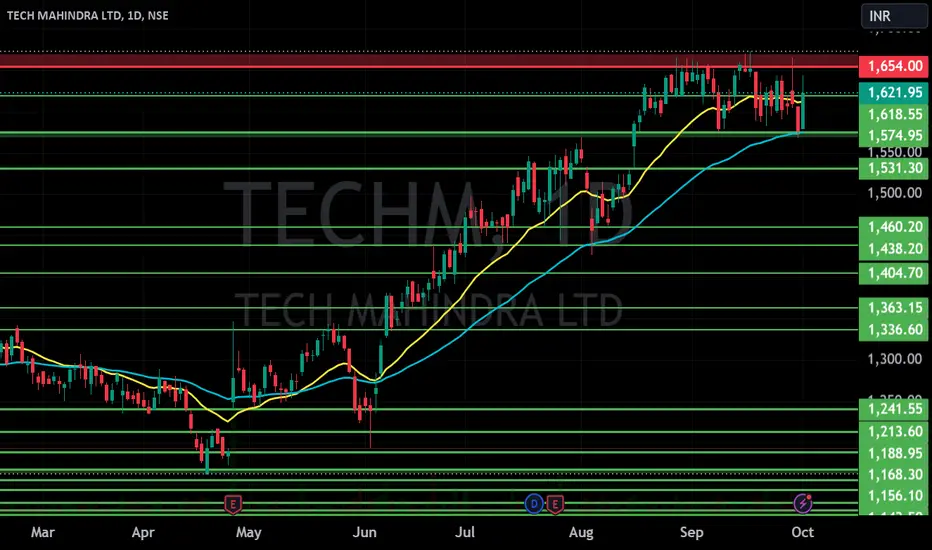
TECHM S/RSupport and Resistance Levels:
Support Levels: These are price points (green line/shade) where a downward trend may be halted due to a concentration of buying interest. Imagine them as a safety net where buyers step in, preventing further decline.
Resistance Levels: Conversely, resistance levels (red line/shade) are where upward trends might stall due to increased selling interest. They act like a ceiling where sellers come in to push prices down.
Breakouts:
Bullish Breakout: When the price moves above resistance, it often indicates strong buying interest and the potential for a continued uptrend. Traders may view this as a signal to buy or hold.
Bearish Breakout: When the price falls below support, it can signal strong selling interest and the potential for a continued downtrend. Traders might see this as a cue to sell or avoid buying.
20 EMA (Exponential Moving Average):
Above 20 EMA(50 EMA): If the stock price is above the 20 EMA, it suggests a potential uptrend or bullish momentum.
Below 20 EMA: If the stock price is below the 20 EMA, it indicates a potential downtrend or bearish momentum.
Trendline: A trendline is a straight line drawn on a chart to represent the general direction of a data point set.
Uptrend Line: Drawn by connecting the lows in an upward trend. Indicates that the price is moving higher over time. Acts as a support level, where prices tend to bounce upward.
Downtrend Line: Drawn by connecting the highs in a downward trend. Indicates that the price is moving lower over time. It acts as a resistance level, where prices tend to drop.
RSI: RSI readings greater than the 70 level are overbought territory, and RSI readings lower than the 30 level are considered oversold territory.
Combining RSI with Support and Resistance:
Support Level: This is a price level where a stock tends to find buying interest, preventing it from falling further. If RSI is showing an oversold condition (below 30) and the price is near or at a strong support level, it could be a good buy signal.
Resistance Level: This is a price level where a stock tends to find selling interest, preventing it from rising further. If RSI is showing an overbought condition (above 70) and the price is near or at a strong resistance level, it could be a signal to sell or short the asset.
Disclaimer:
I am not a SEBI registered. The information provided here is for learning purposes only and should not be interpreted as financial advice. Consider the broader market context and consult with a qualified financial advisor before making investment decisions.
TECHM trade ideas
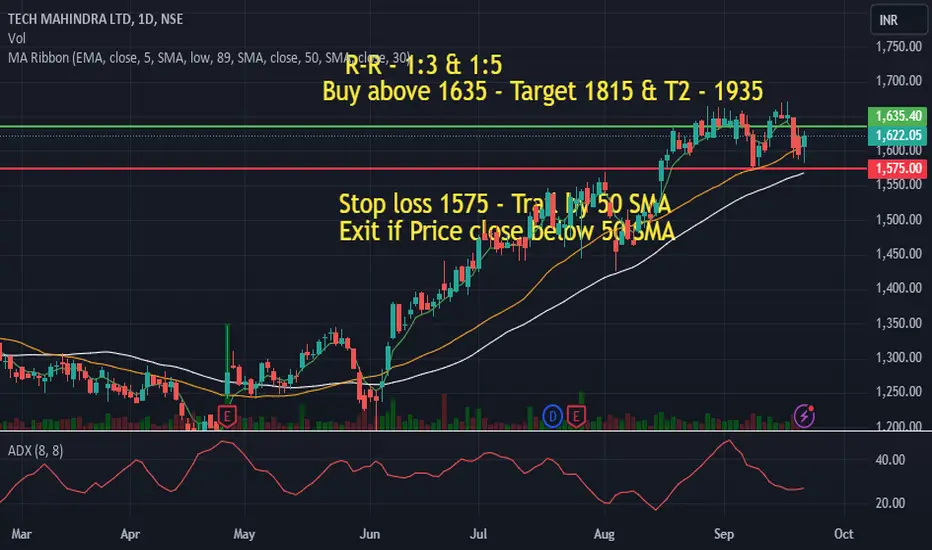
50 SMA Rising - Positional TradeDisclaimer: I am not a Sebi registered adviser.
This Idea is publish purely for educational purpose only before investing in any stocks please take advise from your financial adviser.
Its 50 SMA Rising Strategy. Suitable for Positional Trading Initial Stop loss lowest of last 2 candles and keep trailing with 50 days SMA if price close below 50 SMA then Exit or be in the trade some time trade can go for several months.
Be Discipline because discipline is the Key to Success in the STOCK Market.
Trade What you see not what you Think
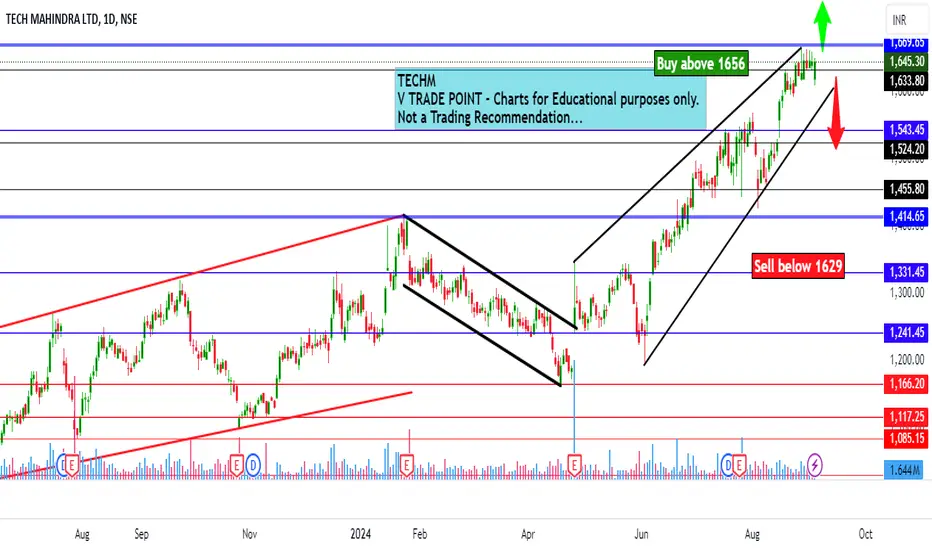
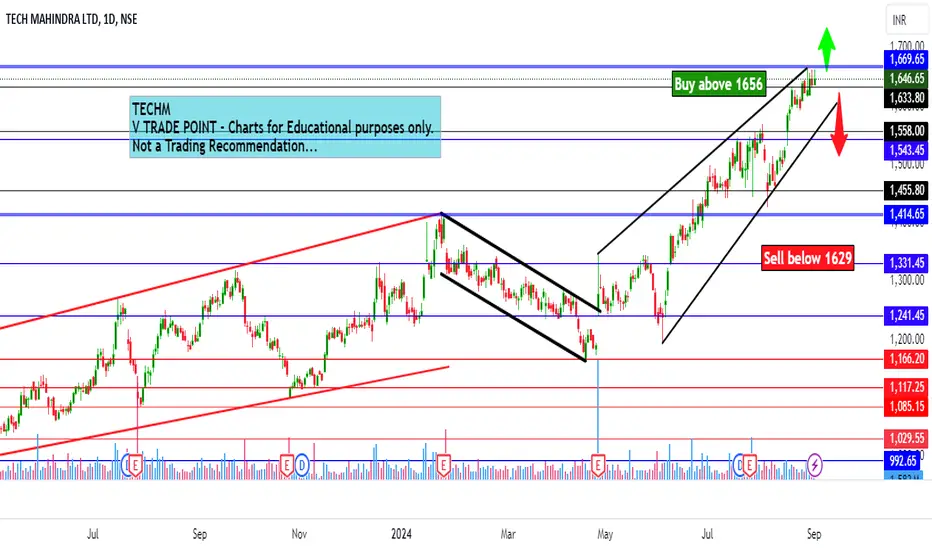
Tech Mahidnra Ltd view for Intraday 5th September #TECHM Tech Mahidnra Ltd view for Intraday 5th September #TECHM
Buying may witness above 1656
Support area 1629. Below ignoring buying momentum for intraday
Selling may witness below 1629
Resistance area 1655-1656
Above ignoring selling momentum for intraday
Charts for Educational purposes only.
Please follow strict stop loss and risk reward if you follow the level.
Thanks,
V Trade Point
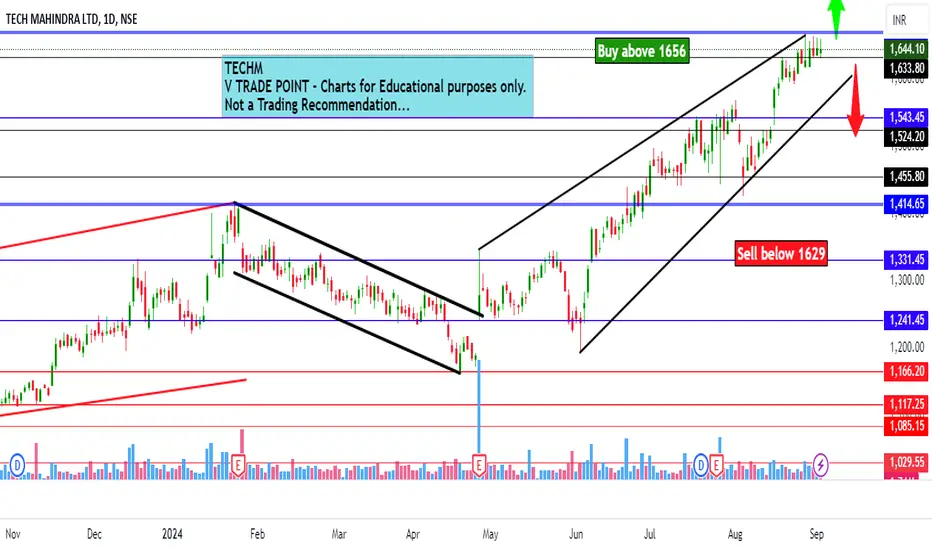
Tech Mahindra Ltd view for Intraday 4th September #TECHM Tech Mahindra Ltd view for Intraday 4th September #TECHM
Buying may witness above 1656
Support area 1629. Below ignoring buying momentum for intraday
Selling may witness below 1629
Resistance area 1656
Above ignoring selling momentum for intraday
Charts for Educational purposes only.
Please follow strict stop loss and risk reward if you follow the level.
Thanks,
V Trade Point
Tech Mahindra Ltd view for Intraday 3rd September #TECHM Tech Mahindra Ltd view for Intraday 3rd September #TECHM
Buying may witness above 1656
Support area 1629. Below ignoring buying momentum for intraday
Selling may witness below 1629
Resistance area 1656
Above ignoring selling momentum for intraday
Charts for Educational purposes only.
Please follow strict stop loss and risk reward if you follow the level.
Thanks,
V Trade Point
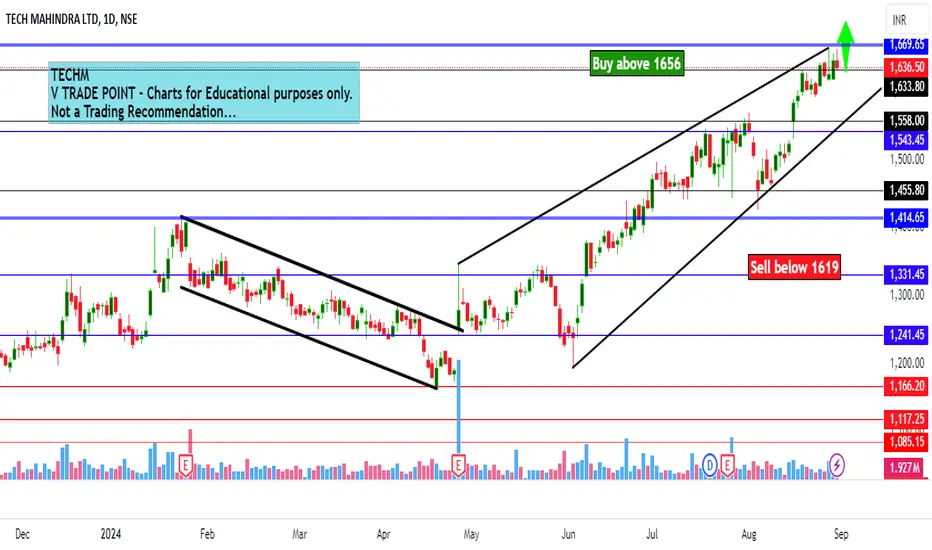
Tech Mahindra Ltd view for Intraday 2nd September #TECHM Tech Mahindra Ltd view for Intraday 2nd September #TECHM
Buying may witness above 1656
Support area 1630.. Below ignoring buying momentum for intraday
Selling may witness below 1619
Resistance area 1650
Above ignoring selling momentum for intraday
Charts for Educational purposes only.
Please follow strict stop loss and risk reward if you follow the level.
Thanks,
V Trade Point
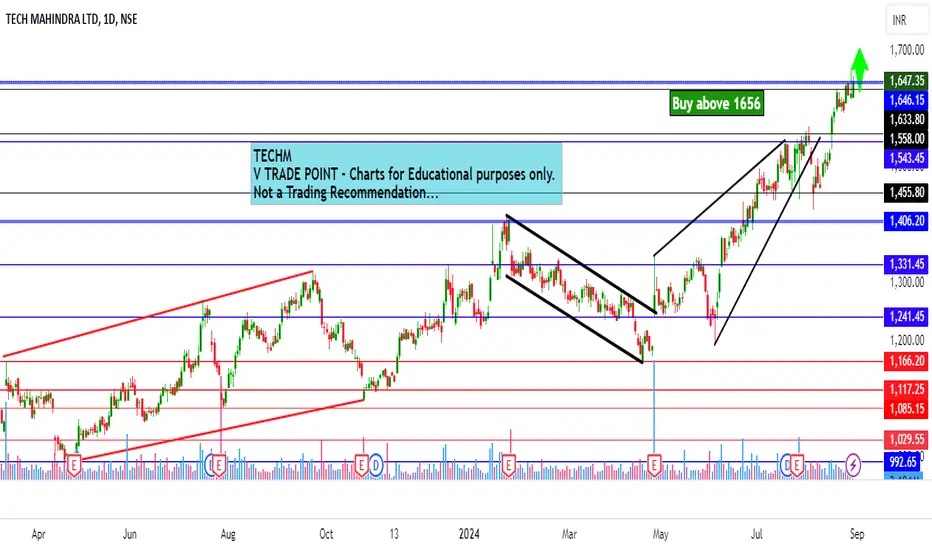
Tech Mahindra Ltd view for Intraday 30th August #TECHM Tech Mahindra Ltd view for Intraday 30th August #TECHM
Buying may witness above 1656
Support area 1630.. Below ignoring buying momentum for intraday
Charts for Educational purposes only.
Please follow strict stop loss and risk reward if you follow the level.
Thanks,
V Trade Point
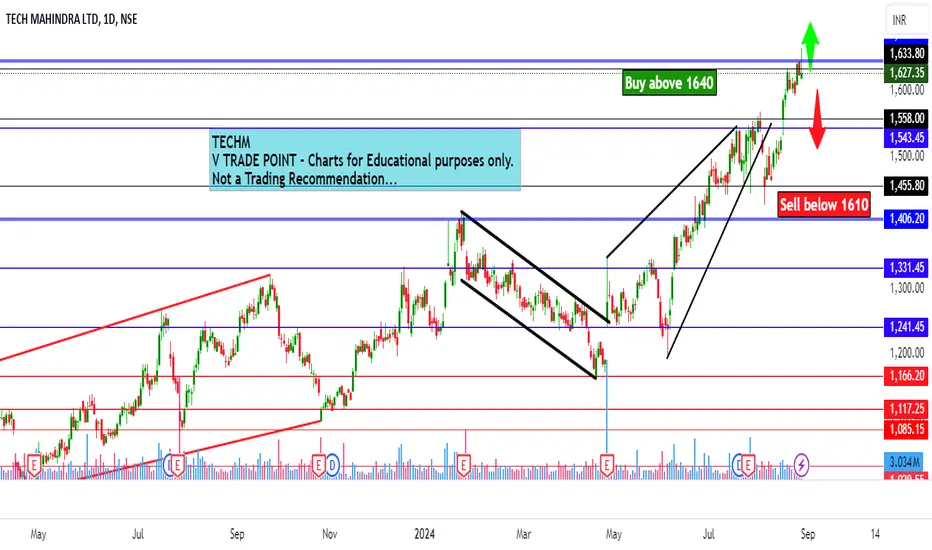
Tech Mahindra Ltd view for Intraday 29th August #TECHM Tech Mahindra Ltd view for Intraday 29th August #TECHM
Buying may witness above 1640
Support area 1610.. Below ignoring buying momentum for intraday
Selling may witness below 1610
Resistance area 1635-1640
Above ignoring selling momentum for intraday
Charts for Educational purposes only.
Please follow strict stop loss and risk reward if you follow the level.
Thanks,
V Trade Point
tech mahindranifty IT also uptrend
Additionally, this stock broke above its resistance.
continued over the breakthrough line
upward tendency, channel pattern, and breakout
Stocks may rise in value.
not advised for purchase and sale

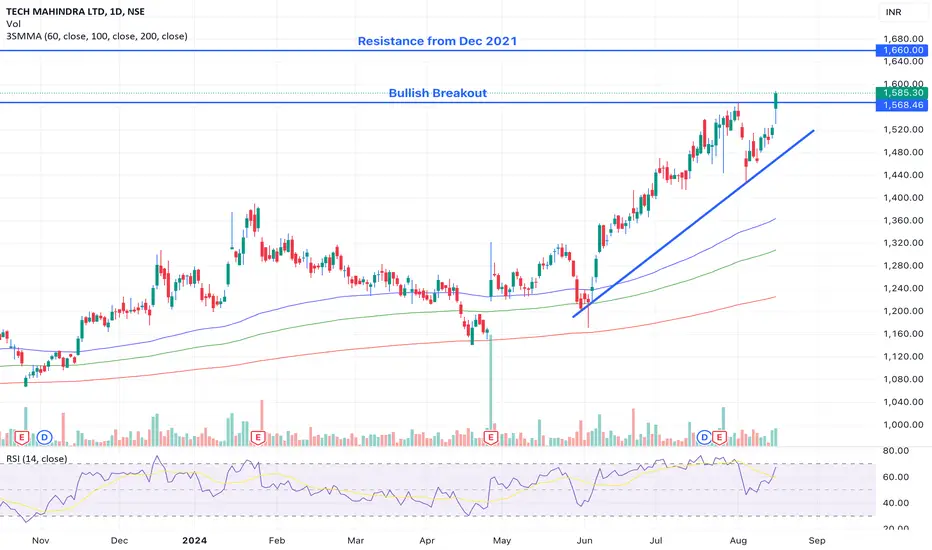
Tech Mahindra Ltd: Strong Fundamentals and Bullish BreakoutFundamental View:
➡️ PE Ratio: 61 | ROCE: 12% | ROE: 8.63% | Market Cap: ₹1,55,031 Cr
➡️ Strong long-term financials with a 96% dividend payout
➡️ Ranked 5th out of 147 in IT Software
➡️ Global presence with diverse services across 90+ countries
Technical View:
➡️ Bullish breakout observed
➡️ Next resistance from Dec 2021 at 1,660
➡️ Ascending trend line providing strong support
➡️ RSI at 67, indicating strong momentum
➡️ Price above key moving averages (50, 100, 200-day)
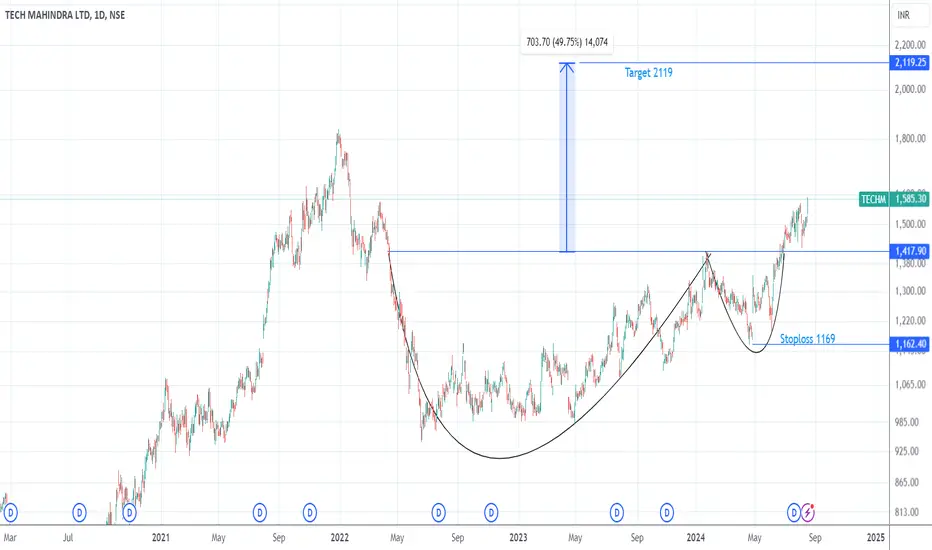
Tech Mahindra buy callbuy tech mahindra with strict stoploss.
Cup and handle pattern
Tech Mahindra Ltd provides comprehensive range of IT services, including IT enabled service, application development and maintenance, consulting and enterprise business solutions, etc. to a diversified base of corporate customers in a wide range of industries.
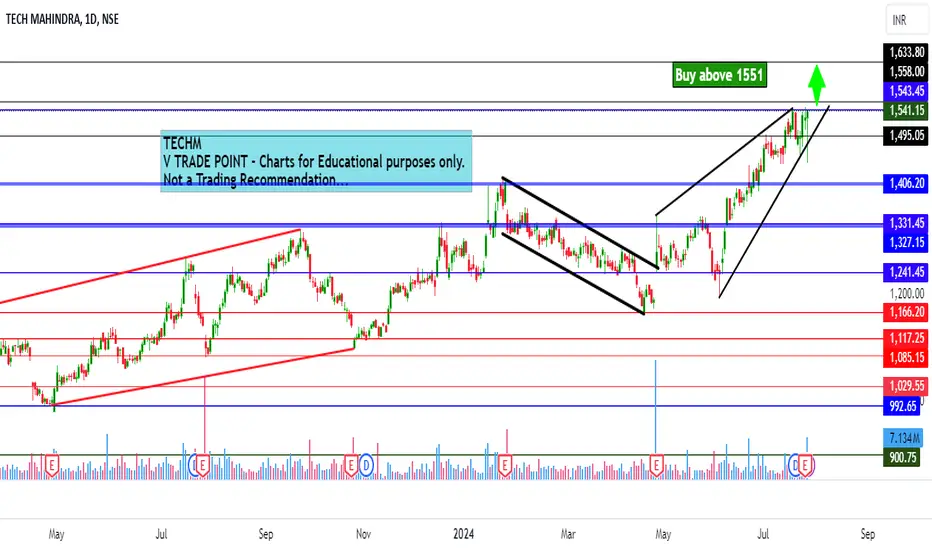
Tech Mahindra Intraday level for 29th July #TECHM Tech Mahindra Intraday level for 29th July #TECHM
Buying may witness above 1551
Support area 1520. Below ignoring buying momentum for intraday
Charts for Educational purposes only.
Please follow strict stop loss and risk reward if you follow the level.
Thanks,
V Trade Point
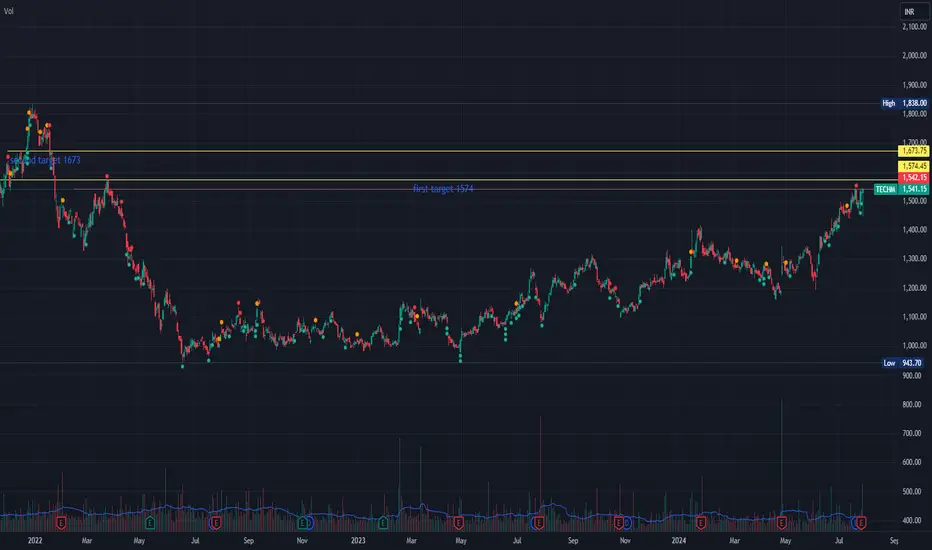
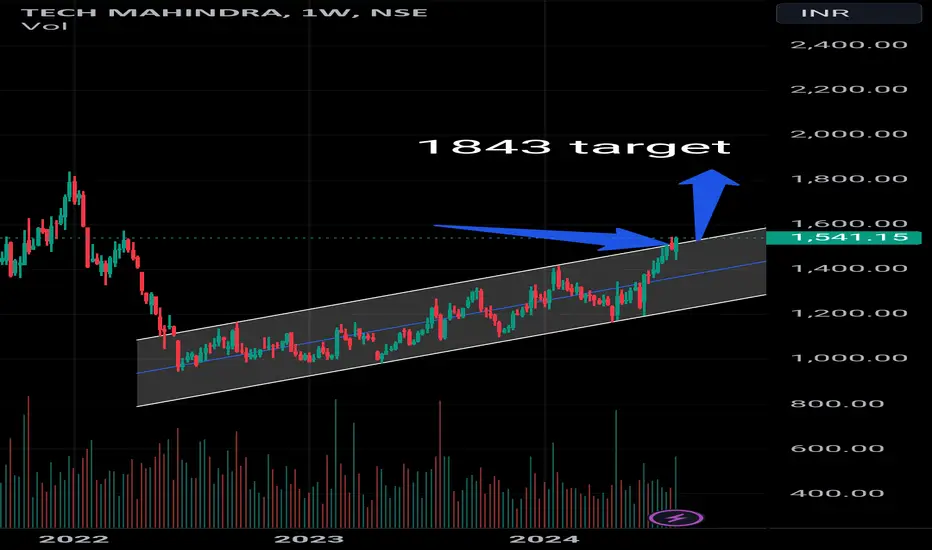
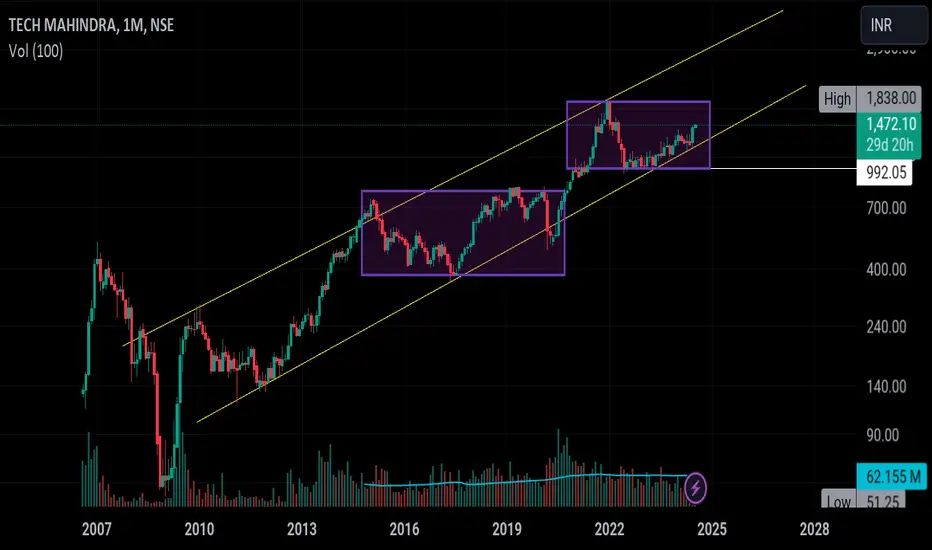
techm near resistanceTECHM near resistance (2year breakout on the way)
if breaks
it can reach upto 1574 res which will be our first immediate target .
if it can break that level it can go all the way to 1600+
Tech Mahindra The stock has broken out of the channel, indicating a strong possibility of an upward movement from this point.
Note!!
(No buy or sell recommendations)
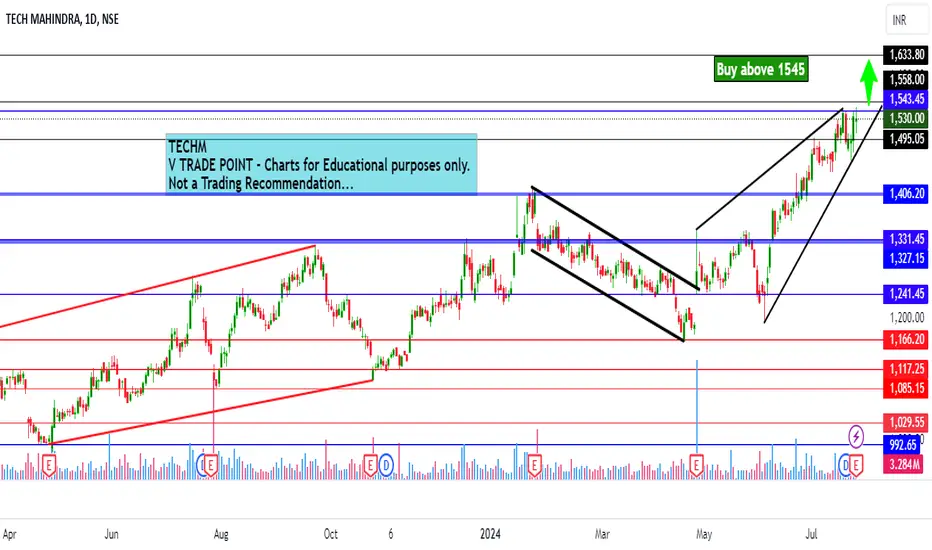
Tech Mahindra Intraday level for 26th July #TECHM Tech Mahindra Intraday level for 26th July #TECHM
Buying may witness above 1545
Support area 1525-1530. Below ignoring buying momentum for intraday
Charts for Educational purposes only.
Please follow strict stop loss and risk reward if you follow the level.
Thanks,
V Trade Point
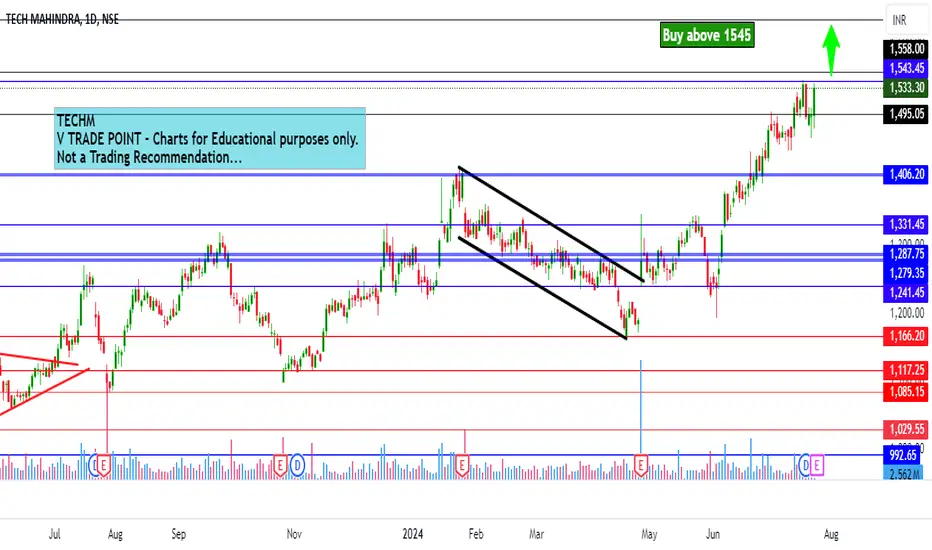
Tech Mahindra Ltd Intraday level for 25th July #TECHM Tech Mahindra Ltd Intraday level for 25th July #TECHM
Buying may witness above 1545
Support area 1520-1525. Below ignoring buying momentum for intraday
Charts for Educational purposes only.
Please follow strict stop loss and risk reward if you follow the level.
Thanks,
V Trade Point
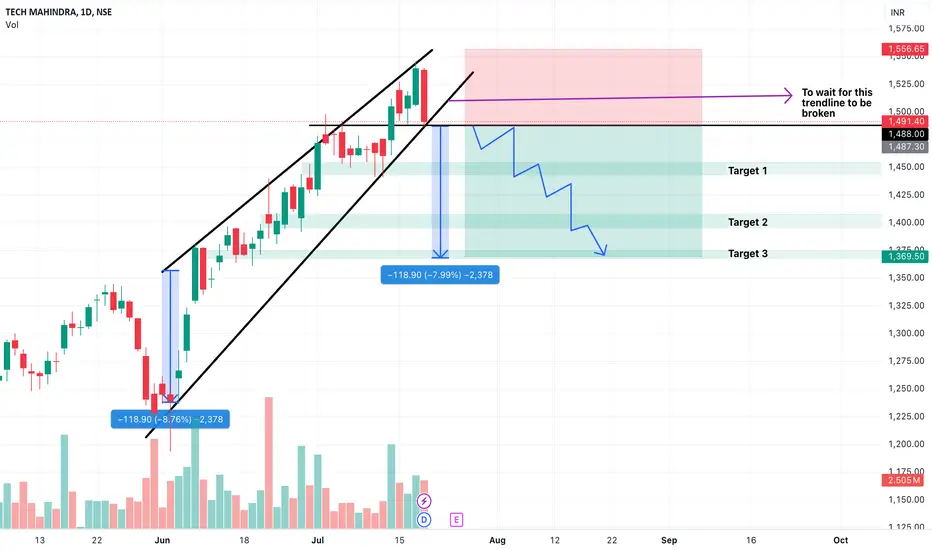
Short trade on Tech Mahindra (NSE)
A rising wedge pattern has been identified on the daily timeframe for the stock.
Traders should wait for the trend line to be breached. Once it is broken, set a stop loss at the swing high and use a trailing stop loss. The three targets are based on the stock's immediate support levels.
Note - Please consult your financial advisor before engaging in trading activities, as this information is for educational purposes only. Trading futures and options involves significant risk.
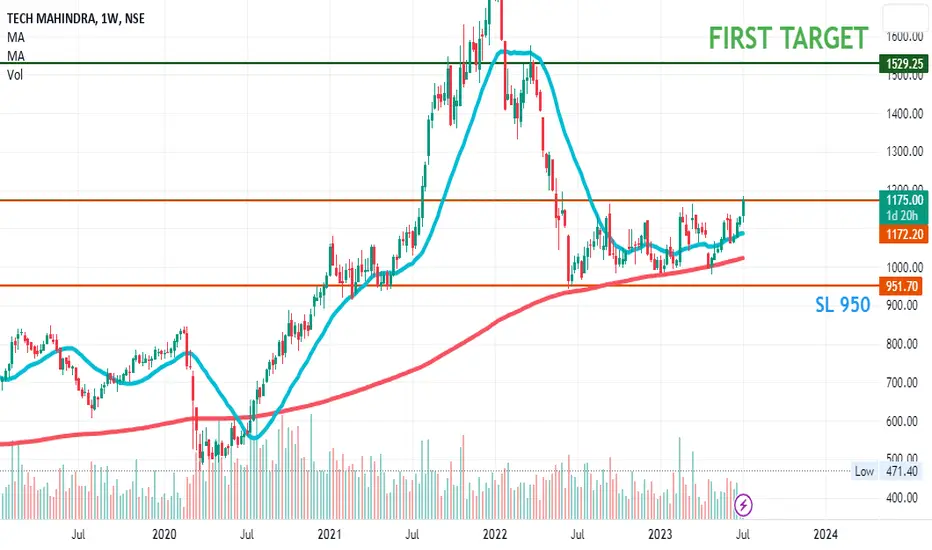
Tech mahindraBreaking out from long consolidation from range supported by gud volume. also supported by key moving average 20 & 200 MA.
in this trade risk is limited but reward is very gud.
SL 950
first target 1530
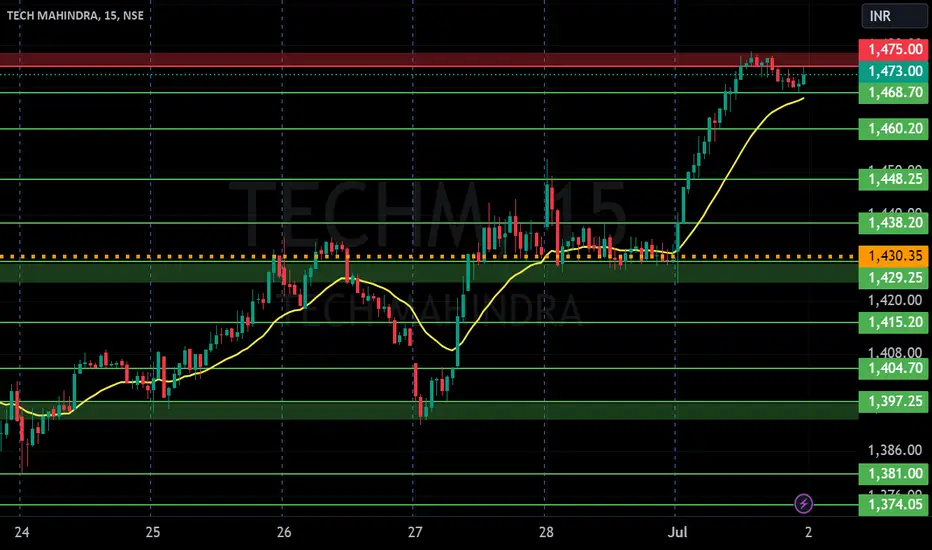
TECHMSupport and Resistance Levels: In technical analysis, support and resistance levels are significant price levels where buying or selling interest tends to be strong. They are identified based on previous price levels where the price has shown a tendency to reverse or find support.

TECH MAHINDRA S/R for 2/7/24Support and Resistance Levels: In technical analysis, support and resistance levels are significant price levels where buying or selling interest tends to be strong. They are identified based on previous price levels where the price has shown a tendency to reverse or find support.
Support levels are represented by the green line and green shade, indicating areas where buying interest may emerge to prevent further price decline.
Resistance levels are represented by the red line and red shade, indicating areas where selling pressure may arise to prevent further price increases. Traders often consider these levels as potential buying or selling opportunities.
Breakouts: Breakouts occur when the price convincingly moves above a resistance level (red shade) or below a support level (green shade). A bullish breakout above resistance suggests the potential for further price increases, while a bearish breakout below support suggests the potential for further price declines. Traders pay attention to these breakout signals as they may indicate the start of a new trend or significant price movement.
20 EMA: The yellow line denotes 20 EMA, to interpret the 20 EMA, you need to compare it with the prevailing stock price. If the stock price is below the 20 EMA, it signals a possible downtrend. But if the stock price is above the 20 EMA, it signals a possible uptrend.
Disclosure: I am not SEBI registered. The information provided here is for learning purposes only and should not be interpreted as financial advice. It is important to consult with a qualified financial advisor before making any investment decisions. Tweets neither advice nor endorsement.
Tech Mahindra is in a great hurry. IT share has been moving much slower than expected in the past some time. But now since last one month a different type of dominance is seen in IT shares. Which can be easily seen in Mahindra's daily chart. Despite a little speed, TechMahindra is trading near a strong sport zone. And last year also it proved to be a good share.
TechmSimple ORB strategy with volume above blue line close buy view(already closed)
Close below Red line I will close
Educational purpose only

TECH MAHINDRA LONG TRADE IDEAThis is not just an idea for me as I have entered the setup.
All things mentioned in chart.
This is like a personal journal for me. I do not provide tips and strictly advise you not to copy my trades.
