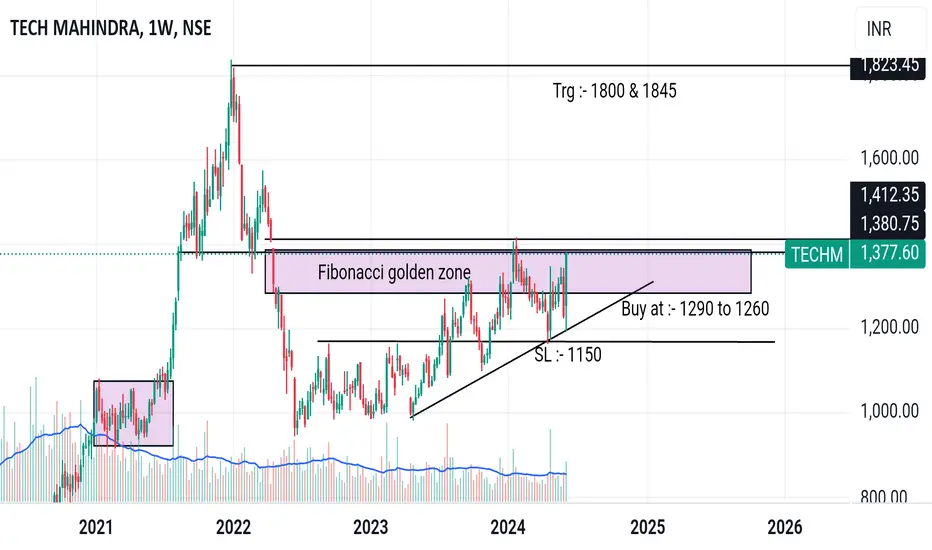
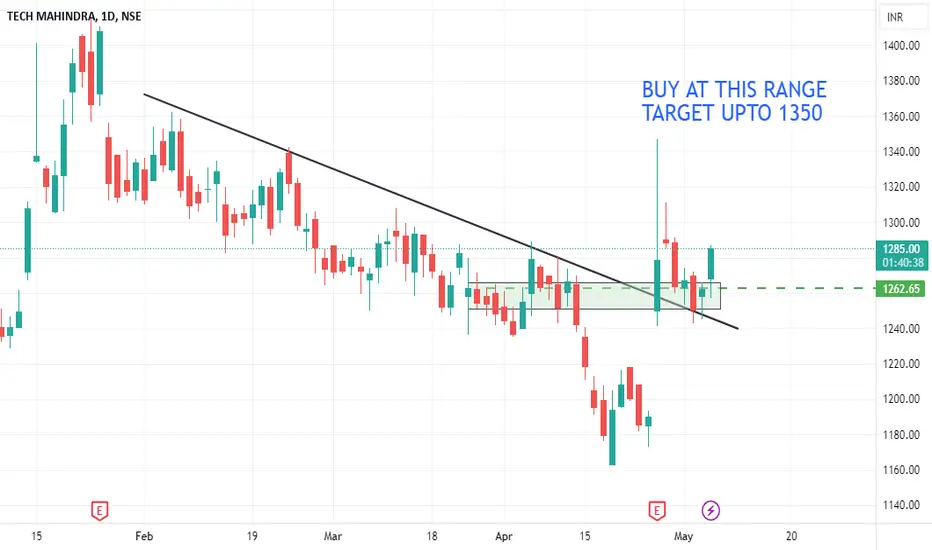
Tech Mahindra Buy at :- 1290 & 1260
Sl :- 1150
Trg :- 1800 & 1850
Weekly time frem analysis
Buying ke liye ek aachi opportunity ban sakti hai agar stock thoda down aake diye gaye lavel ke upar jata hai to
Weekly candel closing dena bahot important hai
Stock febonachi gold zone me bhi hai
TECHM trade ideas
Tech M : Updated Price Action- We posted the initial analysis of Tech M on March 5th, 2023 which can be accessed below.
- Given that the price action changed with time, we decided to post the updated price action for the ease of our followers
- The chart is pretty self-explanatory
- The Price action is similar to that of NSE:WIPRO . The price consolidated for over a year and finally gave a good breakout.
- Follow the comments below for regular updates on future price action 👇
- The Indian IT sector too is approaching its critical resistance for the third time.
- Looks like we may see some good momentum in the IT Space. What do you think?
- We appreciate your support! If you liked our analysis, Do give us a 🚀
⚠️Disclaimer: We are not registered advisors. The views expressed here are merely personal opinions. Irrespective of the language used, Nothing mentioned here should be considered as advice or recommendation. Please consult with your financial advisors before making any investment decisions. Like everybody else, we too can be wrong at times ✌🏻
TECHM | Tech Mahindra idea | Key LevelsTECHM | Tech Mahindra idea | Key Levels
Tech Mahindra good sign is that candle start with SP0 1257/-
if stay above sp0 it can test 1390 , opening above 1390 will be a bullish breakout for TECHM
while rejection here can push it to 1010/-
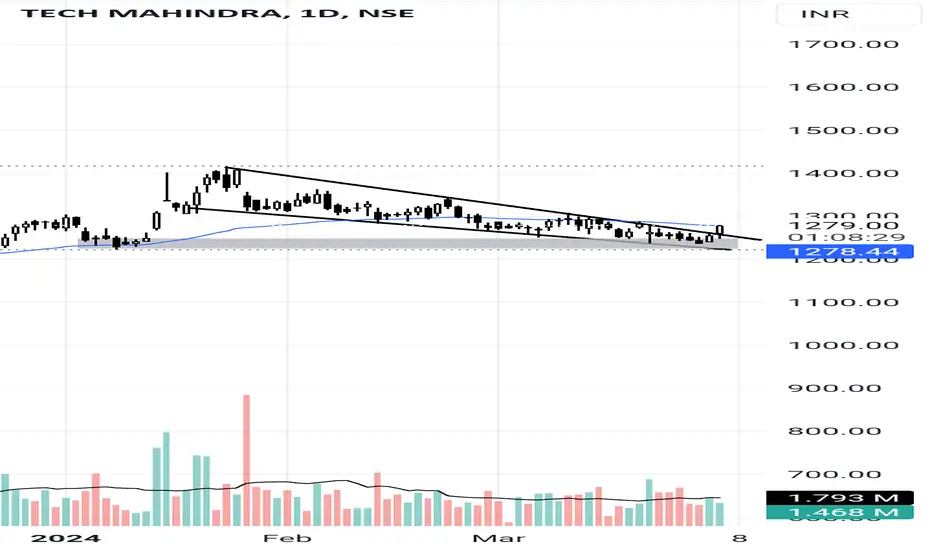
TechM Fair chance of Correction
Price has reacted to a Fresh 3 Month Supply also there is a fresh 6 Month Demand formed,
Hence we are expecting a Correction.
After reacting to the Fresh Quarterly Supply, as per Weekly chart we have drawn trend-lines which also show the Support and then we see Price has violated the Support forming a new low, which indicates the sellers are coming in Power,
Considering the previous low violation and the 3 Months Soucre Supply this is the Short position.

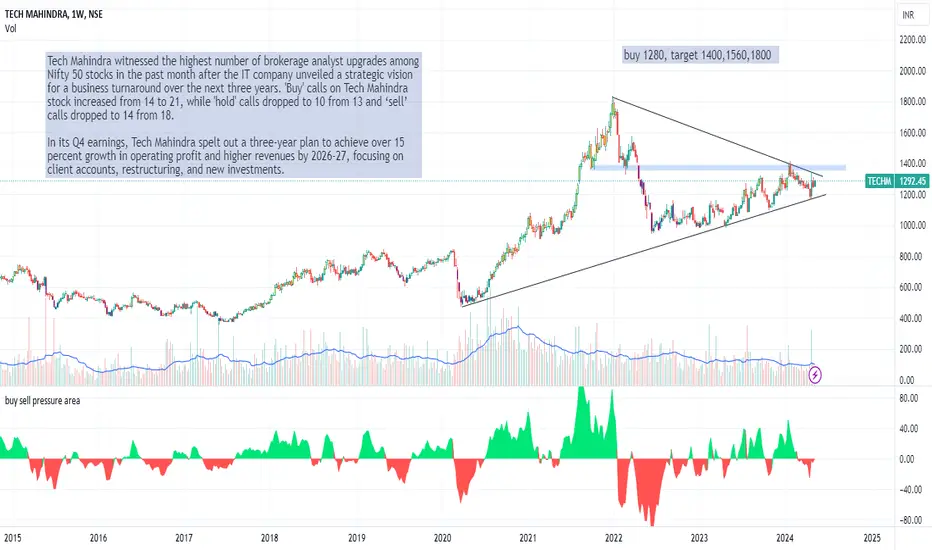
tech mTech Mahindra witnessed the highest number of brokerage analyst upgrades among Nifty 50 stocks in the past month after the IT company unveiled a strategic vision for a business turnaround over the next three years. 'Buy' calls on Tech Mahindra stock increased from 14 to 21, while 'hold' calls dropped to 10 from 13 and ‘sell’ calls dropped to 14 from 18.
In its Q4 earnings, Tech Mahindra spelt out a three-year plan to achieve over 15 percent growth in operating profit and higher revenues by 2026-27, focusing on client accounts, restructuring, and new investments.
Tech Mahindra just boomedDue to its weekly support zone and weekly trendline it's just got a blip boom in pvs week
Next move could be btw blue and yellow zones for next week
Stay tuned for more
ASK for analysis of any Nse based stock you want

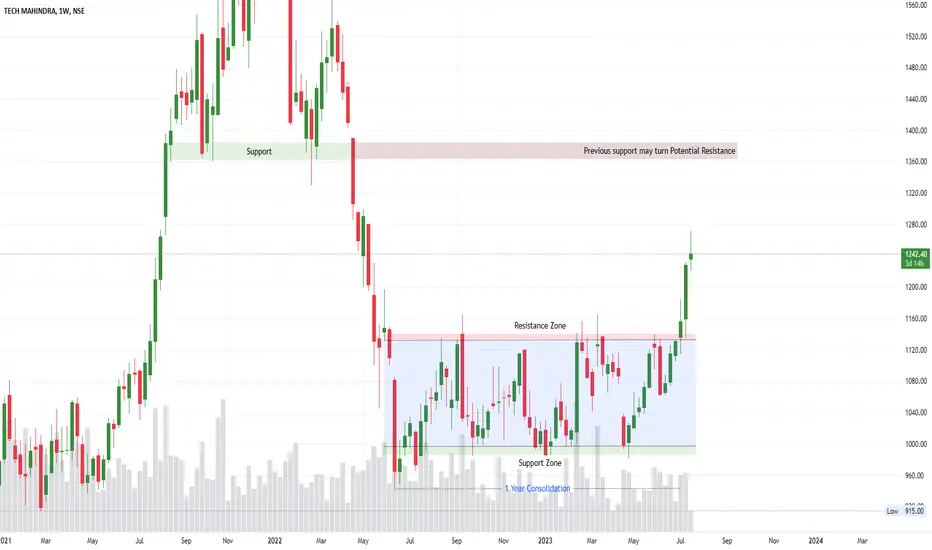
TECH MAHINDRA S/R Support and Resistance Levels: In technical analysis, support and resistance levels are significant price levels where buying or selling interest tends to be strong. They are identified based on previous price levels where the price has shown a tendency to reverse or find support.
Support levels are represented by the green line and green shade, indicating areas where buying interest may emerge to prevent further price decline.
Resistance levels are represented by the red line and red shade, indicating areas where selling pressure may arise to prevent further price increases. Traders often consider these levels as potential buying or selling opportunities.
Breakouts: Breakouts occur when the price convincingly moves above a resistance level (red shade) or below a support level (green shade). A bullish breakout above resistance suggests the potential for further price increases, while a bearish breakout below support suggests the potential for further price declines. Traders pay attention to these breakout signals as they may indicate the start of a new trend or significant price movement.
Disclosure: I am not SEBI registered. The information provided here is for learning purposes only and should not be interpreted as financial advice. It is important to consult with a qualified financial advisor before making any investment decisions. Tweets neither advice nor endorsement.
Review and plan for 26th April 2024 Nifty future and banknifty future analysis and intraday plan in kannada.
This video is for information/education purpose only. you are 100% responsible for any actions you take by reading/viewing this post.
please consult your financial advisor before taking any action.
----Vinaykumar hiremath, CMT

TECH MAHINDRA SUPPORT AND RESISTANCESupport and Resistance Levels: In technical analysis, support and resistance levels are significant price levels where buying or selling interest tends to be strong. They are identified based on previous price levels where the price has shown a tendency to reverse or find support.
Support levels are represented by the green line and green shade, indicating areas where buying interest may emerge to prevent further price decline.
Resistance levels are represented by the red line and red shade, indicating areas where selling pressure may arise to prevent further price increases. Traders often consider these levels as potential buying or selling opportunities.
Breakouts: Breakouts occur when the price convincingly moves above a resistance level (red shade) or below a support level (green shade). A bullish breakout above resistance suggests the potential for further price increases, while a bearish breakout below support suggests the potential for further price declines. Traders pay attention to these breakout signals as they may indicate the start of a new trend or significant price movement.
Disclosure: I am not SEBI registered. The information provided here is for learning purposes only and should not be interpreted as financial advice. It is important to consult with a qualified financial advisor before making any investment decisions. Tweets neither advice nor endorsement.

Descending Triangle breakdown in TECH Mahindra.NIFTY IT Index has given a breakdown of the Inverted cup and handle pattern, thus making the IT sector weak and bearish.
Major IT stocks have given a breakdown. Example: Infosys, Wipro, Coforge, Mphasis.
This script has also broken out of a descending triangle pattern. This pattern is considered as one of the most aggressive patterns. If this breakdown is successful then we may witness a quick down move in this script.
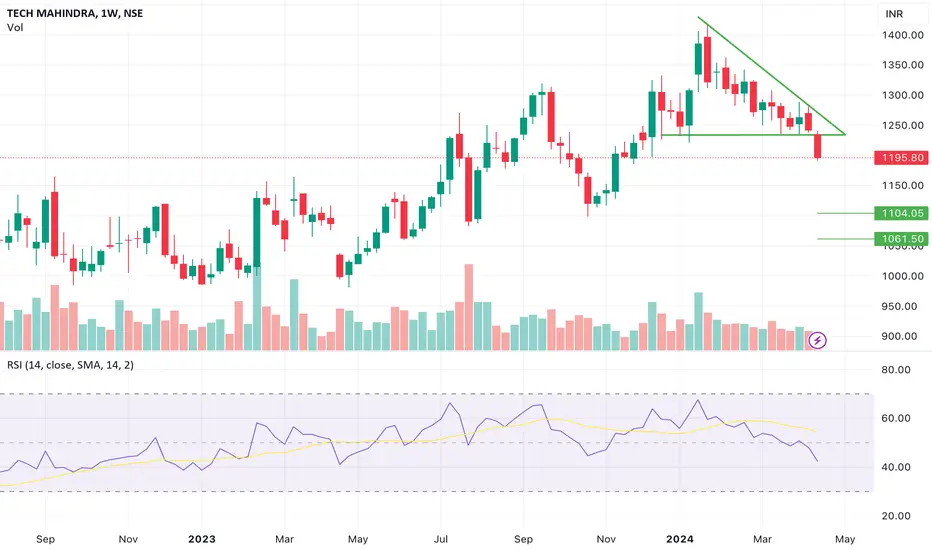
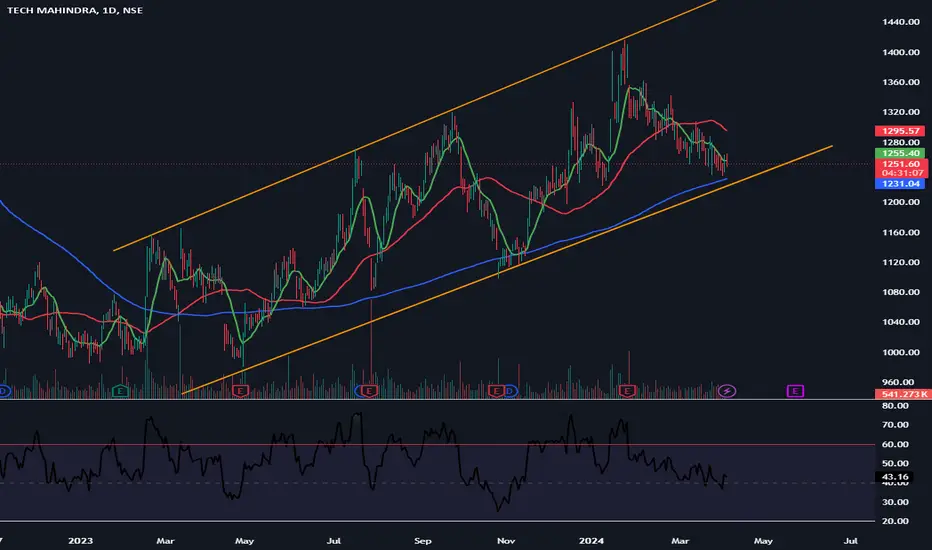
Techm Cup and handle being formed?Tech Mahindra is forming a Cup and handle on the weekly,
an aggressive breakout from the flag can give a 30% move to the all time high
A potential multibagger.
If holding, this could be a good point to add.
If not, this place could be a good first entry
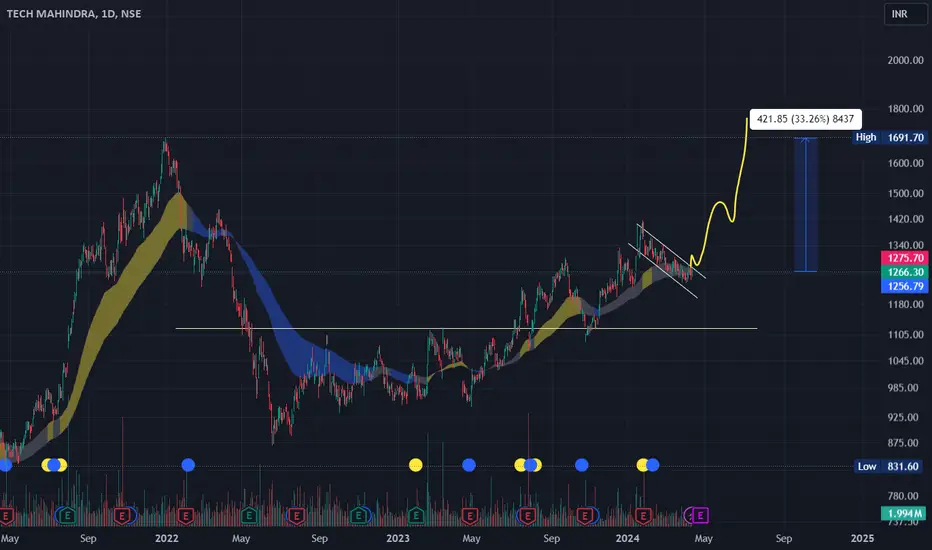
Tech Mahindra - Tech stock to buy
Drawn are the two green parallel lines on the chart. Lower being SL and upper is the figure above which to buy. Target open. Time candle 11:48 a.m. Adhere to this candle and buy only above high and sell below.
Disclaimer: I am not a SEBI registered analyst and it is only for educational purposes. Please consult your financial advisor before making any decision. I will not be responsible for your profits or losses.
Thank you
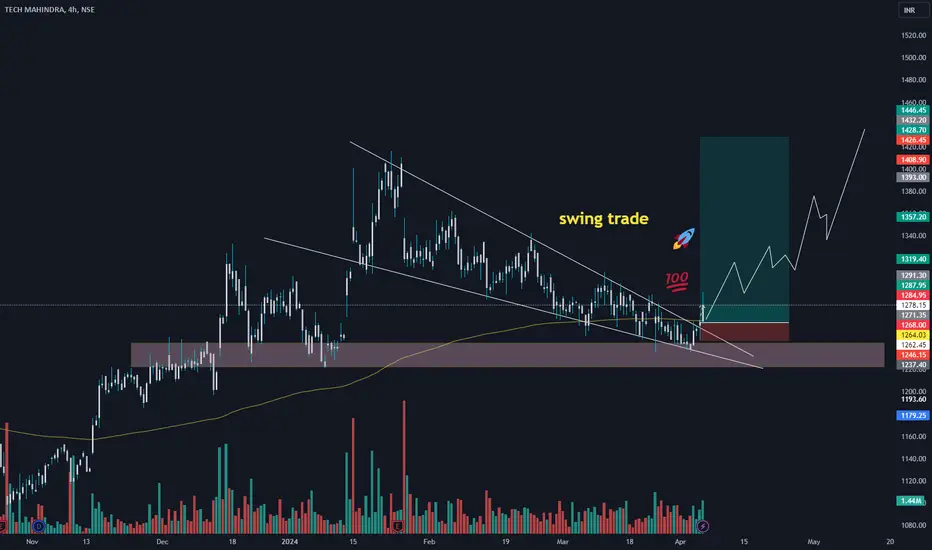
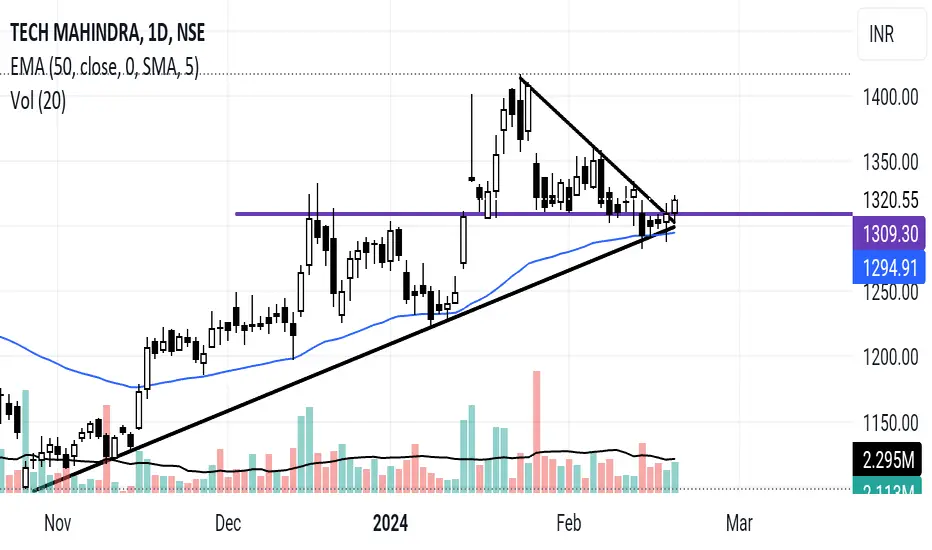
TECH MAHINDRA SWING TRADE march 4/ 4/2024
swing trade perfect symmetrical triangle long term opportunity take trade according to own risk this is not call just a analysis.
#techmahindra trendline breakFirst things keep yo mind tech sector is pretty weak. Structure of stock is pretty good after reversing from supp line broked falling trend line. If sustain than it can give good return but keep first thing in yo mind above mentioned. Sector is weak it can impact stock too in simple it risky setup.it for education purpose only. am will not responsible for your any lose.
TechM 50% - 100 % Upside Potential in CENSE:TECHM #TECHM | 🔥 Buy TechM Apr 1300CE | 🔥 50% - 100 % Upside Potential in CE
✅ Buy Level - Rs1230 - Rs 1250
✅ SL - Rs 1175
✅ Target - Rs 1299/1320/13601390
✅ Trading at the lower end of the Rising Channel
✅ Taking support at 200 Day SMA
Trade :-
✅ Buy Future
✅ Buy TechM Apr 1300CE - Rs 15-20
✅ Apr 1300 CE - CMP 20
Look at the chart for more information
Thanks
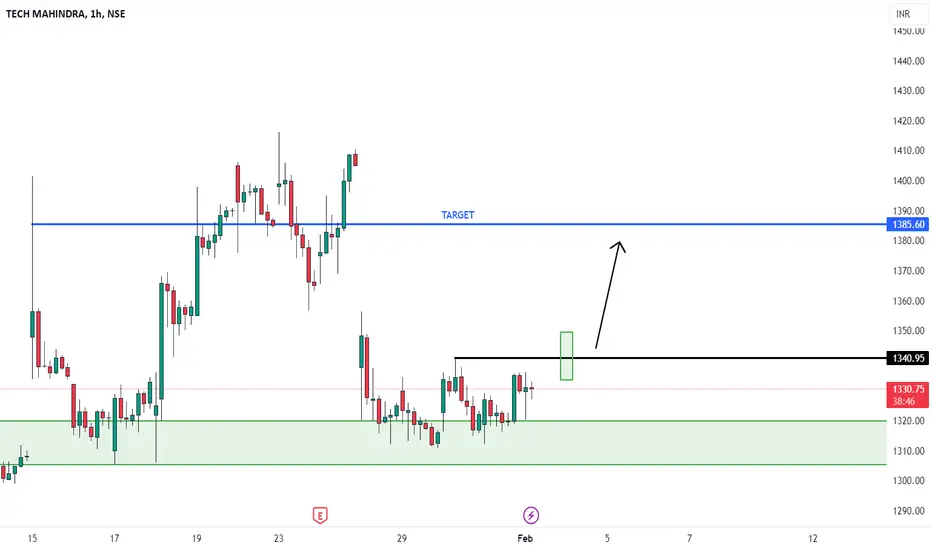
TECHMAHINDRA BUY Techmahindra Good Buying zone. 1340 Resistance point wait for candle close above . Consolidate in hour timeframe .
Expected Good Target .
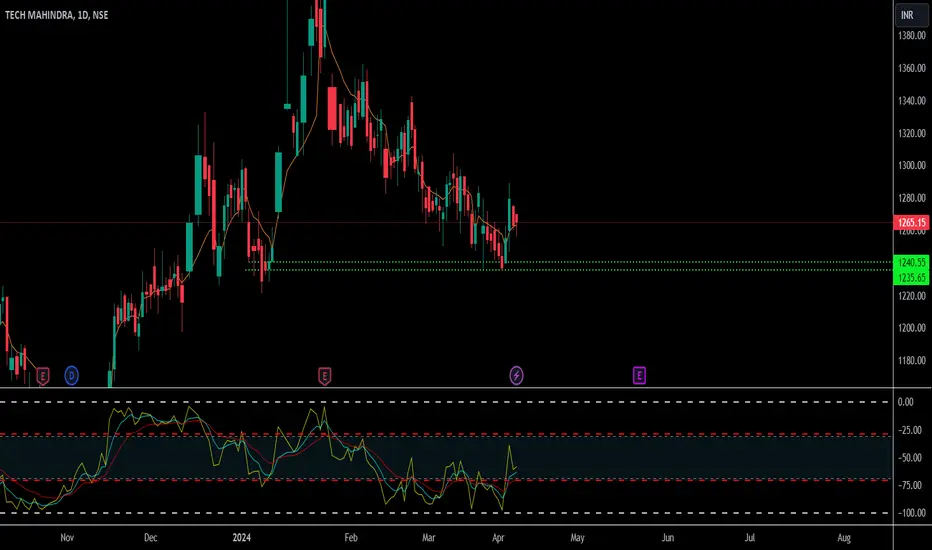
TECHM at reversal zoneTECHM is at potential reversal zone . stock may go up or down .if closes below 1237.50 , exit the trade. if goes up minimum 10% can be expected. Risk is less..

TECH MAHINDRA S/R for 11/3/24Support and Resistance Levels: In technical analysis, support and resistance levels are significant price levels where buying or selling interest tends to be strong. They are identified based on previous price levels where the price has shown a tendency to reverse or find support.
Support levels are represented by the green line and green shade, indicating areas where buying interest may emerge to prevent further price decline.
Resistance levels are represented by the red line and red shade, indicating areas where selling pressure may arise to prevent further price increases. Traders often consider these levels as potential buying or selling opportunities.
Breakouts: Breakouts occur when the price convincingly moves above a resistance level (red shade) or below a support level (green shade). A bullish breakout above resistance suggests the potential for further price increases, while a bearish breakout below support suggests the potential for further price declines. Traders pay attention to these breakout signals as they may indicate the start of a new trend or significant price movement.
Keltner Channel: The Keltner Channel is a technical indicator that uses an exponential moving average (EMA) and an average true range (ATR) to create an upper and lower channel around the price action. The upper line of the channel represents the upper limit of the average range, and the lower line represents the lower limit. Traders can use the Keltner Channel to identify potential long and short positions.
Long Position: A long position may be considered when the price is trading above the upper line of the Keltner Channel. This suggests that the price is trading above the average range and may continue in an upward trend, potentially offering buying opportunities.
Short Position: A short position may be considered when the price is trading below the lower line of the Keltner Channel. This suggests that the price is trading below the average range and may continue in a downward trend, potentially offering selling opportunities.
Disclosure: I am not SEBI registered. The information provided here is for learning purposes only and should not be interpreted as financial advice. It is important to consult with a qualified financial advisor before making any investment decisions. Tweets neither advice nor endorsement.

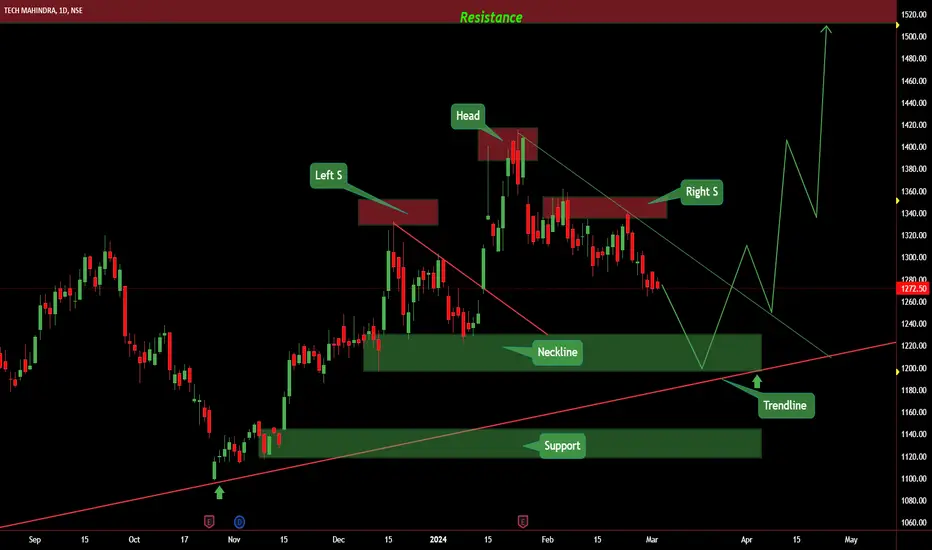
TECHM:: Long@Neckline this stock is falling now..
we have a strong support lies at 1200 range...in the form of trendline and neckline both are strong, multiple times price takes the help of trendline support...
Head and shoulders pattern is also detected in this stock price.
a strong breakout is observed from neckline...
so keep looking for long in this stock from neckline for the target of 1500.
we have a strong resistance at 1500 levels.
#techmahindra retest entry Setup is really good. on weekly time frame it formed cup pattern and gave break out of it now talking retest of that lvl with good pattern (falling trend line breakout). Technical are really good but fundamental are descent so that why I will say stock is bit risky so keep bit tight sl. Note: this is not any buy/sell recommendation.
TECH MAHINDRA S/R for 29/1/24Support and Resistance Levels:
Based on the price action, you have to identify two significant levels: the red line acting as resistance and the green line acting as support. Additionally, there have marked red and green shades to represent resistance and support zones, respectively.
Support: The green line and green shade represent support levels. These levels are where the price tends to find buying interest, preventing it from falling further. Traders can consider these levels as potential buying opportunities.
Resistance: The red line and red shade represent resistance levels. These levels are where the price tends to encounter selling pressure, preventing it from rising further. Traders can consider these levels as potential selling opportunities.
Breakouts: If the price breaks above the resistance zone (red shade) convincingly, it may indicate a bullish breakout, and the price could move higher to the next resistance level. On the other hand, if the price breaks below the support zone (green shade) convincingly, it may indicate a bearish breakout, and the price could move lower to the next support level.
Keltner Channel:
The Keltner Channel is a technical indicator that uses an exponential moving average (EMA) to create an upper and lower channel around the price action. Traders can use this channel to identify potential long and short positions.
Long Position: If the price is above the upper line of the Keltner Channel, it may indicate a potential long opportunity, as it suggests the price is trading above the average range and might continue in an upward trend.
Short Position: If the price is below the lower line of the Keltner Channel, it may indicate a potential short opportunity, as it suggests the price is trading below the average range and might continue in a downward trend.
