ZEEL trade ideas
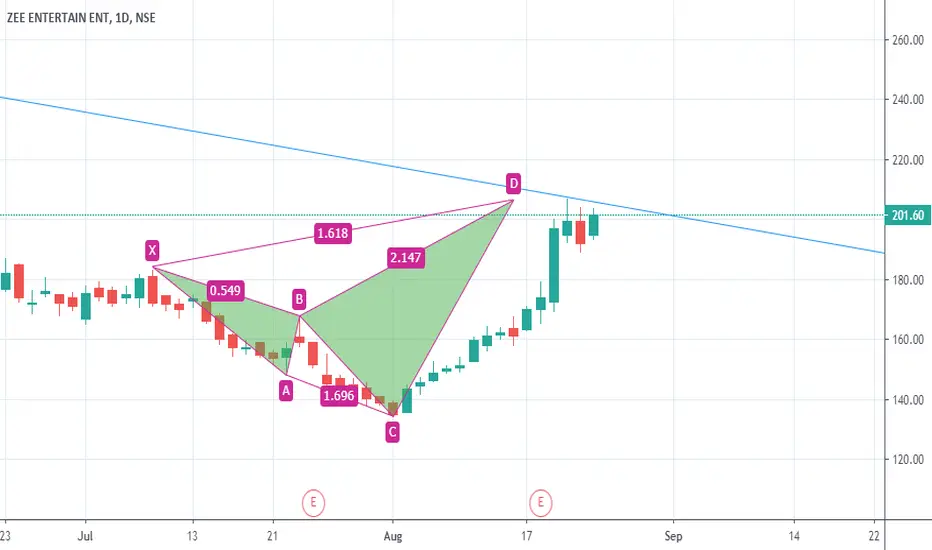
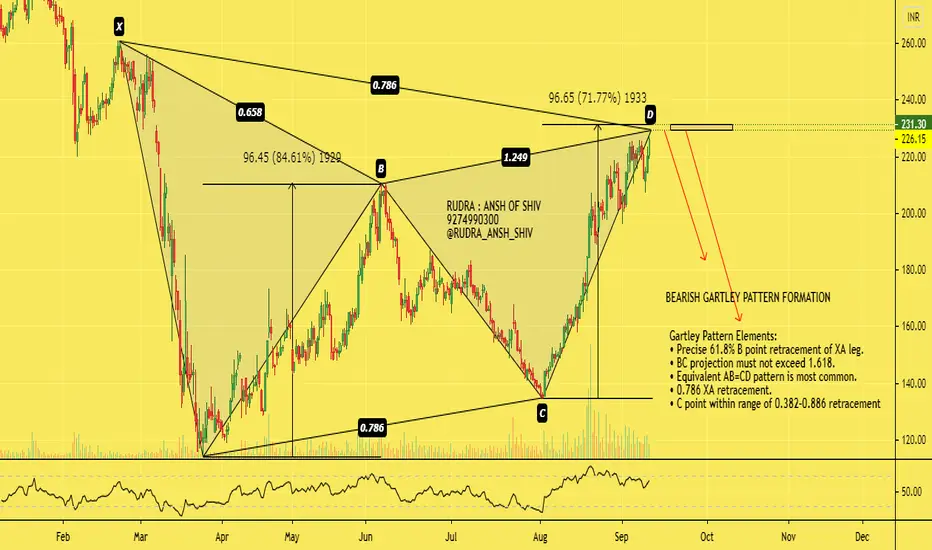
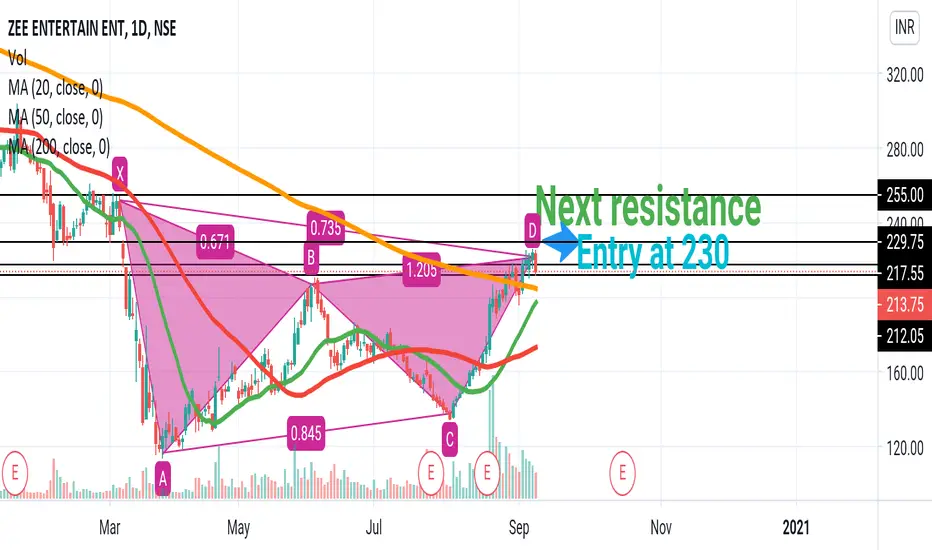
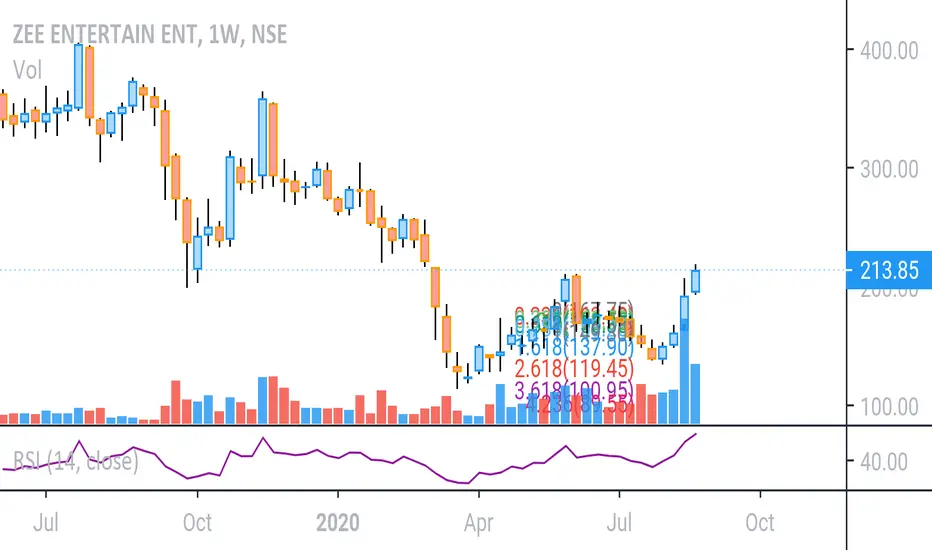
ZEE good short candidateZee counter have formed bearish gartley fomation with negative divergence on RSI indicator,,
can be shorted in PRZ zone,, with stoploss of 2% above prz levels
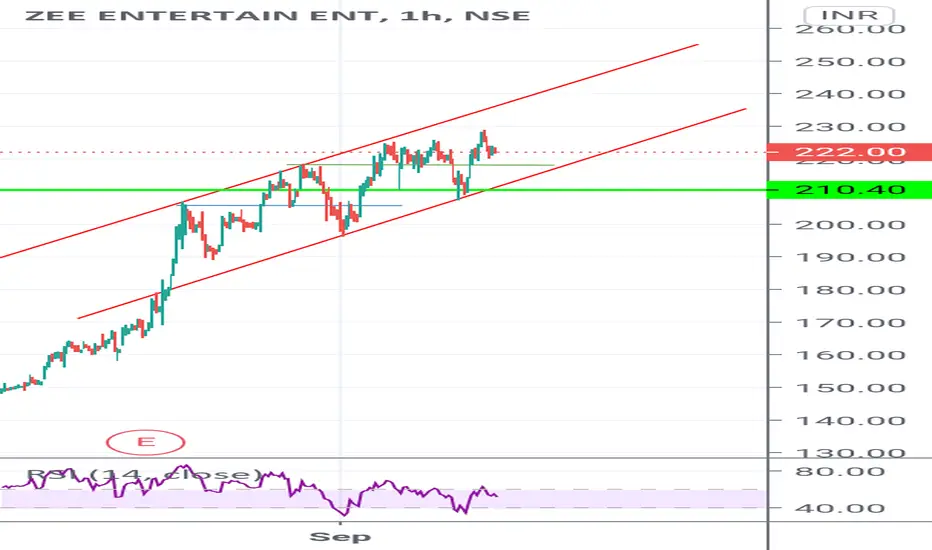
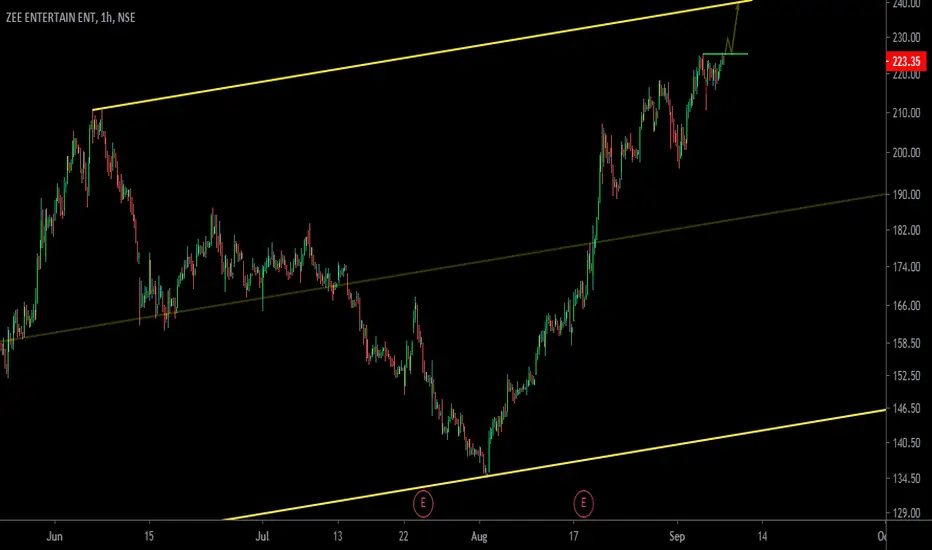
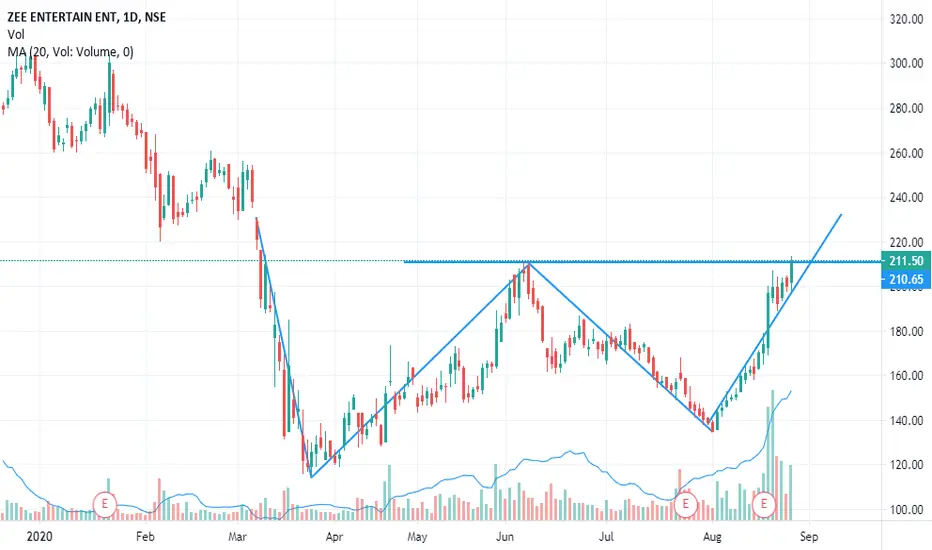
INTRADAY STOCKS SELECTIONS ( 8/9/2020) Trading channels can be drawn on charts to help see uptrends and downtrends in a stock, commodity, ETF, or forex pair.
Traders also use channels to identify potential buy and sell points, as well as set price targets and stop-loss points.
Ascending channels angle up during uptrends and descending channels slope downward in downtrends.
Other technical indicators, such as volume, can enhance the signals generated from trading channels.
How long the channel has lasted will help determine the trend's underlying strength.
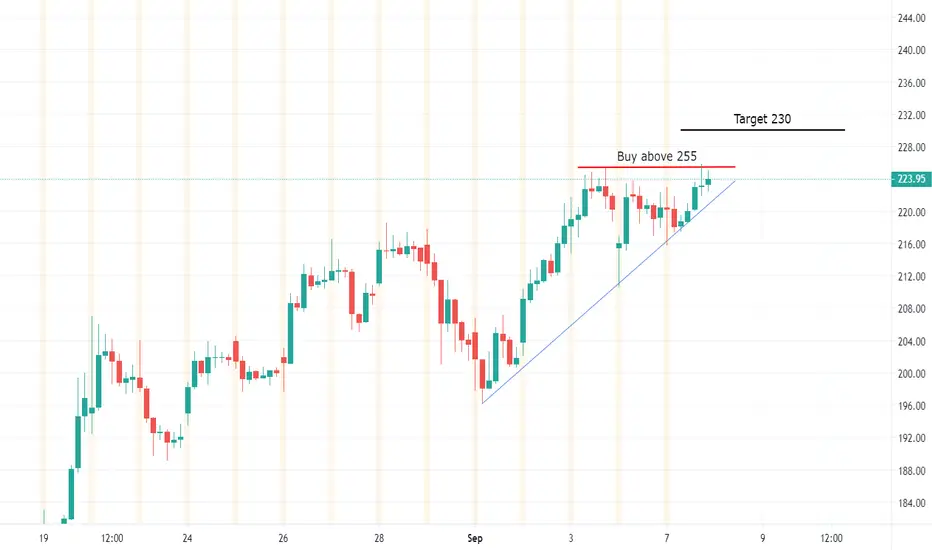
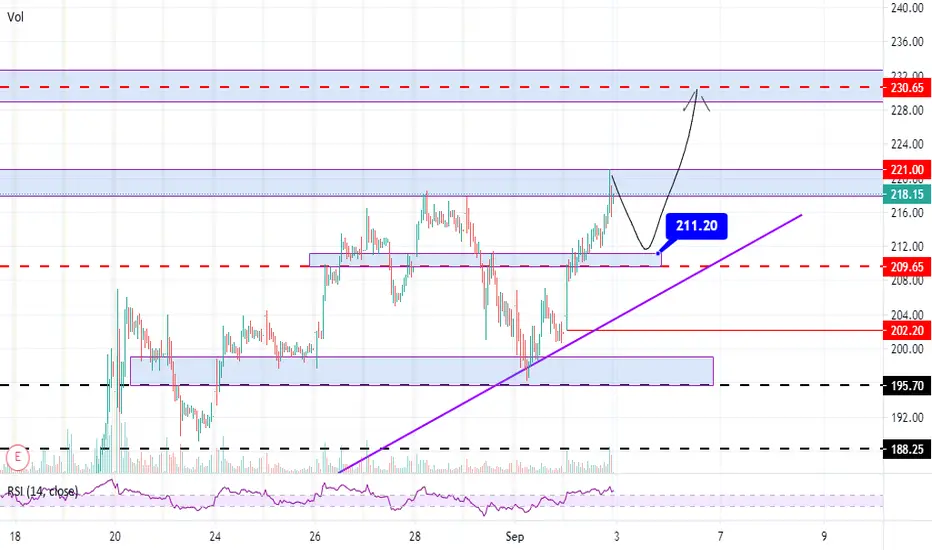
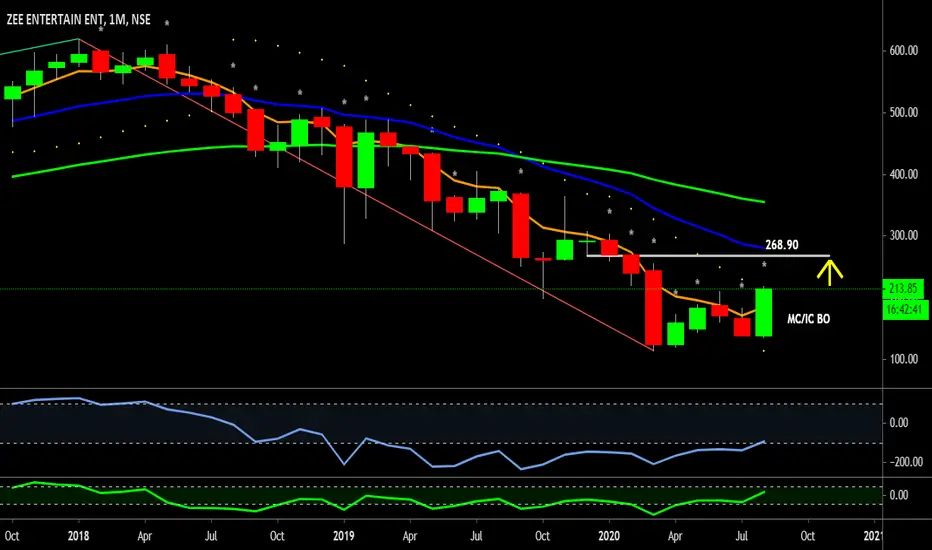
ZEELIT SEEMS TO HAVE A GOOD MOVE AS HAS CLOSED NEAR WEEKLY AND DAILY RESISTANCE
IF SUSTAINS 220, THEN 227,233 AND 237 COMING ON UPSIDE
ELSE 211 AND 207 ON DOWNSIDE
PS - YOU MIGHT BE ABLE TO SPOT A PATTERN HERE
**********************************************************************************************************************************************
Hi all,
Its pleasure to have you all here.
I have started putting these charts as a contribution from my side to all people who are new to business, as I had to struggle a lot without any sources at disposal. So please consider this a just small contribution from my side.
Few Honest Disclosures:
1. Any idea shared is my personal view, its not a recommendation, neither any kind of paid propaganda, so please
do your bit of research.
2. Ideas shared does not mean that I trade all or have position in them, this is just a helping hand to all.
3. I expect no comments or like nor any negativity, as I said its just a small helping hand from my side, please plan your risk and trade as per your capacity.
4. To trade in Cash, options or futures is your sole choice and your own risk
5. I am no expert in Tech Indicators, I believe in support resistance and trendline theory, you may use this as a supplement theory for better results.
6. I work for my own living, this is a hobby which I do sincerely to help anyone who might come across my charts.
***********************************************************************************************************************************************
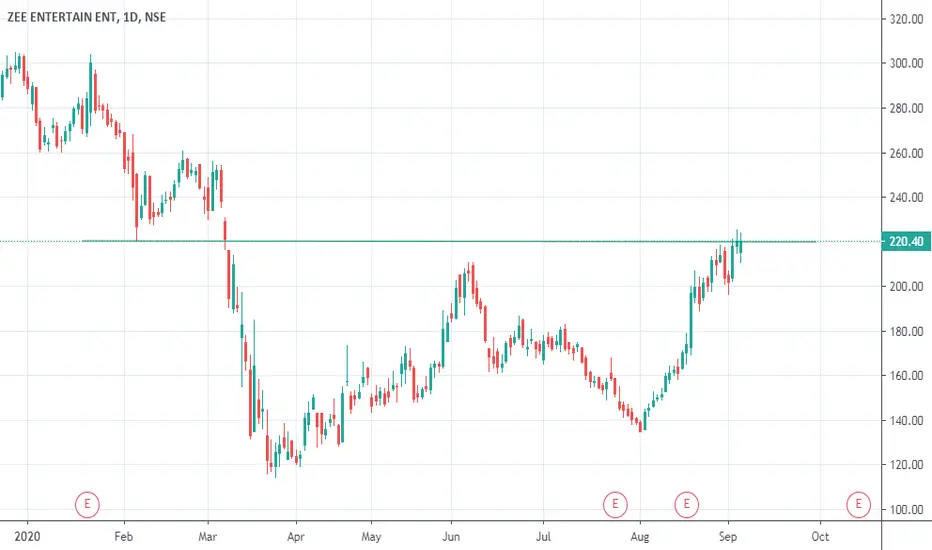
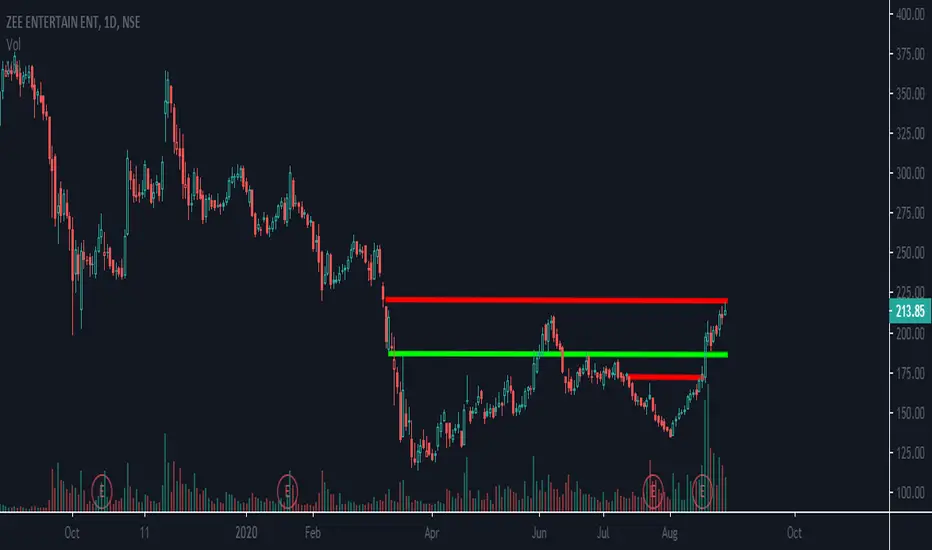
Zeel retested breakout zoneZeel retested breakout zone.
One can go long with stop loss 160 target 200+

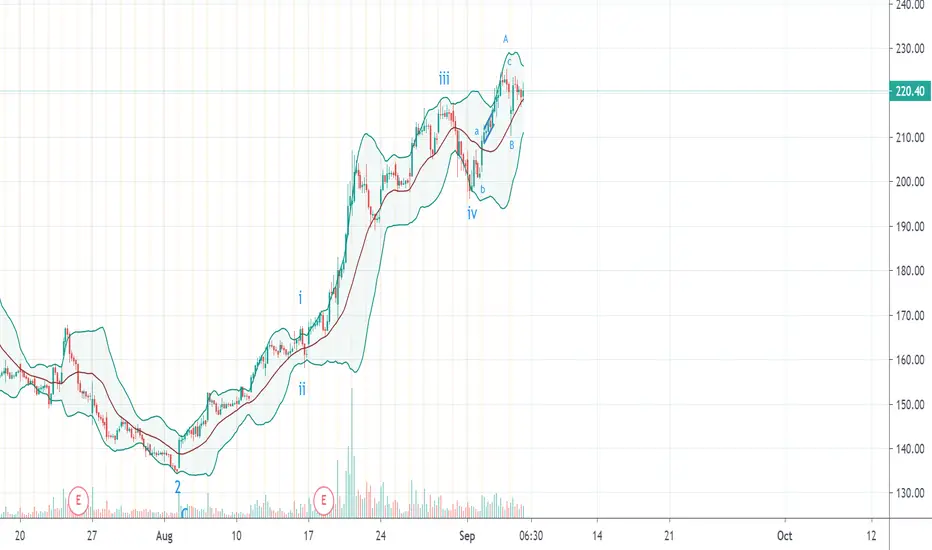
LONGZee has done its bottom and ended with Ending Diagonal triangle on weekly chart which is clear indication of reversal. from 114 to 210 it made the first impulse wave and from 210 it corrected 61.8% and made wave 2 at 134. now the stock is making wave three whose first possible point will be 280 and thereafter 380. moreover, the move from 134 to 225 is quite steep and sharp which is a clear indication of wave 3. therefore, long positions can be initiated for target of 280 and 380 with stop loss of 188.
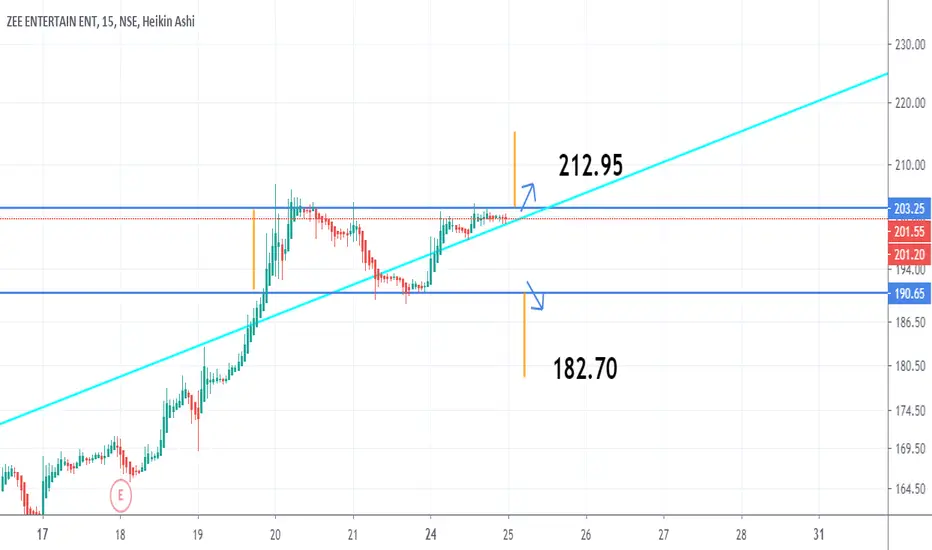
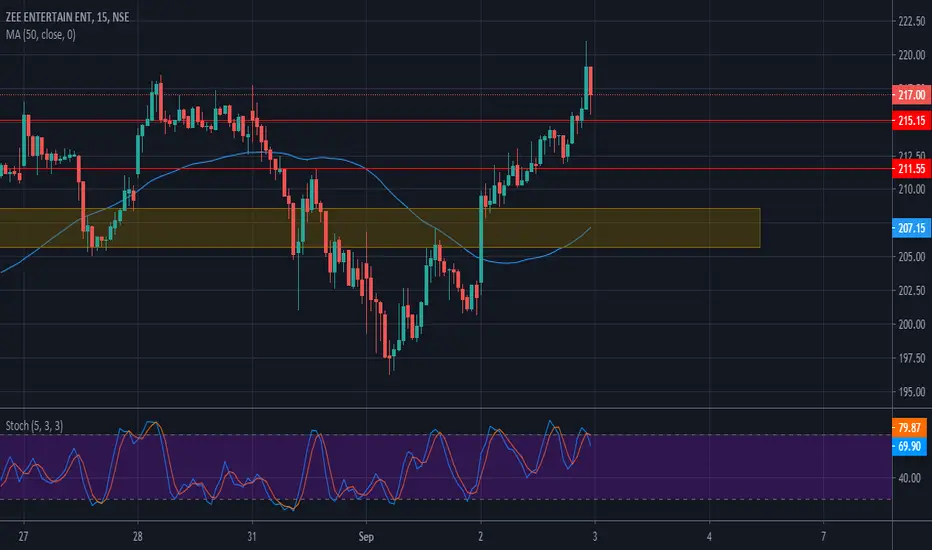
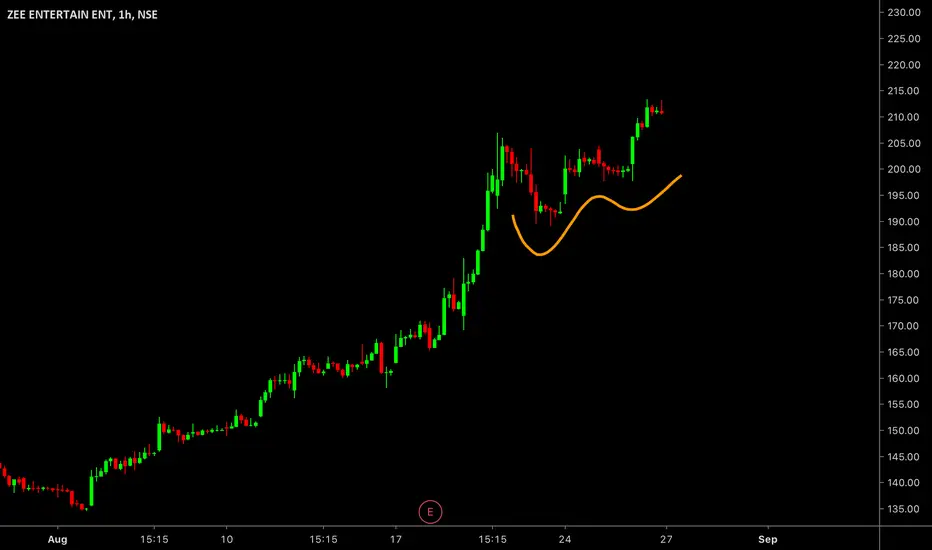
INTRADAY ANALYSIS - ZEE LTDHi Traders,
This stock has made a higher high in the 15m time frame. The short term support for this stock is at 215.15 and 211.55. We have the golden zone between 208.60 and 205.70. You can use any strategy to enter at these levels. We dont recommend a blind entry at these levels without confirmation. A chart pattern in the 1m timeframe at these levels can be a good confirmation.
Pls Like and follow.
Happy Trading......
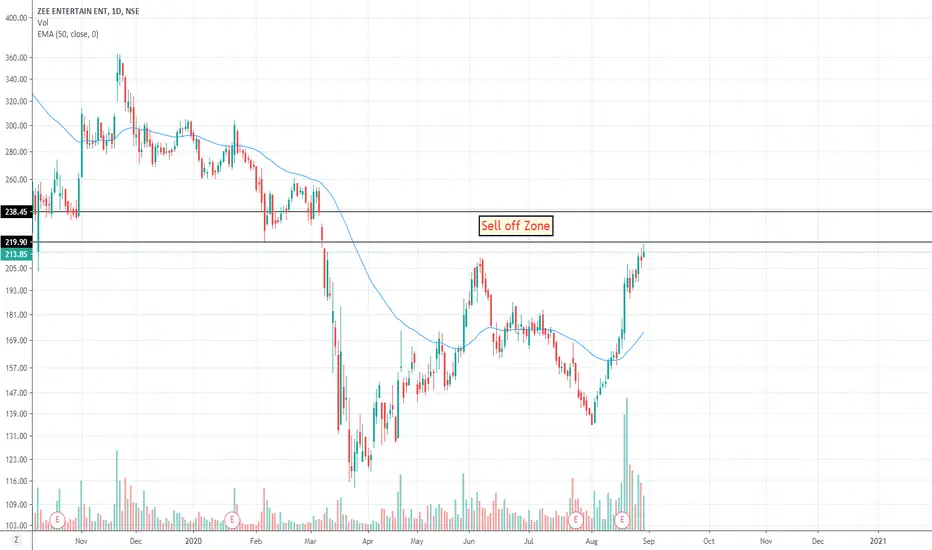
Approaching again sell off Zone. #NiftyStock approaching again its old selling zone, to be watched out
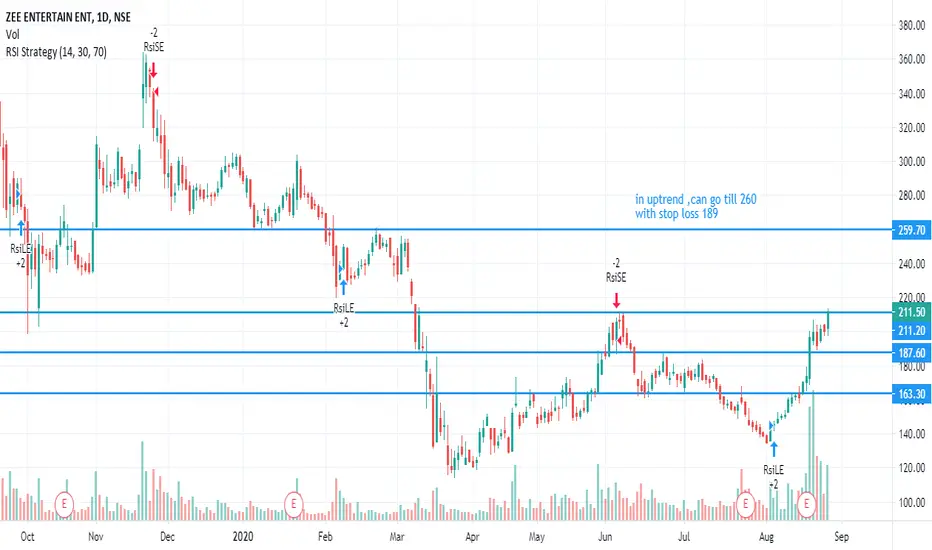
Zeel longSeptember series Monthly Pick 1
#ZEEL above 219 target 230 246 258 275+ breakout retest zone 200 SL 186 dcb
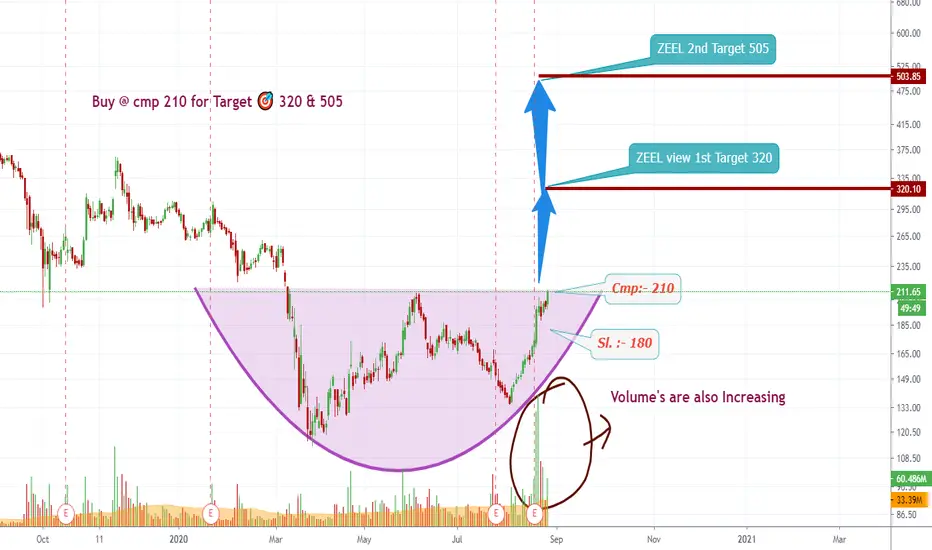
Buy ZEEL @ cmp 210 for Target 320 & 505Kindly Take advice of ur Financial Advisor before Investing...
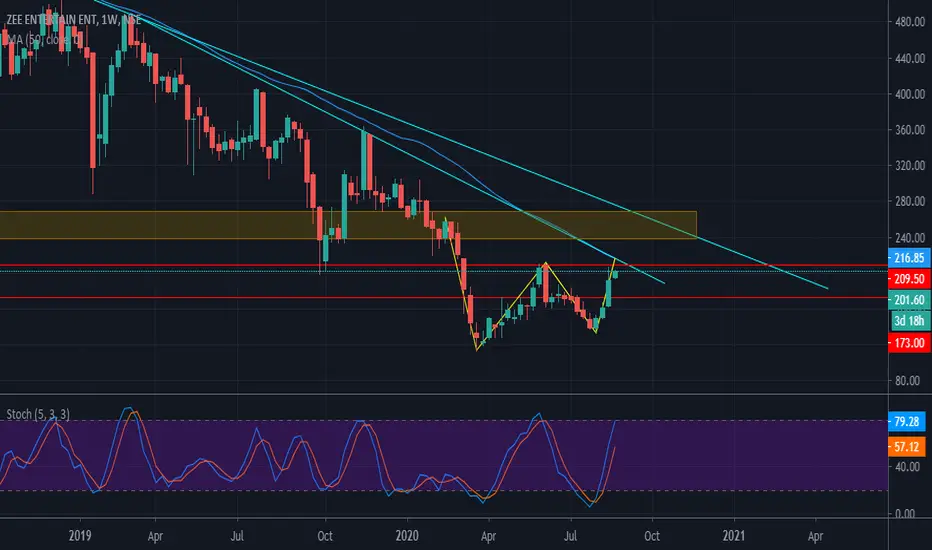
ZEE LTD - Complete Technical AnalysisHi Traders,
We have a mixed opinion on this stock, but will definitely add to our watchlist.
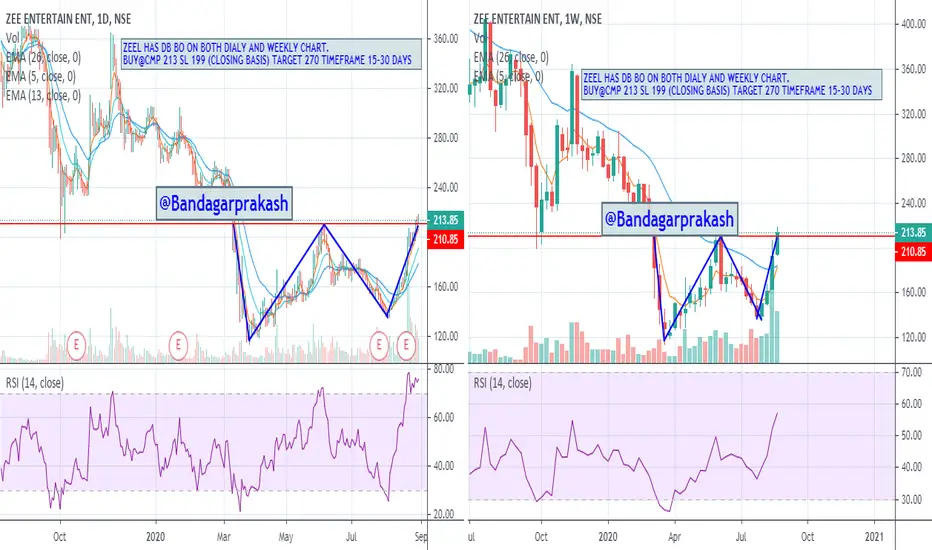
The weekly chart shows that this stock has been in a downtrend since jun 2018, and price is forming a double bottom pattern which indicates the end of this downtrend.
The stock price is approaching key resistance point at 209.50, which came in confluence with the inner trendline. A break of this trendline can result in price testing the outer trendline.
The golden zone is between 239 - 268.50 which can play as a resistance zone.
We can expect 300 levels on this counter by mid 2021, if we get a break of the outer trendline.
On a short term perspective, how the price reacts at 209.50 and the inner trendline will be a decision maker.
For this kind of complete technical analysis msg me the stocks that u would like to have complete technical analysis .
Pls Like and follow.
Happy Trading.....