Altseason isn’t cancelled, it’s just delayed. Here's WHY!CRYPTOCAP:BTC Dominance Update:
Altseason isn’t cancelled, it’s just delayed.
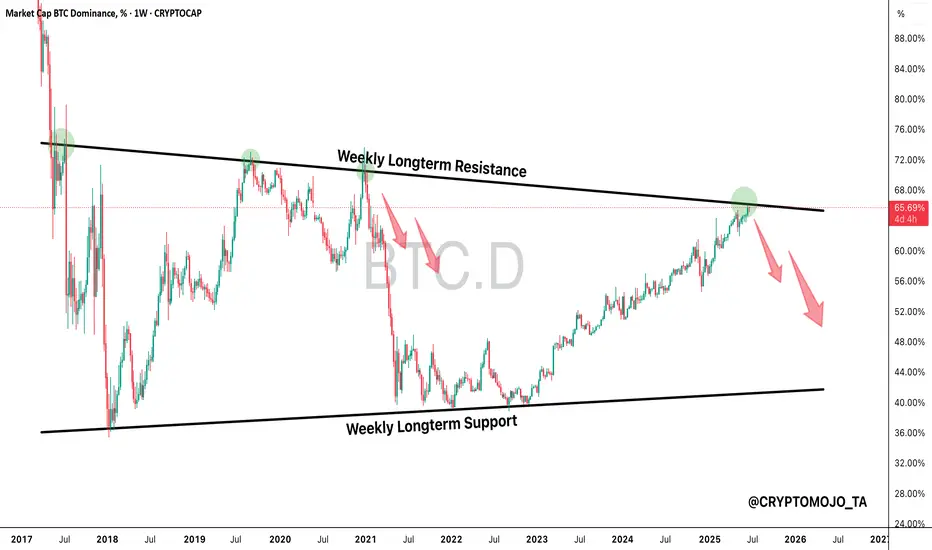
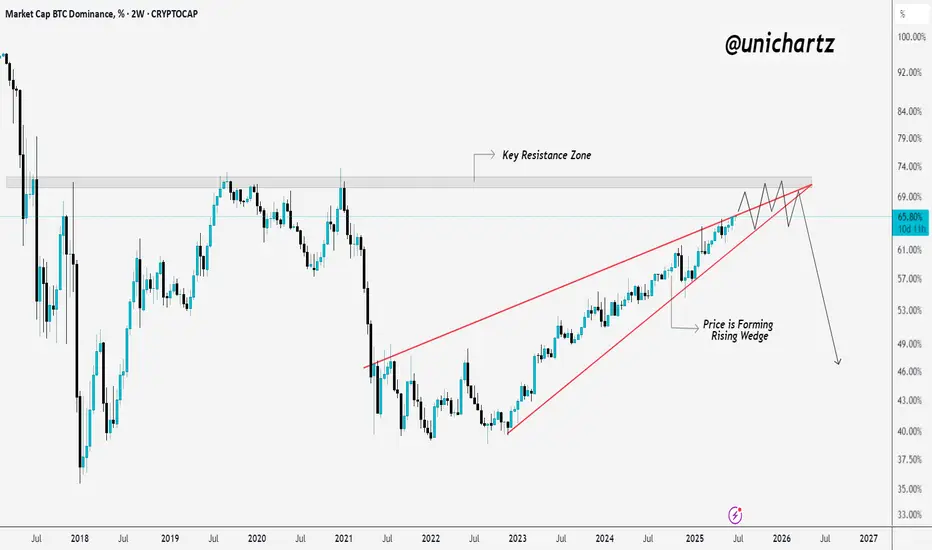
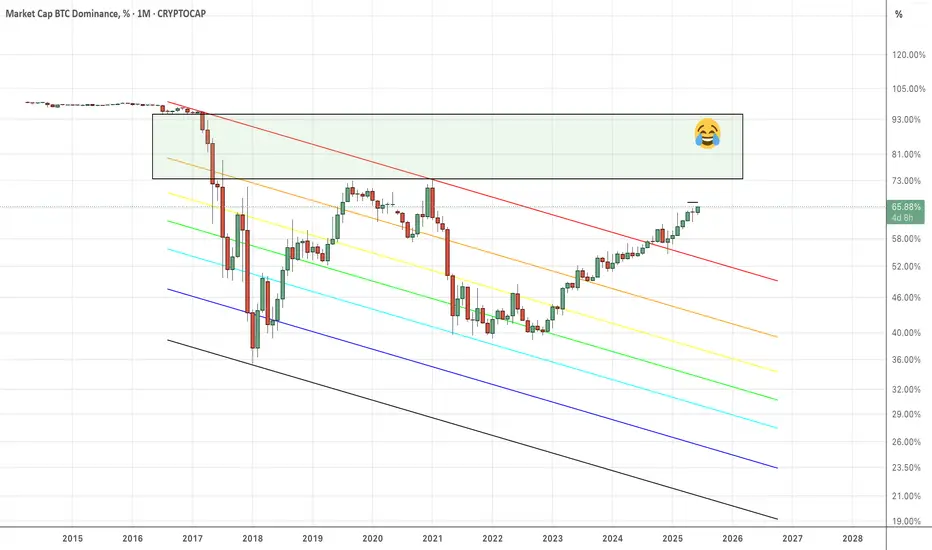
The key zone to watch is 69.5%–73% dominance. That’s where we’re likely to see a strong rejection if it doesn't start soon, which seems unlikely given the current circumstances.
The longer it takes to reach that level, the stronger the altcoin rally will be once it hits.
This isn’t hope, it’s exactly what the charts are showing.
Historically, 70% dominance has acted as a major reversal zone.
If there are signs of reversal before this level, I'll let you know beforehand.
So follow me if you don't and share this chart with your crypto friends.
Do not forget to keep cash/stables!
Let me know what you think in the comments.
Thank you
#PEACE
BTC.D trade ideas
JULY IS THE ALTCOIN SEASON
"We will witness the last rise at 68, and the altcoin season will follow after that. Be ready."
BTC DOMINANCE at pivotal juncture.Which direction do you favour?
The chart is inverted, so the up move will result in #Alts outperforming #Bitcoin.
Altseason Loading? BTC Dominance Hits Key Resistance!The BTC Dominance chart is once again testing a key long-term weekly resistance.
Historically, this trendline has marked major turning points, and each rejection has given altcoins room to rally.
If we see another rejection here, it could mark the beginning of a strong altseason.
Like and retweet if you are with me! 🤝
#ALTSEASON INCOMING! 🔥
BITCOIN DOMINANCE DECODED! Hey crypto crew!
BTC.D is hitting new cycle highs—up it goes, pump or dump, it doesn’t care!
It trends up more than down and won’t dip until monetary policy shifts (QT tightening needs to end—maybe 100+ basis points in rate cuts?).
Altcoins? Just wobbly sidekicks—stick with BTC, the "King," unless you want your portfolio to crash!
Quick Take: BTC.D could blast past 66% and overshoot, then maybe consolidate. Watch war conflict vibes and wait for a policy flip.
Altcoin lows might hit Aug/Sep—hold off unless you’re feeling lucky!
Stack sats, stay sharp, and ride this wave!
Disclaimer: Not financial advice.
Consult a pro!
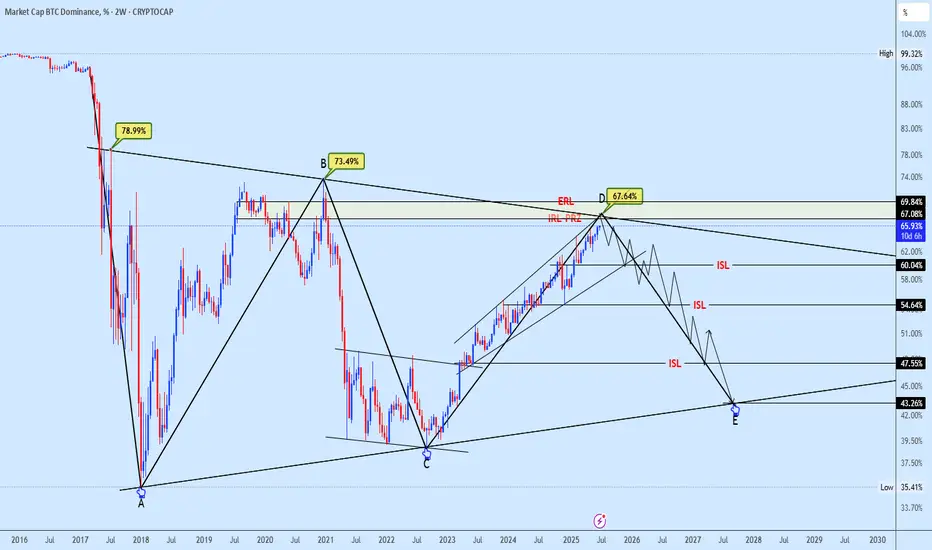
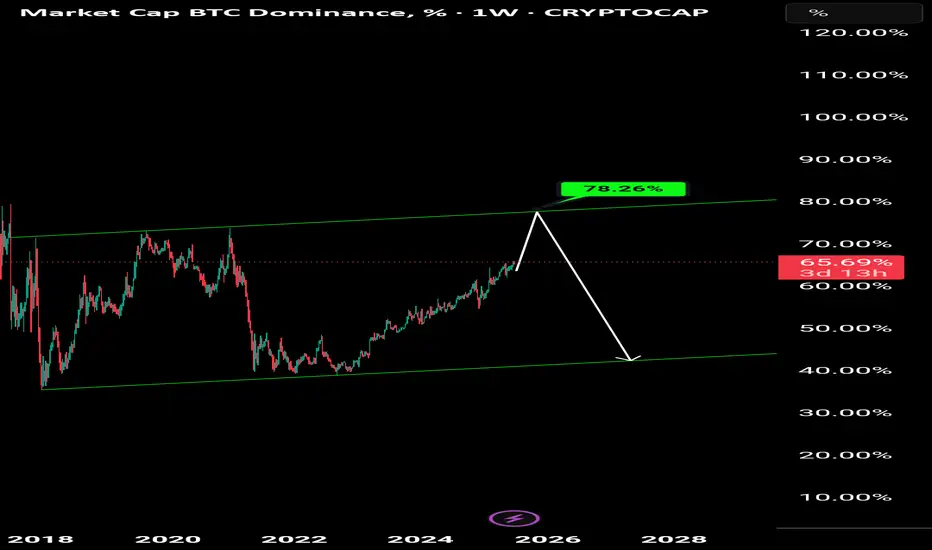
BTC.D Nearing a Historic Inflection PointBTC Dominance (BTC.D) is fast approaching the 67.64% resistance level, sitting firmly within a key supply zone marked at point D. This area represents a high confluence region, aligning with a long-term descending trendline and the upper boundary of a bearish wedge structure.
If validated, this would complete a potential ABCDE reversal formation suggesting a macro top in Bitcoin dominance may already be forming.
A rejection from this zone could trigger a pullback towards the immediate support at the 60% level. Should this level break, further downside may unfold toward 54.64%, with a deeper long-term target resting around the 45% zone.
This setup could mark a significant turning point if dominance begins to unwind, we may witness an aggressive rotation into altcoins. Keep a close eye on structural breaks and liquidity sweeps.
Alt season might just be closer than we think.
What’s your take on this potential shift? Let’s discuss in the comments.
Bitcoin Dominance (#BTC.D) UpdateBTC.D building strength and is now sitting just below a key resistance level. The chart shows a series of higher highs and higher lows. Tha's a bullish sign. If it breaks above this range, we could see a strong push toward 67%.
This move would likely mean a massive ALTS sell off. Good to be safe if you're in a LONG! 😈

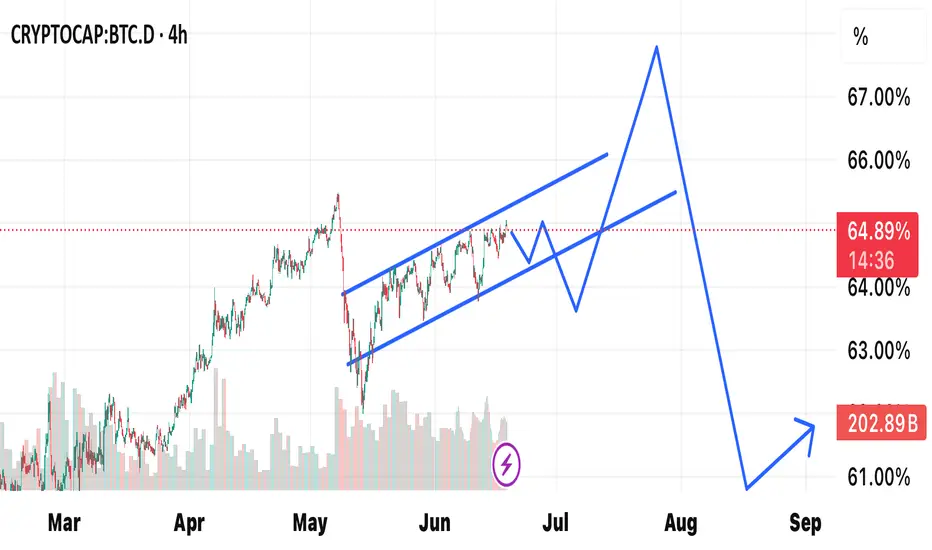
#Altcoins will pump in Q3I think this is a valid possibility for Q3.
Moving forward I think we might see Bitcoin Dominance fall in Q3.
What are your thoughts?
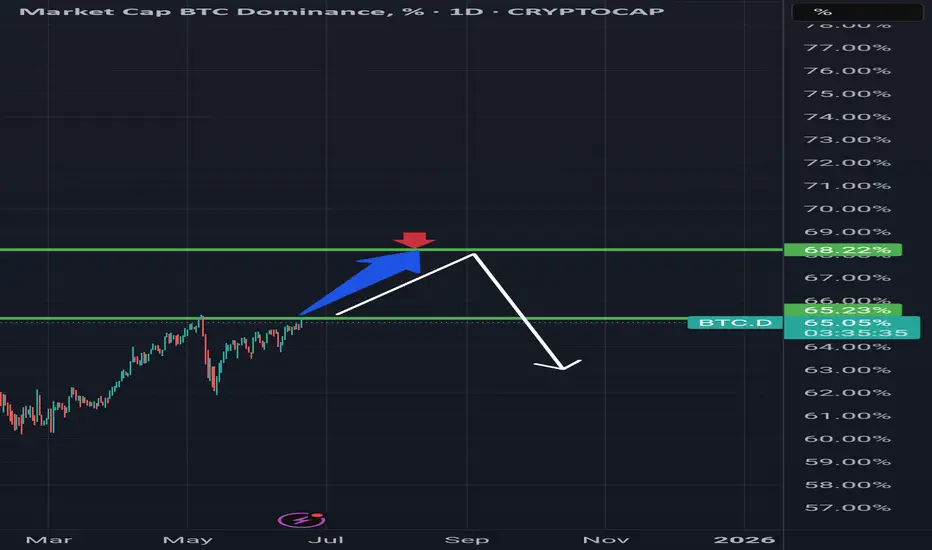
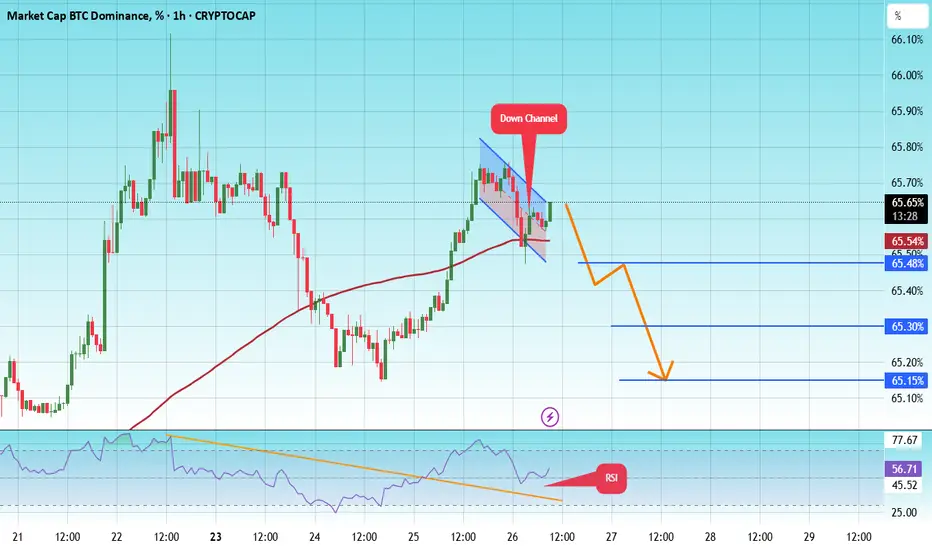
BTC Dominance New Update BTC.D
We are at a critical juncture in Bitcoin's dominance.
A major decline in Bitcoin's dominance has likely already begun. If the green zone is lost, dominance could see a sharp decline, especially since the last wave of this diagonal pattern, Wave G, touched the 0.618 Fibonacci level.
However, there is still a possibility that the green zone could push the price back close to the previous high before we see a decline in dominance. However, there are also indicators that the major decline may have already begun. Follow the chart closely and monitor it closely.
First Target: 65.50%
Second Target: 65.30%
Third Target: 65.15%
To manage risk, don't forget about stop loss and capital management.
BTCUSDT.DBTCUSDT.D
ALT SESON COMING SOON
This is my opinion: Bitcoin dominance has reached its top and might show a breakout to the upside, but it could turn out to be a fake breakout. Overall, we should expect a decline in BTC dominance and the beginning of capital inflow into altcoins. Perhaps if there hadn’t been negative news, this shift would have happened sooner. Altseason might be approaching.”

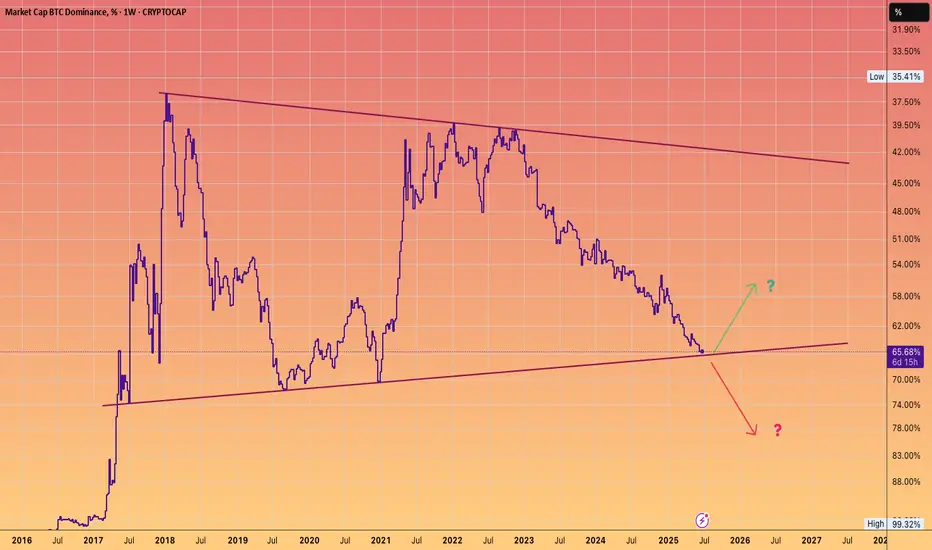
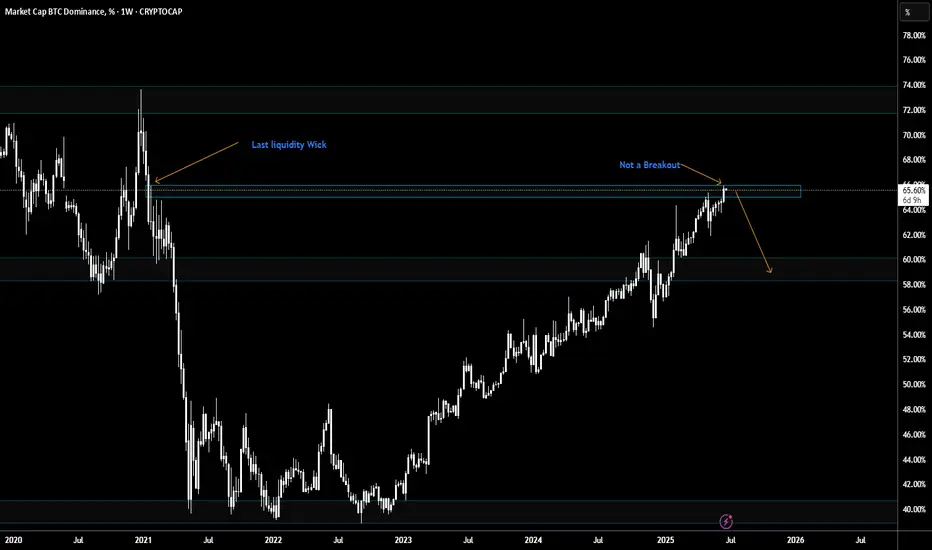
Altseason still possible | Bitcoin D. On ResistanceBitcoin Dominance is sitting on a resistance zone, reached the last liquidity wick. I still expect the altcoins to go up from here, since there is no valid breakout above this level.
BTC Dominance Nearing Major Reversal Zone?Dominance has been grinding higher for months, but it's now walking into heavy resistance, and the structure looks like a rising wedge (not a great sign for bulls).
This setup often ends with a breakdown, which could be the spark altcoins are waiting for.
It’s not confirmed yet, but the chart’s starting to hint at a shift.
Watch closely, big moves usually follow tight squeezes.
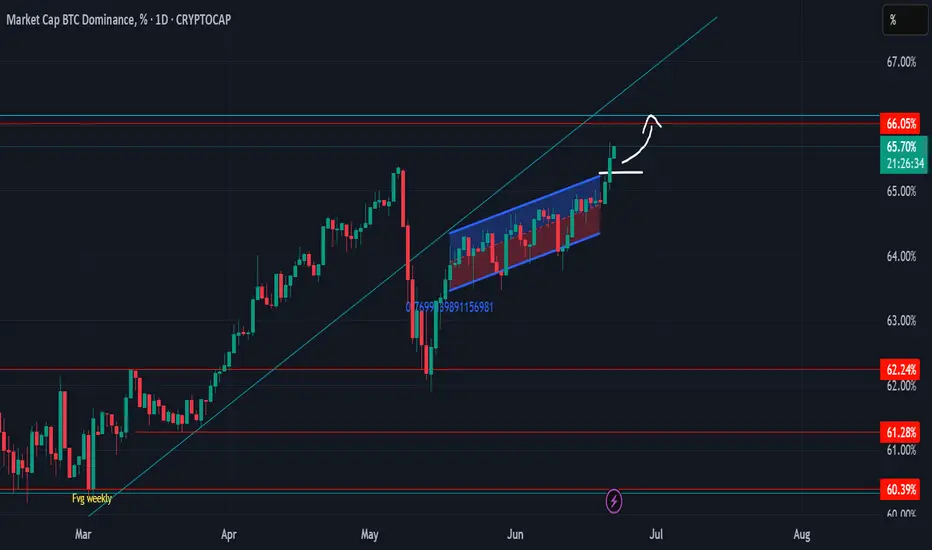
Bitcoin Dominan Breakout Regression ChannelDominance breakout in 65.25 and first target will be going to 65.90 - 66.20
And max pain for this scenario dominance will up till 66.77
max pain will be success i think if Iran and Israel war scale up with US
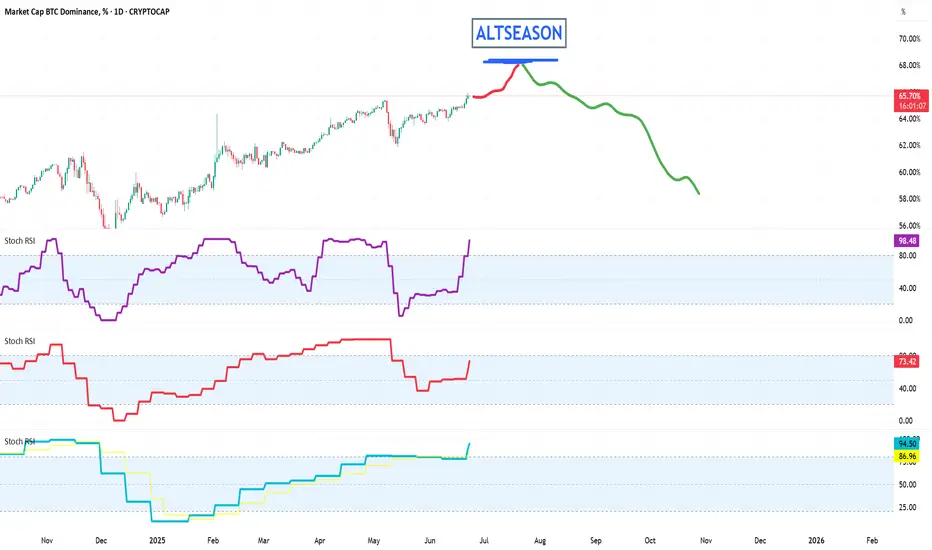
Bitcoin Dominance Nearing a Top — Altseason Incoming in JULYBitcoin Dominance (BTC.D) is approaching overbought levels on several key oscillators across multiple timeframes. While the 1-Week chart still shows momentum that could push BTC.D slightly higher over the next few weeks, the indicators are signaling an upcoming shift.
📅 Timing the Rotation:
We're eyeing mid to late July as the likely window for a rotation into altcoins. This would mark the beginning of a potential mini altseason, where top-performing altcoins could outpace Bitcoin for a limited but lucrative period.
💼 Strategy Insight:
This could present a strong opportunity to trim or exit older alt positions from earlier in 2024—especially if they rally hard during this period of temporary dominance weakness.
🔍 Watch the oscillators and volume trends closely. The BTC.D reversal could be subtle at first but may lead to outsized moves in select alts.
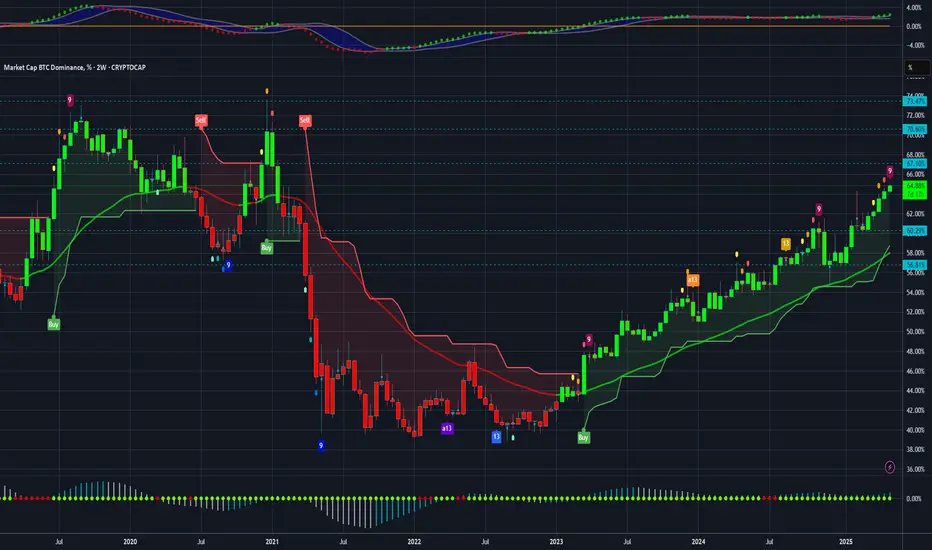
Bitcoin Dominance Topping Outhi ,as a brief update Bitcoin Dominance continues to climb and alts go down as a result.
there are many indicator that are signaling a new top for BTC D (like TD9 and more)
this last candle has another week to close, so Alts are not out of the woods yet !
Bitcoin Dominance (BTC:D) Update - 19.06.2025🚨 Bitcoin Dominance (BTC.D) Update – 19.06.2025 🚨
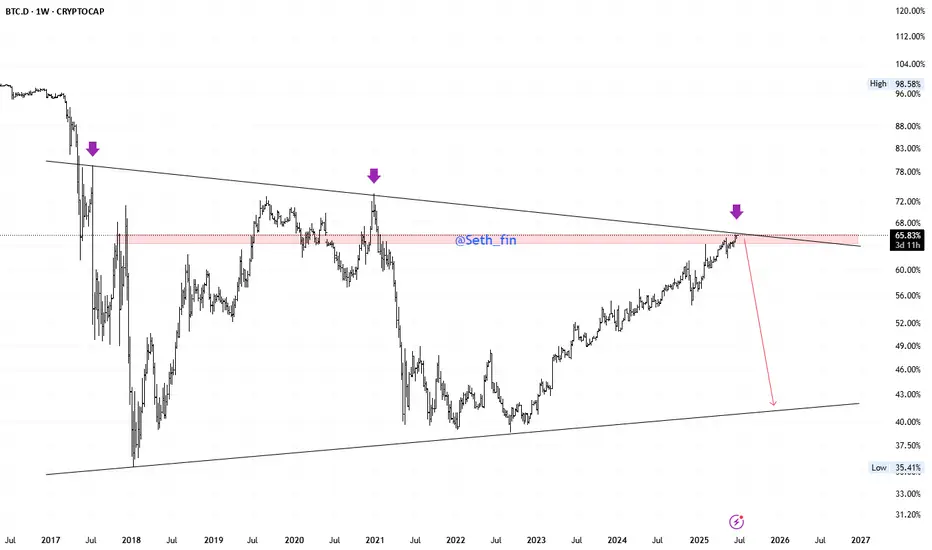
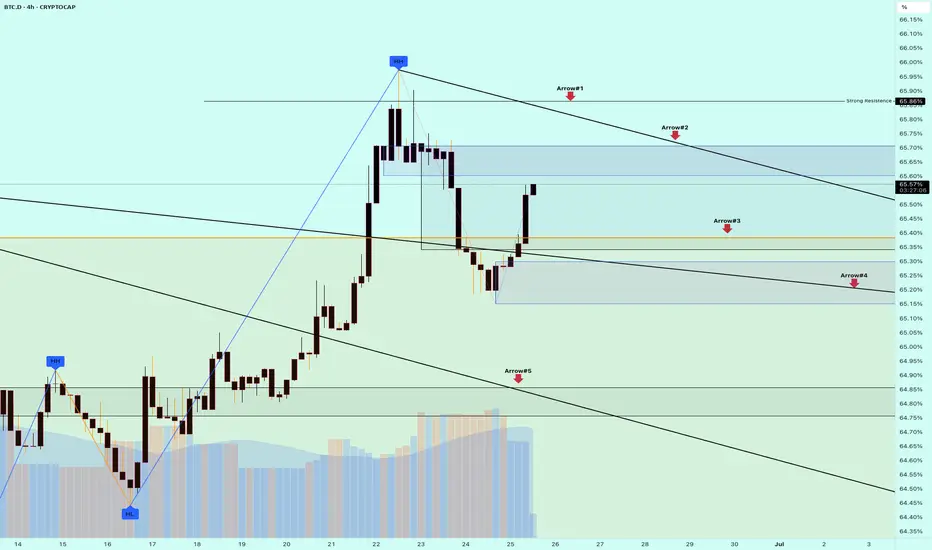
As highlighted in my previous analysis, BTC Dominance has broken its key retracement trendline – a significant move! 📉 But let’s be clear: the breakout hasn't been fully confirmed yet. Market momentum is still uncertain, and we must stay alert as BTC.D could go either way from here.
🔍 Let’s break it down:
📌 Arrow #1: This remains a strong resistance zone. If dominance breaks and closes above this level with strength, expect serious pressure on altcoins. Historically, such moves lead to red across the board for alts. Be cautious! 🩸
📌 Arrow #2 & #3: These are the local resistance and support zones from the past 12 days. They are key in identifying short-term moves and fakeouts.
📌 Arrow #4: A break below this level would give a strong signal to reopen positions on altcoins. We’re closely watching this area.
📌 Arrow #5 & #6: These are the most important support levels. If BTC.D breaks down here, it could mark the beginning of Altseason – the moment we’ve been waiting for! 🚀
💡 Summary:
We’re in a critical phase. Break above resistance = pain for alts. Break below support = altcoin opportunities will explode. Stay disciplined, stay focused. 📊
🔥 Ethereum update coming next… stay tuned, fam!
\#CryptoUpdate #BTC.D #Altseason #BitcoinDominance #Altcoins #TechnicalAnalysis #EthereumIncoming

Bitcoin DominanceI'm posting this again just to antagonize the haters, because there are those people who understand zero technical theory. It's the blind leading the blind out there. I fattened up the candles, hoping it will be easier for you to see the gap that I'm talking about.
Some technicians might argue, "yah, but that only works on the price, not on ratios". But that argument doesn't work on a seasoned technician like me, who traded crypto currency pairs on Pololniex for three years straight. You are speaking from complete ignorance, and I know what I'm talking about.
Thank you for your attention to this matter ;-)
Weird cycle for alts Weekly update for this check lately has been painful
Outside of XRP and a few others it’s been a difficult ride this alt season.. weird to say the least . We were doing better in 24 than the Trump rally last November/Dec
Been pretty much downhill ever since.
While BTC still over 100k I fell we still have a chance but this alt season window is closing fast.
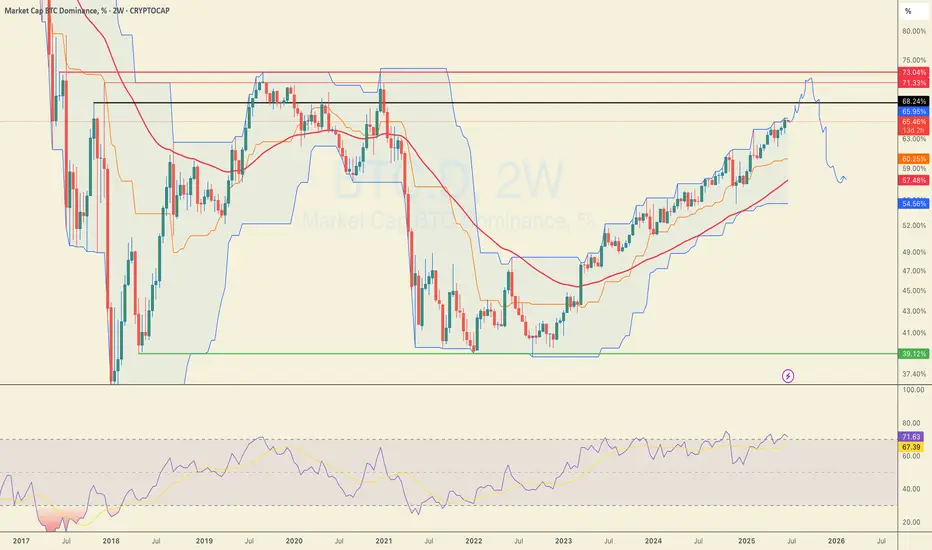
BTC.D - Could it be Wyckoff Distribution DevelopingJust toying with ideas of what may be developing here so dont take the chart as what i think will happen perfectly as shown.
With the strength seen from BTC.D atm, it looks more and more likely it may go for the highs again and into the higher levels above 65%.
I still see this as a very large range from the february high and lows that got put in and the prior high was a deviation of the larger range resulting in the reaction we seen.
We could expect to see a further deviation of the range highs and this wouldn't be uncommon in the development of a wyckoff distribution range.
Im still looking for a HTF reversal bearish from these supply levels and my bias doesnt change right now as we continue to develop this range until proven otherwise.
That being said, we could see some further weakness in altcoins until this tops out and gives us the right confirmations of a trend shift bearish.
1D:

BTC Dominence Update🚨 BTC Dominance Update 🚨
Once again, BTC Dominance (BTC.D) is showing strong bullish momentum! 📈
After a shallow retracement, it has regained strength and is continuing its upward climb. This confirms that Bitcoin remains the top performer in the current market phase.
🔺 Arrow #1 & #2 – Key resistance levels to watch.
🟢 Arrow #3 & #4 – Strong support zones that held well.
🔻 Arrow #5 – The deep retracement point. A breakout from this zone was the first bullish signal for #ALTs
💡 This is exactly why I’ve been avoiding buy trades in altcoins in our group. The dominance chart is crystal clear:
⚠️ This is not the time to rotate into alts.
🔥 Focus on Bitcoin! It's leading the market, and that’s where the momentum is.
📊 Stay disciplined. Stay focused.
🎯 Trade smart — this phase is all about BTC!
\#BTC #BitcoinDominance #CryptoUpdate #AltsOnHold #FocusOnLeaders #TradeSmart
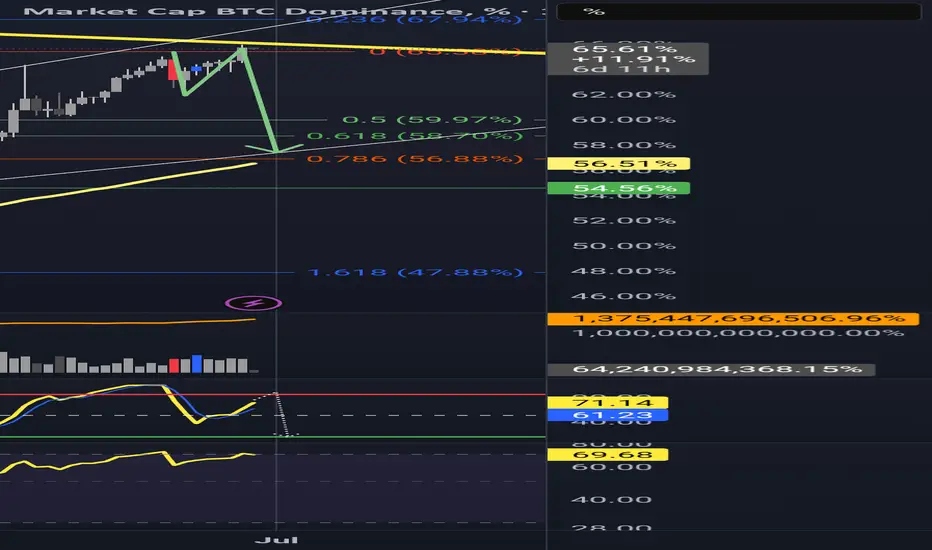
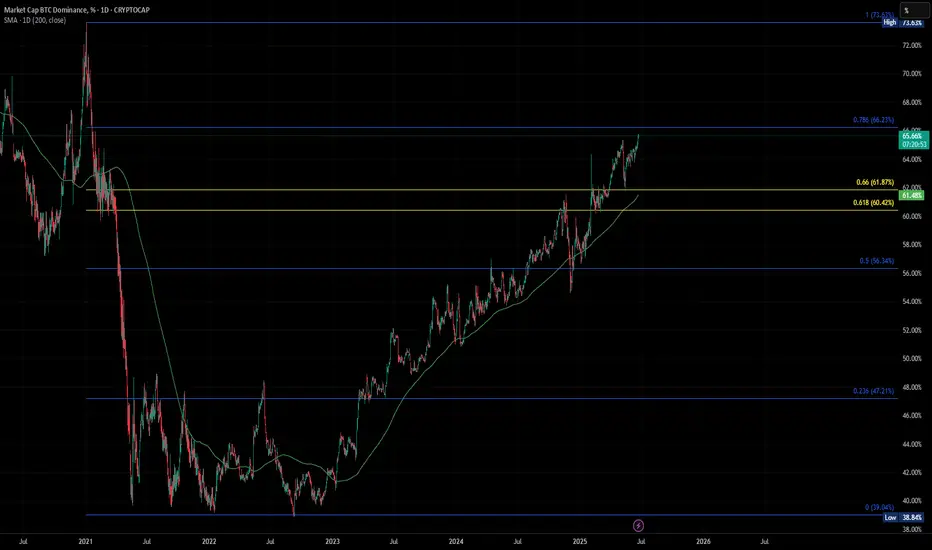
Is Altseason Around the Corner? BTC.D looks tired AF!BTC dominance just hit the top of a rising wedge that has been building for over a year. Price is stalling at 65.64 percent, sitting right against long-standing resistance.
Momentum is weakening. Stochastic RSI is at 72 and starting to roll over. RSI is sitting just under 70 and showing early signs of fading.
The structure suggests we are close to a decision. If BTC dominance starts to fall from here, the conditions for an altcoin run are in place.
Key levels to the downside are already mapped. First is 59.97 percent. Then 58.70 percent. After that, 56.88 percent. The 100-week simple moving average is also sitting at 56.51 percent. If dominance breaks below that level, it opens the door for a larger shift in market flow.
Previous retracements in BTC dominance have aligned with strong moves in altcoins. This current setup is technically clean and nearing resolution.
It is not confirmed yet, but the signals are starting to stack. This is a moment worth watching.