BTC Dominance: What a Rise Could Mean for the MarketTechnical view:
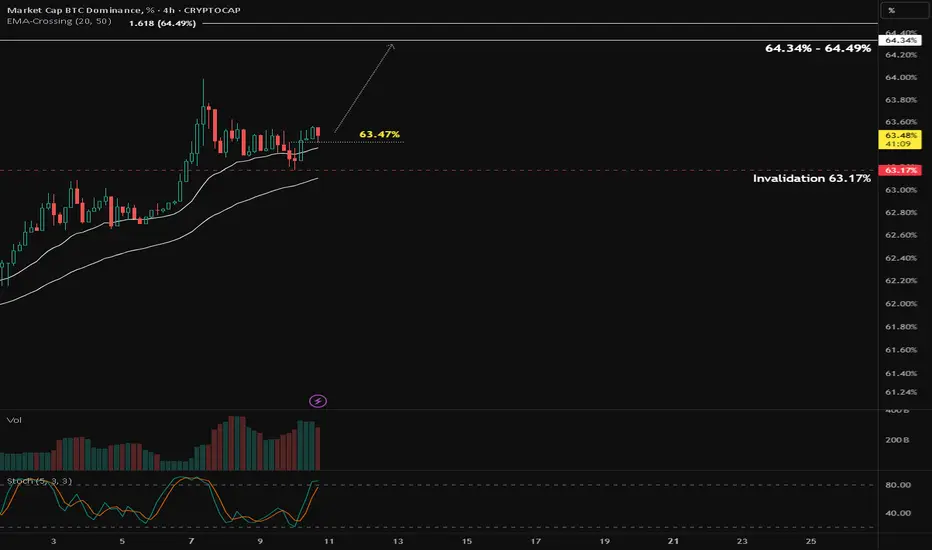
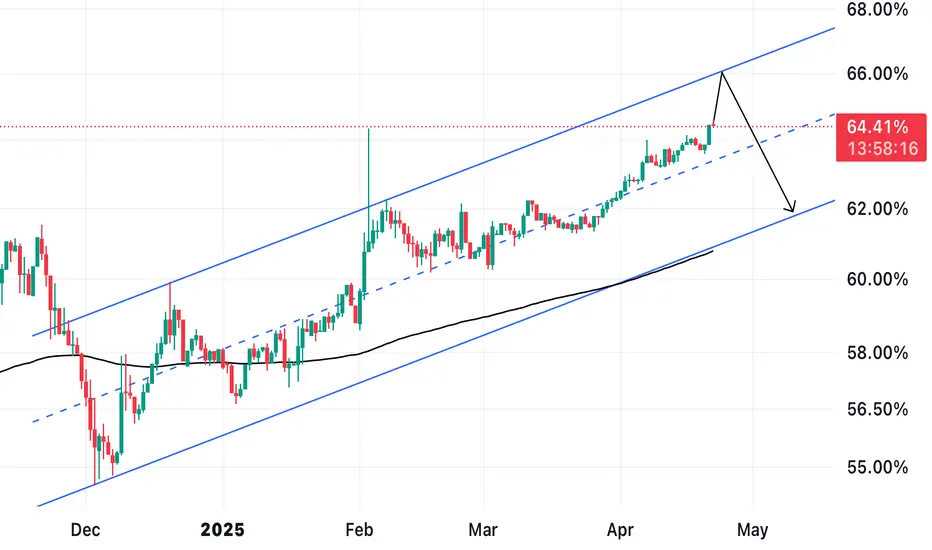
Rejecten from EMA 20 & 50 as support and the upward move has been confirmed by a breakout above the 63.47% level.
The next target for BTC.D is around 64.34% – 64.49%.
This scenario remains valid as long as price holds above the 63.17% level.
Understanding BTC Dominance (BTC.D) and Its Market Impact
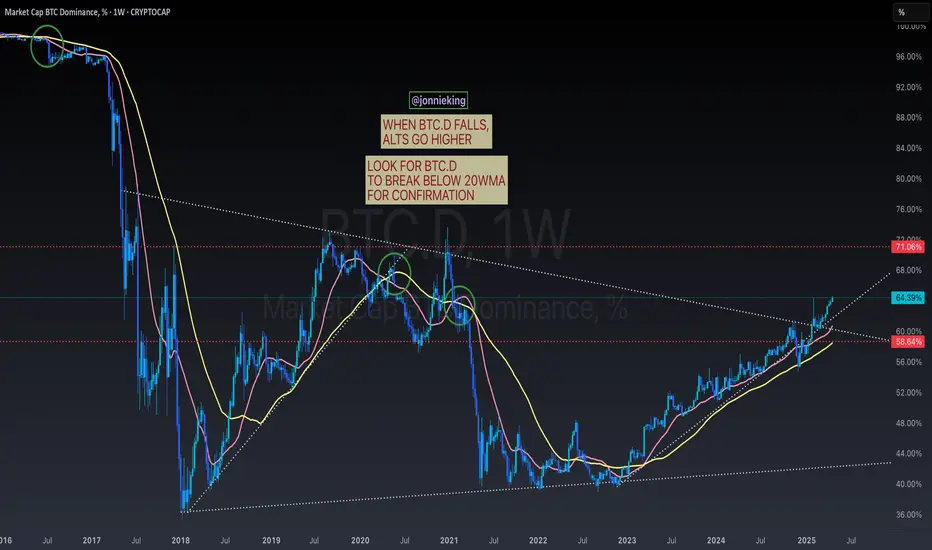
Bitcoin Dominance (BTC.D) measures the percentage of total crypto market cap that belongs to Bitcoin. When BTC.D goes up, it usually signals that money is flowing into Bitcoin and out of altcoins. This often happens during risk-off sentiment, uncertainty, or when BTC is making a strong move.
➡️ A rising BTC.D can mean:
Altcoins may underperform or correct
Bitcoin is leading the market trend
It's safer to focus on BTC-related trades
On the other hand, when BTC.D goes down, altcoins often shine—especially mid and low-cap ones—marking what traders call an altseason.
⚠️ So if BTC.D breaks resistance and trends upward, it might be a good idea to reduce exposure to altcoins and monitor BTC closely for momentum trades.
BTC.D trade ideas
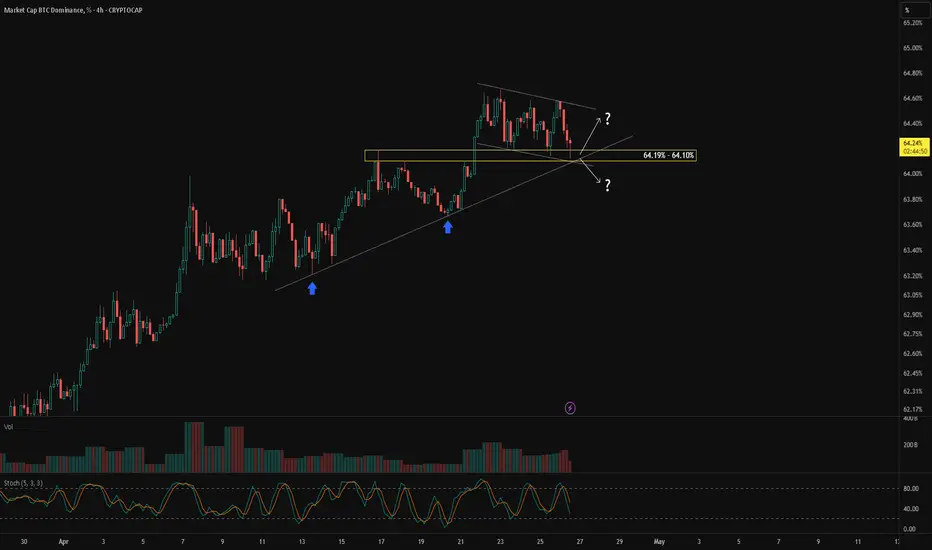
Crucial Level to Watch on BTC.DWe can see that CRYPTOCAP:BTC.D is still in a bullish trend and is currently testing a crucial level, which will determine whether it continues to make a higher high or starts weakening towards its previous low.
The influence of CRYPTOCAP:BTC.D on the crypto market is simple: if CRYPTOCAP:BTC.D moves higher, it means more money is flowing into Bitcoin. For example, if CRYPTOCAP:BTC.D is at 64%, it means 64% of the total crypto market capitalization is in Bitcoin, and the remaining 36% is spread across altcoins like CRYPTOCAP:ETH , CRYPTOCAP:SOL , CRYPTOCAP:DOGE , CRYPTOCAP:PEPE , etc.
Conversely, if CRYPTOCAP:BTC.D moves lower, it means more money is shifting into altcoins.
Strategy when CRYPTOCAP:BTC.D is rising:
You can allocate more into Bitcoin rather than altcoins. Alternatively, you can find altcoins that are outperforming Bitcoin.
How to find altcoins that outperform Bitcoin?
Look for altcoin/BTC pairs, for example: BINANCE:WIFBTC , BINANCE:NEARBTC , or $BINANCE:TAOBTC.
If the price of BINANCE:WIFBTC is going up, it means SEED_WANDERIN_JIMZIP900:WIF is gaining more value compared to $BTC. If it's going down, it means Bitcoin is performing better than $WIF.
Back to CRYPTOCAP:BTC.D :
Currently, CRYPTOCAP:BTC.D is testing the 64.19% – 64.10% zone.
This area will determine whether CRYPTOCAP:BTC.D continues upward or starts to weaken.
To get early confirmation, you can zoom into the 1-hour chart and look for signs of bullish divergence.
If bullish divergence appears on the 1-hour chart, it often leads to a bounce on the 4-hour chart and a potential continuation of the bullish trend, possibly breaking the previous high.
However, if there's no bullish divergence confirmation, or if there's a strong rejection at the support level, CRYPTOCAP:BTC.D is likely to weaken and move towards its previous low.
A wonderful ALTCOIN Bullrunis all set in motion.
If my chart resonates with you in any way.
The combined dominance charts of the big four.
#BTC.d
#ETH.d
#USDC.d
#USDT.d
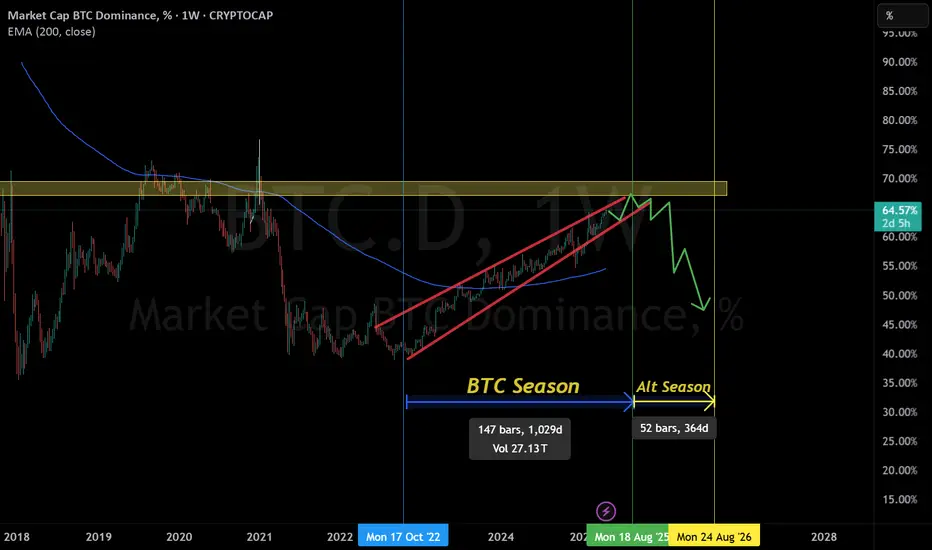
We are on our way to my anticipated target zone.

BTC Dominance % : Key zone watch
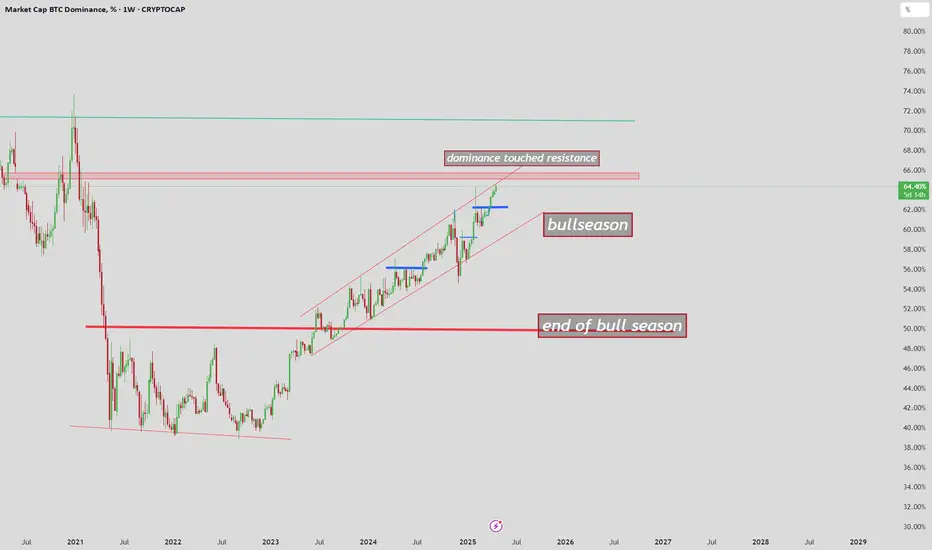
BTC.D is still respecting its upward channel since mid-2022, currently testing the upper boundary ~64%.
🟡 Potential pullback on the table, targeting mid-range or lower channel support (~60%).
📌 This could hint at:
🔄 A short-term ALTcoin relief rally if dominance pulls back.
🛑 Or possible Bitcoin consolidation while alts catch up.
EMA 61.40% acting as dynamic mid-range support.
Stay sharp — dominance shifts often lead the broader crypto rotation.

WELCOME TO THE BEGINNING OF ALT COIN SEASON!Traders, Hodlr's and Soon to be Liquidity (late retail buyers),
This is likely the moment we have been waiting for. Last week in our weekly VIP market update we discussed just a few things that would really show us if we just saw the bottom of the alts and if it was now time to start seeing some new local HH's and then HL's showing us a shift in trend. I had posted a few trades pointing this out. We have now at this point accomplished what we were looking for to see if we would be starting Alt coins season.
We have been watching a few things. The first being Bitcoin Dominance or CRYPTOCAP:BTC.D as this is a great chart to watch and look for reversals prior to looking at the chart of the specific alt coin against BTC to see if it also is showing it could have a rally or a pullback based on your bias on this BTC.D chart. For instance if I were to want to see maybe when XRP would likely start breaking out say that this BTC.D chart is in fact correct and the triangle trend line will end up being the top for btc dominance at around 64.4% of the total market I would go to BITSTAMP:XRPBTC to give myself some insight on confluence of market movements.
Being that we are now here at the point that I believe we will start to see money flow into alts based on this chart and others such as CRYPTOCAP:TOTAL2 , CRYPTOCAP:TOTAL3 and CRYPTOCAP:TOTALDEFI and the specific BTC pairings that I am holding by looking up the ticker of my alt coin/BTC and studying that chart I will honestly say that I am in the 90%/10% bullish on alts to bearish.
I hope this information helped you in your journey to get more information and come up with your own analysis to base your investment decisions and you become prosperous for doing soo!
Stay Profitable Folks,
Savvy!

BTCD
As we have continue to be bullish after every point. I think its going turn around lol.. been stuck here a few days lets see which direction it picks.

BTC dominanceI know its hard to wait... but it will be worth! Altcoin season should be here very very soon.
Also ETH dominance hit all times low :D
BTC.D: Time to go down!Will BTC.D finally grab the liquidity at 64.83% this weekend and top out? Altseason seems to be closer than ever this cycle.

BTC.D Needs to Hit 71% For Alt Season To HappenI hate to be the bearer of bad news, but the face-melting Alt Season we are all patiently awaiting is not arriving until BTC.D reaches 71%
Having said that, there WILL be an outlier of Alts that outperform CRYPTOCAP:BTC , such as CRYPTOCAP:SOL 💯
Dominance the system core- for me it has always been very complicate to explain BTC.D to peoples, because it's complicate ! lol
- it's weird to understand the moves and many factors have to be compared together an alchemy have to happen to see something happening.
- So basically to explain it, i will tell you what "we want to see" or "what we don't want to see" in the future. if the story repeats again.
1/ BTC.D have to grow up, then Altcoins will struggle down trying to find a potential bottom.
- While BTC.D grow up, BTC price have to grow up also or at least stabilize ( this is a good sign )
2 / if BTC price down and BTC.D up, it's bad, it's just the normal way ( No Divergence )
- When BTC price + BTC.D both up together, it's a kind of " inversed divergence ", it means something good gonna happens. ( get it ?)
- Basically also if USDT/USDC Dom Grow and BTC price stabilize and not goes down anymore, it's a good sign.
- Normality the normal way is : BTC up / USDT/USDC.D Down OR BTC Down / USDT/USDC.D up.
- Before we had no reason to check those Stables coins because they had not much DOM in markets, but now have to count with them.
- So While BTC.D is growing, altcoins will just make some weak moves.
- When BTC will reach is next Dominance's ATH ( witch have to be lower than last years because more concurrence )
- BTC.D will crash and ALT SEASON will start.
- it took me many years to understand that, but it's pure logic ( Fibonacci is working perfectly on it )
- again it's not easy to get it.
- if you have any questions feel free to add a comment.
Happy Tr4Ding !
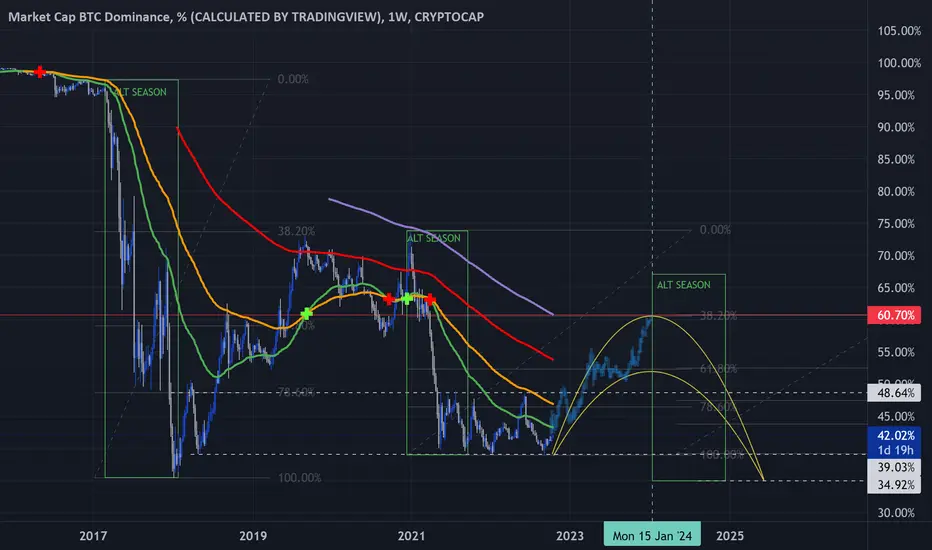
bitcoin dominance & etheriumSure! Here's the English translation of what you just wrote:
In the past, when Bitcoin dominance reached around 70%, Ethereum tended to rise.
And here's the expanded version of the explanation I just shared, also translated into English:
📈 Summary of Past Patterns: When BTC Dominance Approaches 70%, ETH Tends to Rise
💡 Typical Flow
BTC Dominance Rises
→ The market moves primarily with Bitcoin, while altcoins (including ETH) are relatively ignored.
→ ETH price either moves sideways or declines.
BTC Dominance Reaches Around 70% (a historical high)
→ Bitcoin's dominance trend reaches a potential peak.
BTC Dominance Starts to Decline
→ Investors start to take profits from BTC.
→ Funds rotate into altcoins, especially large-cap ones like Ethereum.
→ Ethereum begins to rally.
btc.d chartbtc dominance chart easy breif where i want to tell you that dominance breaking this trand may result shift of money from btc to altscoins.
The D to 66%This ascending channel is still valid. If dominance reaches 66% and then drops drastically, it will make room for alts to recover from the bloodbath.
Where is the liquidity ?BITSTAMP:BTCUSD COINBASE:BTCUSD BINANCE:BTCUSD CRYPTOCAP:BTC COINBASE:BTCEUR
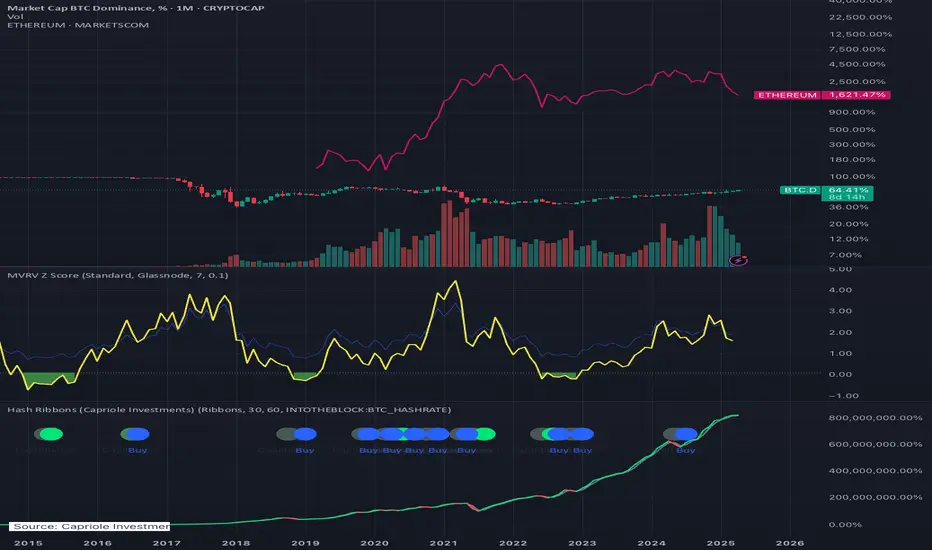
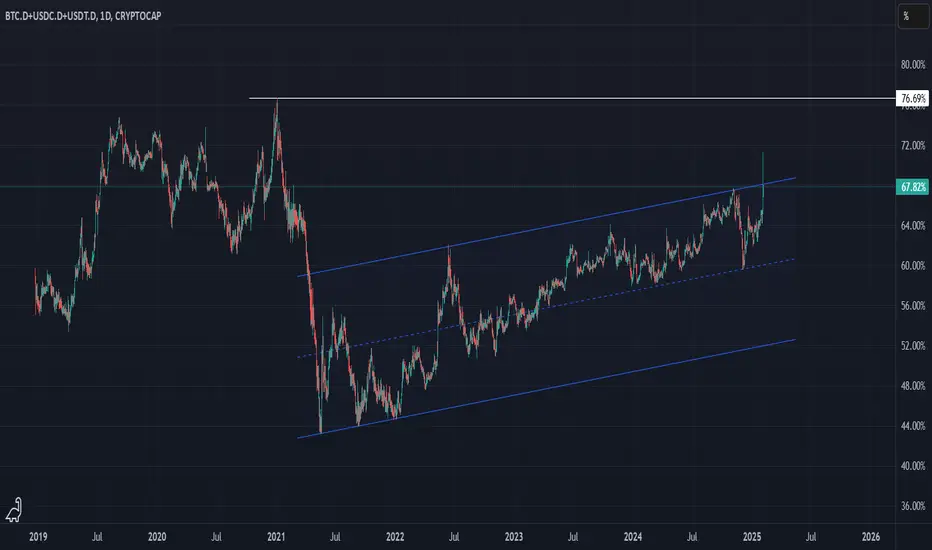
Here I present you the chart that shows the dominance of CRYPTOCAP:BTC.D and the major stablecoins CRYPTOCAP:USDT.D and CRYPTOCAP:USDC.D is in the crypto market. These assets now hold 68% of the total market cap. This means :
" For every $1 coming into crypto, about $0.60 goes into BTC and stablecoins, but only $0.40 goes into thousands of other cryptos."
Will this dominance decrease?
At some point, yes. The fall of BTC and stablecoin domination together with new money coming into the market is often the precursor for an Altseason. If fresh money do not flow into the market, altseason may be underwhelming as funds would merely rotate between BTC and stablecoins in addition to other assets, rather than growing the market.
But why does BTC tend to hold relatively well during market corrections while altcoins face harsh drops?
This is a function of market structure and liquidity distribution, something you can read about in my article "Portfolio Stability" , a must read to better your understanding of crypto market dynamics.
BTC dominanceHello to all AMKT friends, I hope you have a good day. After Bitcoin's rise, it wouldn't be bad to take a look at Bitcoin dominance. Stay tuned😍
Bitcoin dominance is in an upward trend across all monthly, weekly, daily, and 4-hour timeframes, showing us that money is entering the market, and Bitcoin in particular.
Our prediction is that Bitcoin dominance will rise along with Bitcoin price and grow up to about 70% and after that whenever Bitcoin dominance range or falls and Bitcoin price range or increase, altcoins will start to make sharp upward movements. So if you are waiting to buy altcoins, wait for Bitcoin dominance to fall or range and Bitcoin price to range or increase.
Have a good and profitable day

Let's Watch Bitcoin Dominance Together!Hello, Skyrexians!
You may think that we make analysis on CRYPTOCAP:BTC.D too often, but it's needed because as we pointed out many times we are closed to the global top and it's important to predict when altcoin season starts.
Today we have 12h time frame to look in details at final wave 5 inside global 5. Wave 3 inside this wave is about to be finished at 64.85%. This is not new information. You can check our previous 12h analysis and see it. Today price has reached the target and soon we have to see the reaction and small correction to 0.38 Fibonacci at 63%. During this drop altcoins may show great performance, but after that last shakeout will happen. After that we expect 3-5 months of dominance decrease.
Best regards,
Skyrexio Team
___________________________________________________________
Please, boost this article and subscribe our page if you like analysis!

BTC.D: 1M chart still looking bullish for nowAs above.
BTC.D still looking to continue to slowly inch higher in the near future. No ALT season yet, unfortunately for those anticipating this event.
Stronger case for BTC.D to get to 70% range once 65% range is entered. I am not sure this is going to be a rapid BTC.D event given the historic trend and current economic climate. Might see ALTs bleed again a little more than BTC to achieve this 70% level rather than BTC going parabolic. Would have cash on hand for potential start of ALT season to get those basement discount prices on ALTs if that should happen as I anticipate some kind of ALT season down the road..the question is when and how big...
Will follow.
Good luck traders!
Bitcoin Dominance Is About To Finish The Growth CycleHello, Skyrexians!
Time to update our main chart CRYPTOCAP:BTC.D and today we will take a look at 4h time frame to make sure that everything is going according our global scenario.
Today we consider wave 3 in 5 into the global 5. It has been almost done with the potential double divergence and ending diagonal at the top. The next wave is higher degree wave 4. It has the target at 0.38 Fibonacci at 63%. From this point we expect final wave 5 to final target at 66%.
Best regards,
Skyrexio Team
___________________________________________________________
Please, boost this article and subscribe our page if you like analysis!

BTC D BTC DOMINANCE UPDATE
I think it will rebound from Fibonacci 4.23 in the coming weeks and will be positive for the currencies. Wait for the bullish rockets.
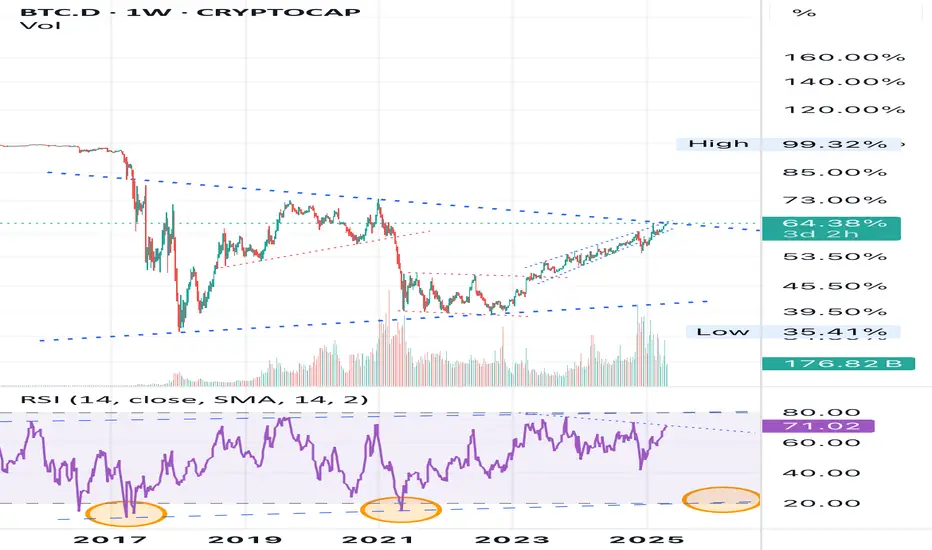
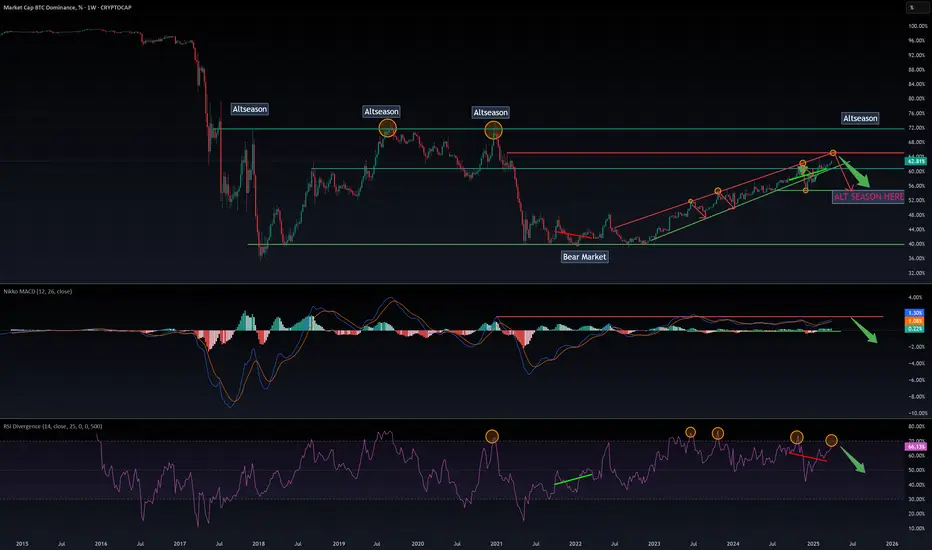
BTC Dominance – Are We Near the true Altseason?BTC Dominance – Are We Near the Altseason?
BTC dominance has been rising recently, and many believe the real altseason will begin once BTC.D reaches 71%, just like in the previous cycle.
However, it might happen sooner than expected.
On the 1W timeframe, several signs are flashing:
RSI is showing a bearish divergence that’s about to play out.
Since January 2023, the MACD has been in overbought territory.
Each time RSI peaked above 70%, we saw a rejection of 8–10%. It's currently at 68% and nearing that level again.
On December 2nd, 2024, the structure was broken, but it has since re-entered its rising channel.
🔗
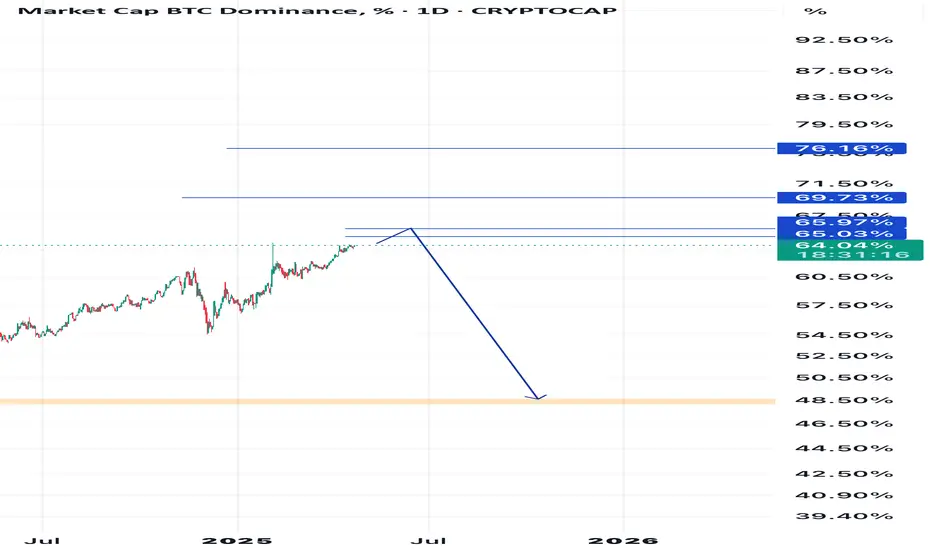
On the Daily chart:
BTC.D is approaching its cycle peak around 65%, which should act as a resistance and potential reversal point.
Since the structure was already broken once, another downside break is highly probable.
🔗
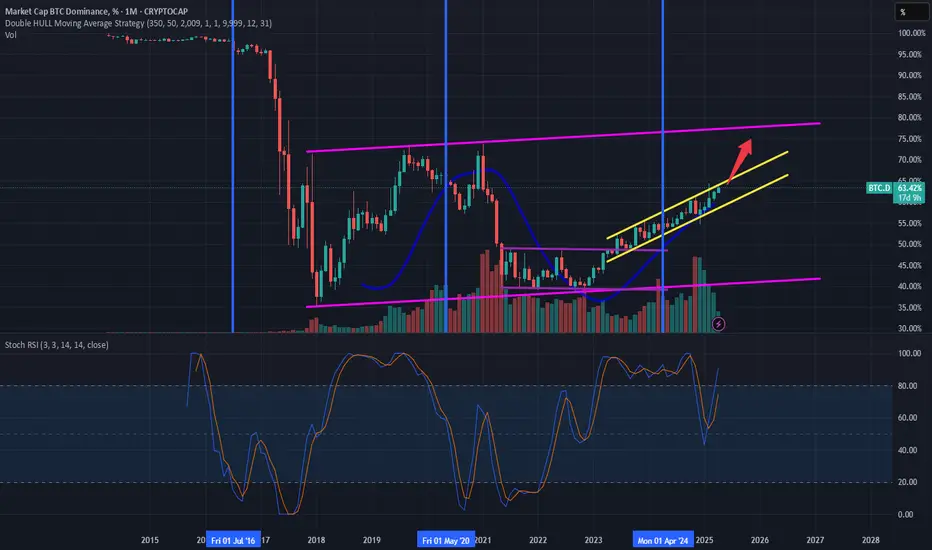
On the Monthly chart, it’s pretty clear we’re nearing the end of the BTC dominance cycle, and a rotation of capital is likely to follow soon.
Now, there are 2 possible scenarios:
Altseason starts at 65% in this cycle.
Altseason starts again at 71%, mirroring the previous cycle.
When you look at the Monthly chart, it’s easy to see that this cycle is different. With an overbought RSI, and a potential break of structure, a long-awaited MACD correction could be the trigger for the real altseason.
🚨 DYOR (Do Your Own Research) 🚨
BTCD Testing This week coming up we need a clear turn around and start having a down trend in dominance!

Bitcoin Dominance UpdateBitcoin Dominance is moving through upwards and as long as it stays above the %61 level, it will fill the wick that remaining from the first crash of February. It's not good for alts, neither for the market structer at the moment.
