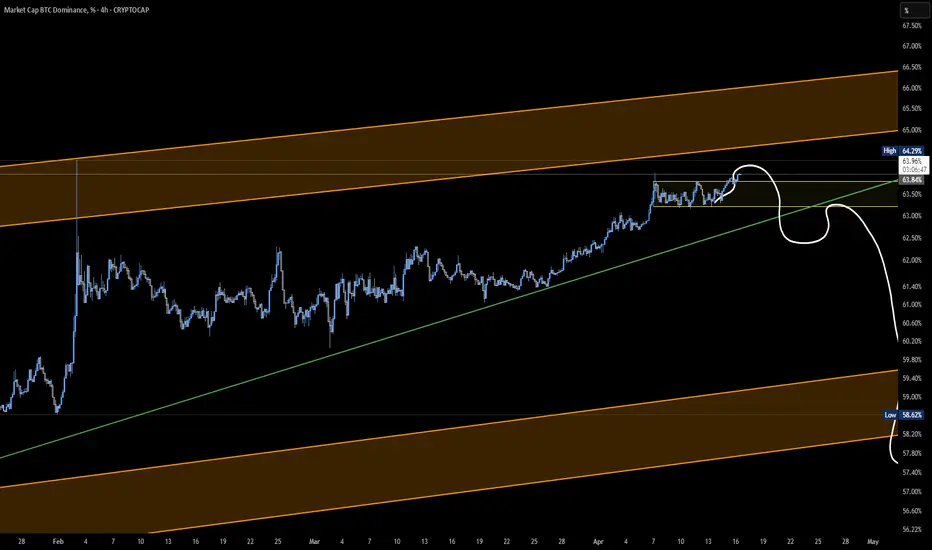
finally altcoins ready for strong bounce btc Dominance Finally Showing Signs Of Weakness, Formed Rising Wedge, Rejected From Rang,s Top, Counter Trendline Breakout Confirmed, Expecting Move Towards Ascending Trendline In Coming Days, And In Results Altcoins Finally Will Get Some Relief, However Once Ascending Trendline Got Cleared, Alts Can Bounce Sharply After That.
BTC.D trade ideas
BITCOIN DOMINANCE is bought up and lacks strengthTHE maximalists Ideal of a environment of "ONLY BTC" is obviously absurd.
BTC is finally giving up dominance. Pattern rimes with last cycle.
Bitcoin is not DEFI and will never be...
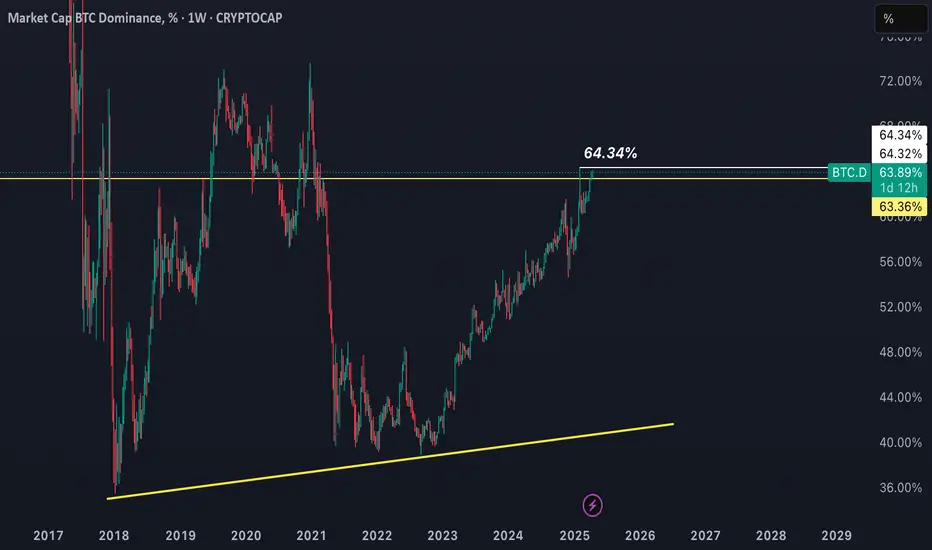
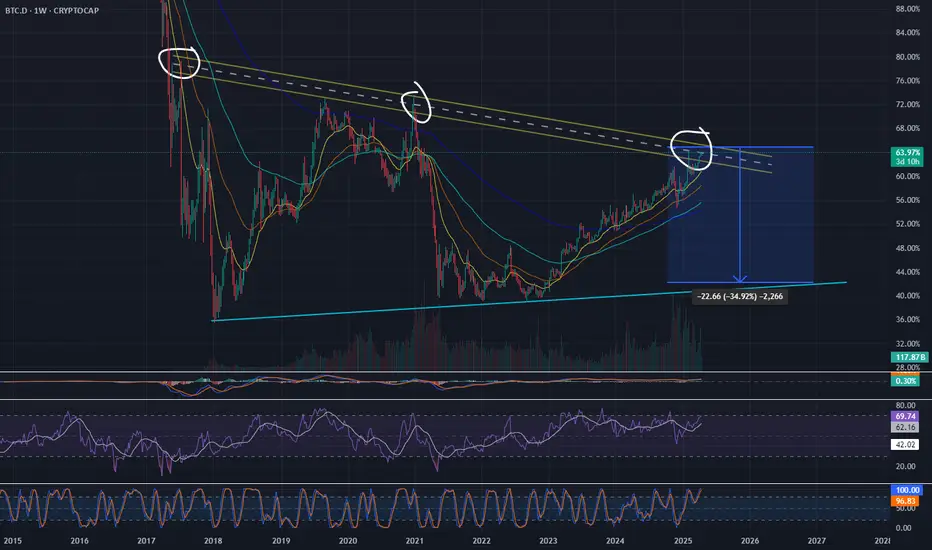
Bitcoin Dominance WeeklyIt’s again catching up with its previous high of 64.34%.
This can be the point of reversal, it can be a good news for #altscoin holders.
Breakout of 64.34% will be the doomed of altscoin.
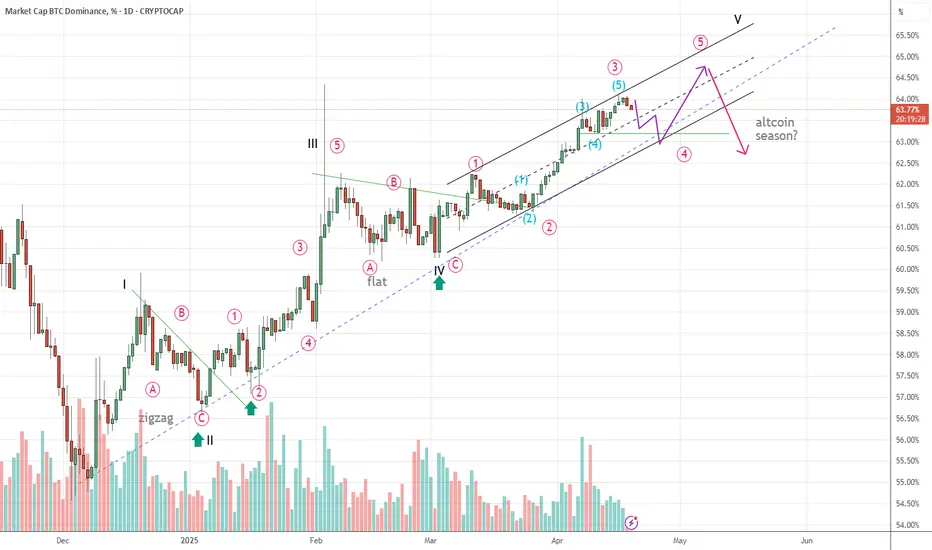
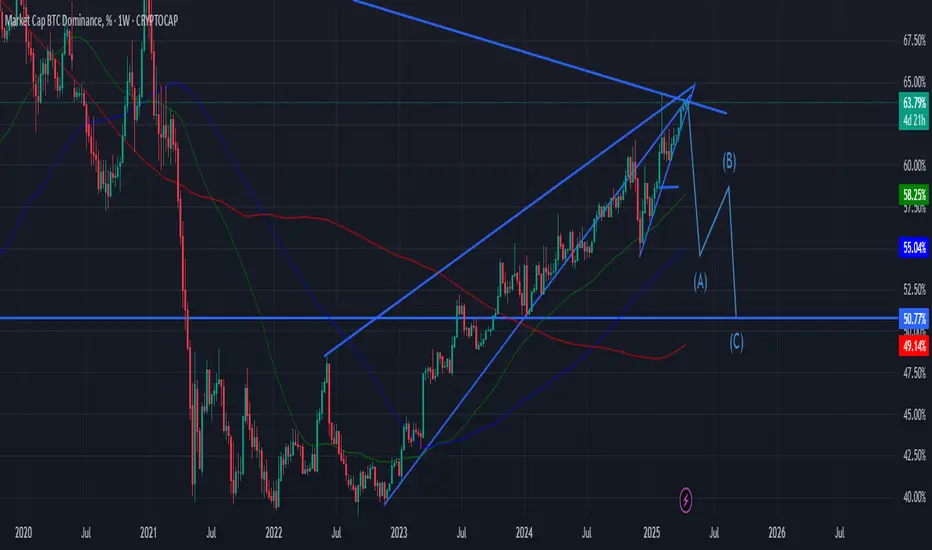
BTC.D Wave 5 is formingWe are now in the final wave of the btc.d market share
The black V wave is in the final stage
In my opinion, btc.d is in the red wave 4 and is expected to have another red uptrend to complete 5 waves and at the same time, it will also have 5 black V waves
If all the waves are complete, we will have a btc.d break and the altcoin season will take place
We can see that altcoin is at the bottom and is recovering, this uptrend is likely to increase (because btc.d is decreasing wave 4) then btc.d goes up to the red wave 5 as analyzed above, the altcoin will test the possible double bottom pattern (with some strong coins that can slightly recover to the 50% fibonacci and then go up)
to go up, the weaker ones can have triple bottoms
Anyway, we are at the end of btc.d and it is also the altcoin season that is about to begin
Altseason, but only for some coins.Don't miss the chance to buy altcoins when domination is above 70%, buy only strong assets with high capitalization. XRP, ADA, LTC,
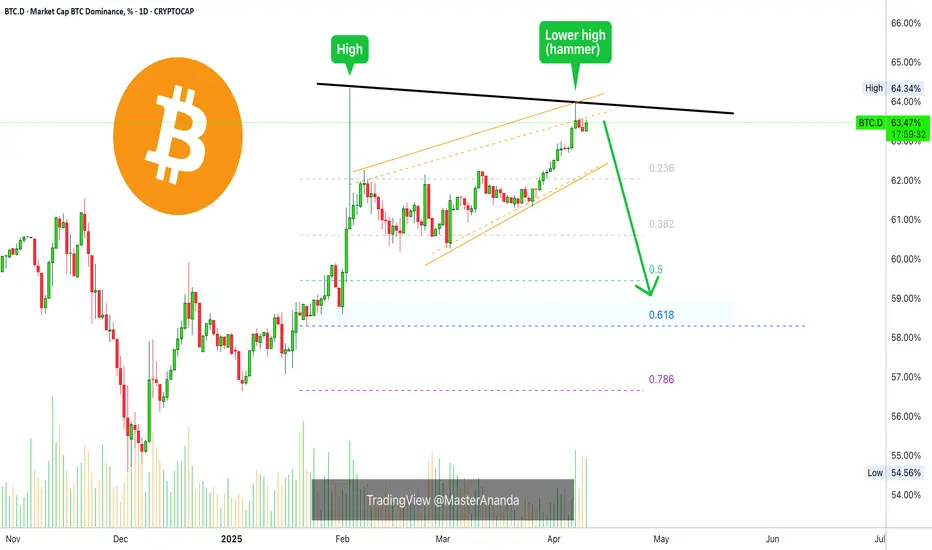
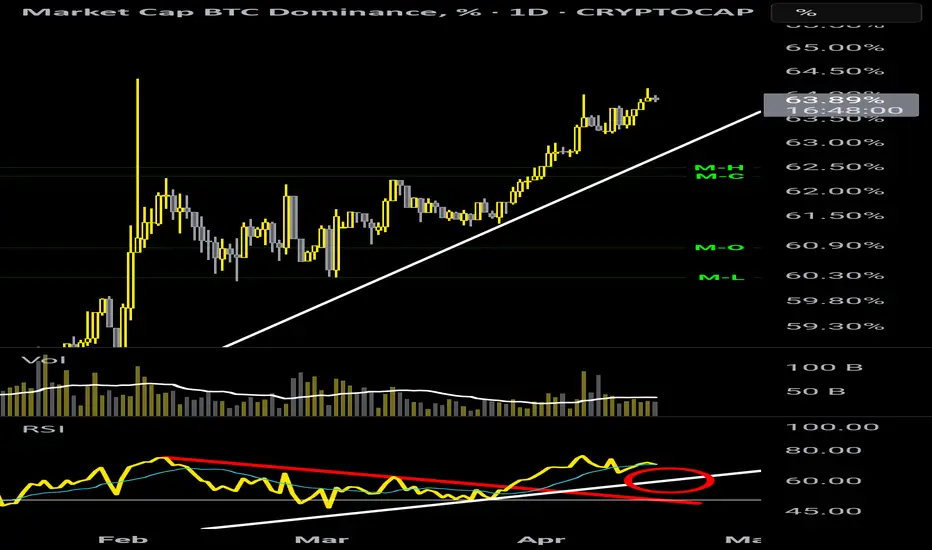
Bitcoin Dominance Quick UpdateThe high happened in February 2025. 7-April produced a lower high.
The session that produced the lower high is also a hammer. A hammer here can indicate an upcoming change of trend.
As long as BTC.D remains below 64% it has a very high probability of starting a descent.
If BTC Dominance moves and closes daily above 64%, this analysis and signals become invalid.
If the BTC.D hovers below 64%, the longer it stays below this level the weaker it becomes.
When this index goes down, everything Cryptocurrency grows, including Bitcoin.
It will be very interesting to see how it all develops. More and more signals are pointing toward an Altcoins market bullish wave developing now, not later. Do you agree?
Thank you for reading.
Namaste.
Will We have an Alt season soon?I believe the charts show we may be very close to an Alt season.
Chart show Bitcoin Dominance as percent of Crypto Market.
Reasons I believe an alt Season may be close.
1. We are at the top of a rising Wedge.
2. We are at the top of a parallel channel.
3. Sentiment is in the dumpster.
4. The Fibs look right for a .618 retracement to a support level
from recent swing highs to lows.
5. We hit the Fib .702 retracement from all time highs on Dominance.
Only time will tell. But If this does happen the rhetoric to never sell will once again be in full force. I will take something off the table if this hits.
BTC dominance : Breakout or Fakeout?Join our community and start your crypto journey today for:
In-depth market analysis
Accurate trade setups
Early access to trending altcoins
Life-changing profit potential
Let's analyze BTC dominance :
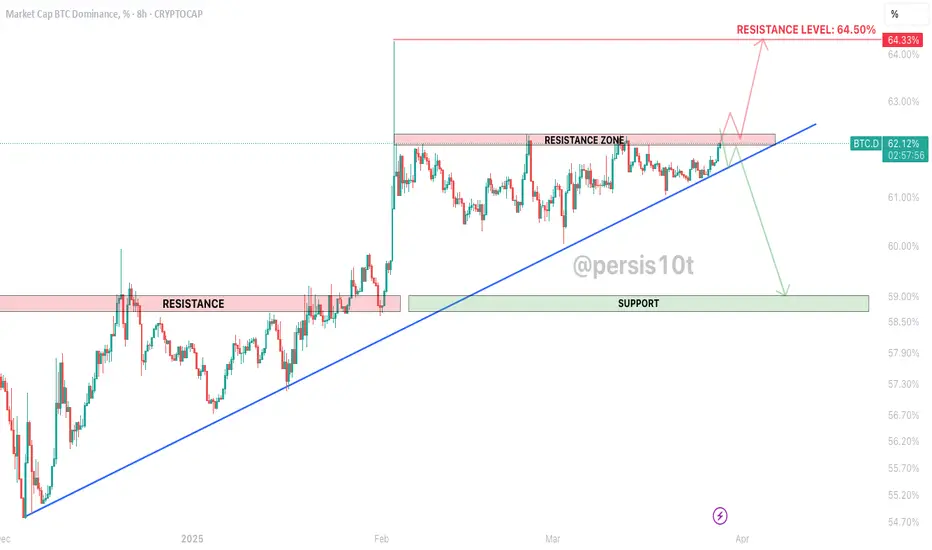
For four months, BTC dominance (BTC.D) has held a trendline support. After breaking out of an ascending triangle, BTC.D is forming another, with resistance at 62%-62.3%, repeatedly tested. A break above targets 64.50%, a strong resistance. Conversely, a trendline breakdown signals a potential drop to 59% support. Monitor these levels; a decisive break will heavily influence altcoin market dynamics.
Lower Support Levels:
59%-58.7%
Resistance Level:
62%-62.30%
64-50%
If you find this analysis helpful, please hit the like button to support my content! Share your thoughts in the comments, and feel free to request any specific chart analysis you’d like to see.
Happy Trading!!
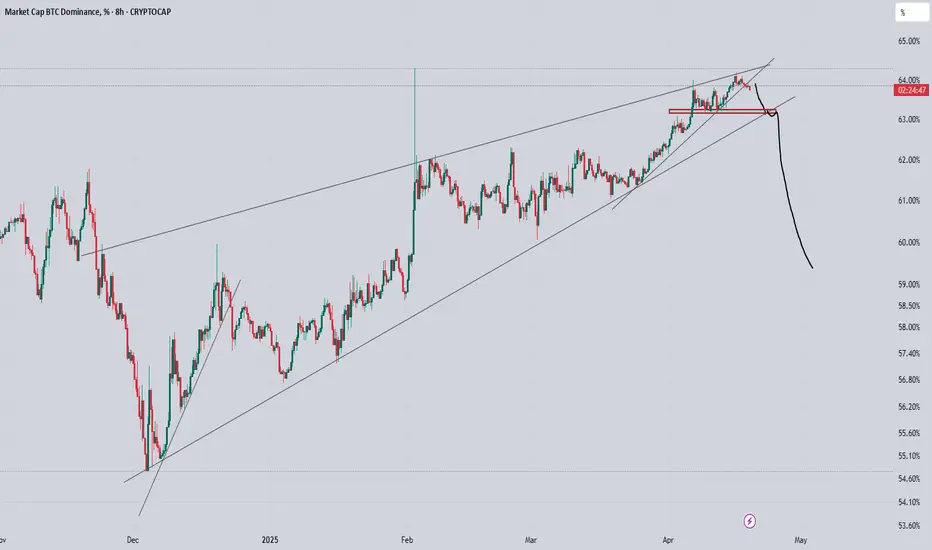
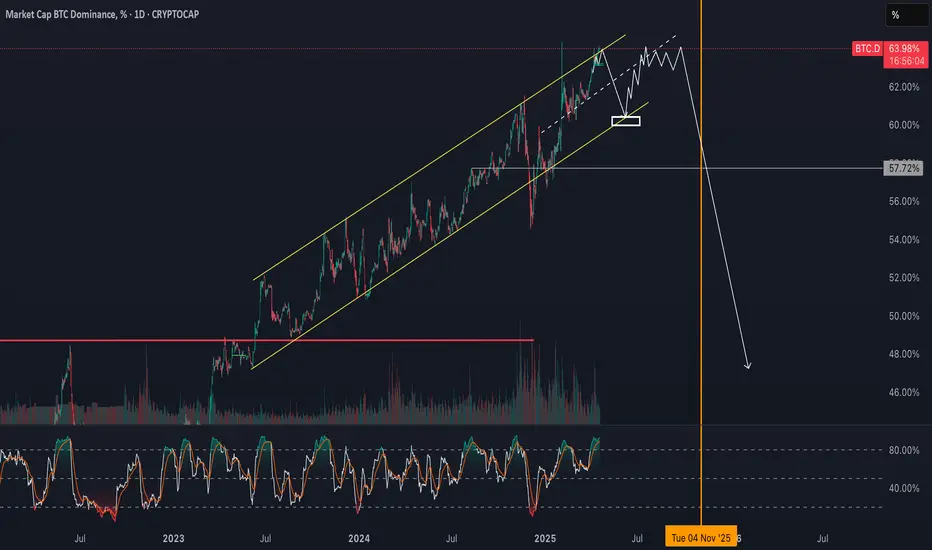
BTC.D Fall DownGetting ready for a strong fall down in BTC Dominance. Now we found it at the top of the upside channel, next movement is to touch the downside, go back up on summer and finnally go downside on Q4 2025.
BTC.D BITCOIN DOMINANCE near trendlineBTC.D is near the trendline.
Will we see a bounce right of the trendline? If so we could get the altseason we all are waiting for. However due too the massive growth in the number of altcoins and the many rugpulls in the meme sector and even liquidations as in CRYPTOCAP:OM for example, we could be in for a complete other scenario.
BTC could also keep the higher levels of dominance due to new ETF inflows and reserves by country's and the negative new in the alts. FUD could build up on the alts. So will we see an alt season in that case.... Even CRYPTOCAP:ETH is dropping so low.....
If we will see an altseason it will be different. Other bullruns there were just a few hundred altcoins so it was easy to pump them all. New we have milions of coins and the money supply is limmited. The inflows in BTC are stuck there in ETF's and reserves... So that looks nice but it won't flow back into alts in my opinion.
So what can we expect from the so called altseason.... Well i believe we will see rotation from narrative to narrative. The mass (retail) will first jump on the train with trading the pairs they know. In taht case we will see the first pumps in the bigger MEME's and DINO coins (coins that have survived several bullrun cycles like XRP, LTC, ADA, ETH, BNB, LINK).
Why DINO coins will pump? Because retail knows these coins and all the new coins are just too many to deal with. They just won't understand. Off course we will see projects like SOL, SUI, HBAR, ATH and several others pump with the coins but not every coin has the same visibility.
After these two narratives the rest could follow. A few a quite certain. Like AI, RWA, DeFi and a few others. But also in these narratives it will be cherry picking the good and proven projects.
So choose your darlings with care and don't mary your coins! All alts will drop 90% in the bearmarket!
Bitcoin Dominance
Dominance, after making the higher high talked about in the sessions and the previous update, has now established some bearish confluences on the daily chart. Some of those are bearish SFP, the parabolic chart price action, establishing a bearish divergence on the this chart as well, which will be confirmed if we got a red candle close(It'd be better if today's candle be red).
Let's just wait and see whether we do get a close or no, continuation of which will effect positively on alts.
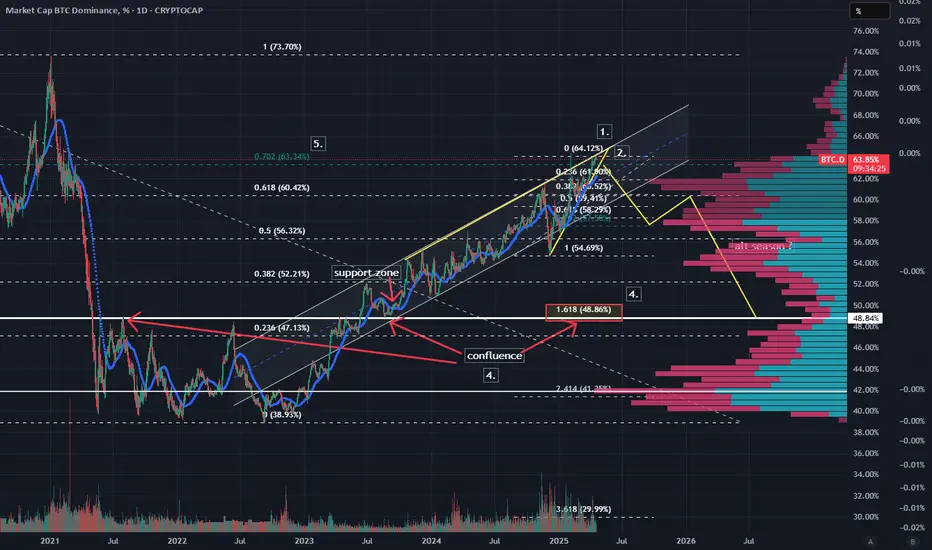
Worries about BTC Dominance for your Alts? Bitcoin Dominance Is Very Close to a Downtrend – Altcoin Season Is Near
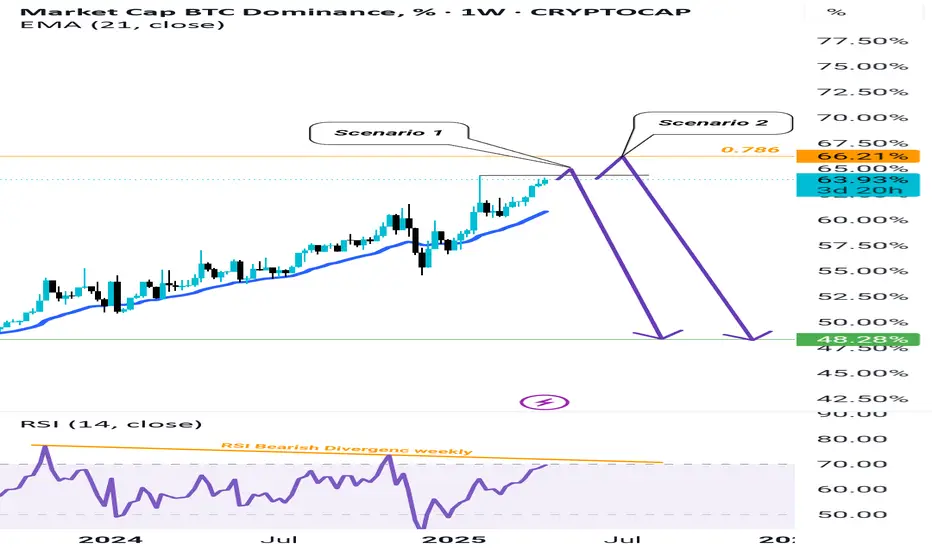
Bitcoin dominance is likely to enter a downtrend soon—because no uptrend lasts forever. This shift may occur within just a few weeks. As you can see in our current Scenario1
, Bitcoin dominance might sweep its previous high and reverse from there. However, if a daily candle closes above the previous high, then we move into Scenario 2.
In Scenario 2 , we look toward the 0.786 Fibonacci level, which is known as a strong retracement zone. Whenever price reaches this level, it typically experiences a significant pullback or even starts a new downtrend. This gives us two strong confluences already.
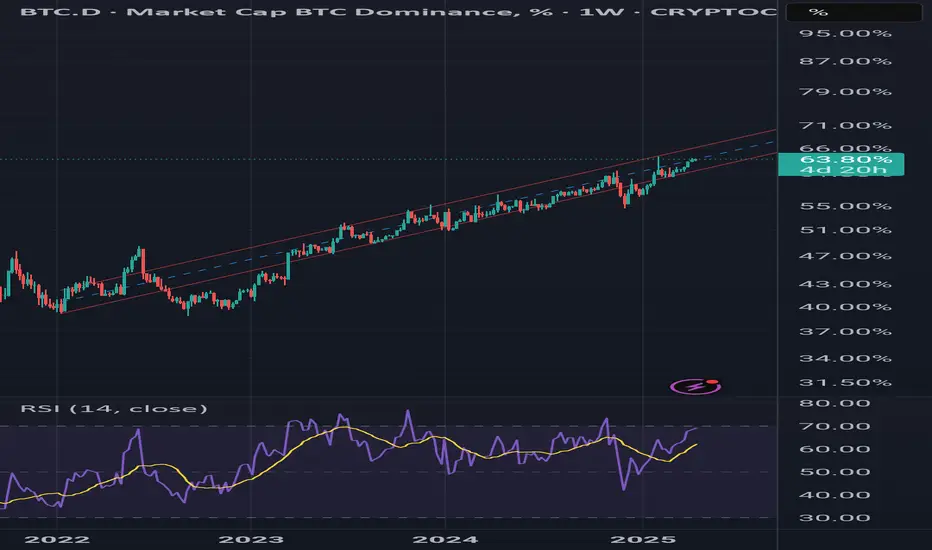
The third major confluence is that on the weekly timeframe, the RSI (Relative Strength Index) is consistently showing bearish divergence—which is often a clear signal that a reversal is near.
Fourth confluence 21 EMA is getting close on 1W Time frame breaking 21 Ema can trigger a downtrend for BTC dominance.
Don't lose hope.
In short, Bitcoin dominance is close to reversing, and you just need to be a little more patient. The altcoin season you’ve been waiting for is coming soon.
If you’ve made it this far—after so much pain, so many difficulties, and countless moments of doubt—then hold on just a little longer. Success is near, and your patience will soon be rewarded.
Comment if you like my work and free premium updates like this and follow me to save yourself from losses and being on the wrong side.
Your comment motivates me
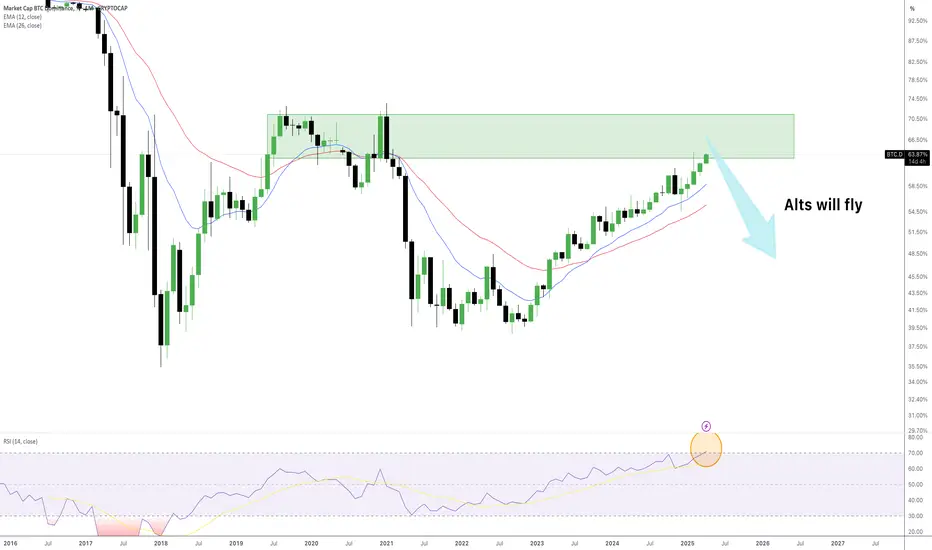
ALTS will soon have a huge run.For the first time ever the BTC dominance chart is reaching a RSI level of more then 70!
We hit major supply and i believe we will soon reject from this zone.
BTC will move sideways and ALTCOINS will have there time to shine.
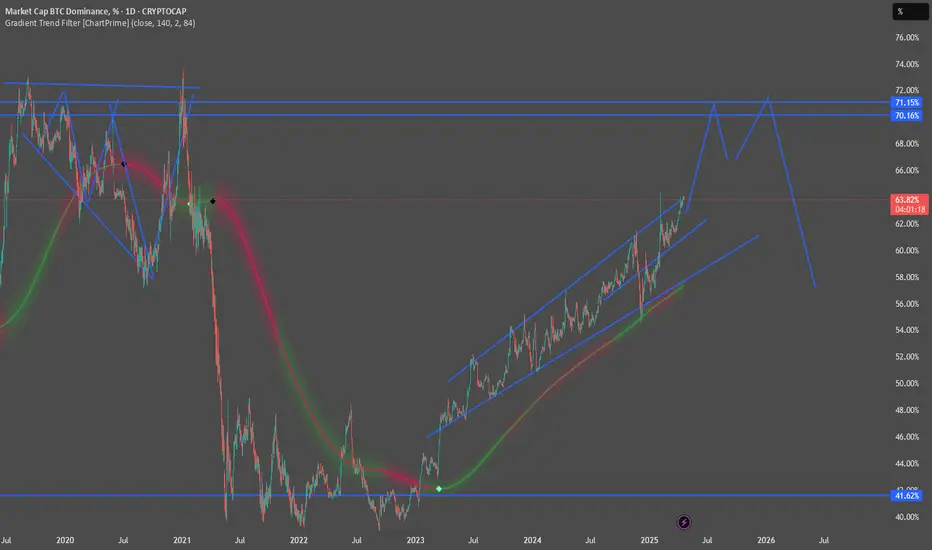
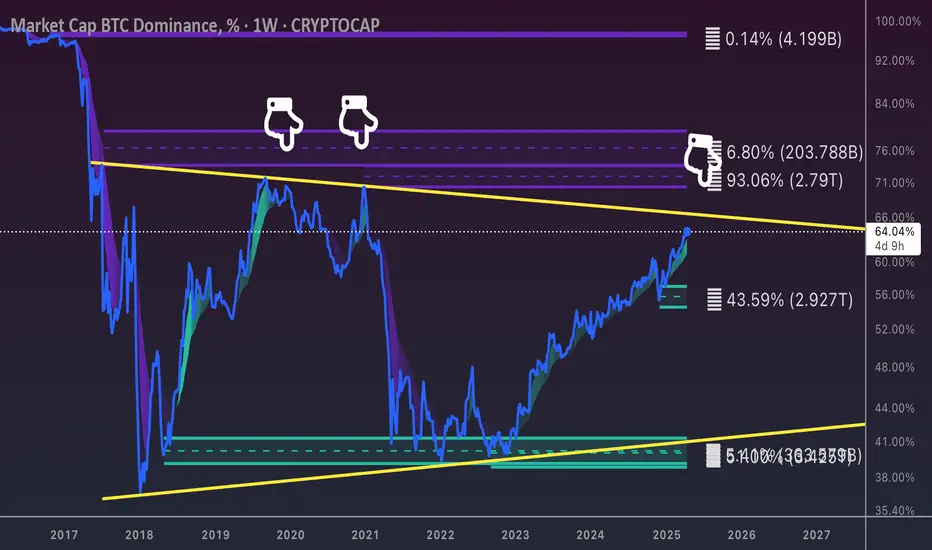
BTC Dominance Nearing Breaking Point – What It Means for Alts🚨📈 BTC Dominance Nearing Breaking Point – What It Means for Alts ⚠️🧩
Bitcoin Dominance (BTC.D) is climbing — and fast. As of now, we're at 64.13% , officially in the “ Bad for Alts ” zone. Historically, this level has meant one thing for altcoins: trouble ahead . But what if we go further?
🔵 The chart tells the full story:
Above 73% dominance, we're not just bad — it's disaster territory for altcoins.
The biggest alt bull runs in history started when BTC dominance reversed from these high levels .
But now? We're riding a rising channel with no sign of slowing, and a potential peak at 71.34% could be next.
📉 If dominance hits that upper wedge, altcoins may face an extinction-level drawdown — especially if meme coins, scams, and greedy behavior continue to dominate the space.
🧠 As the chart says:
“The END of Alts would be back here…” (not a valid scenario in my opinion but it exists)
Unless fundamentals and real utility make a comeback, we may be heading for a cleansing phase — where only the strongest survive . And that's Bitcoin only.
🔎 Key Zones:
>73% = 🚫 Disaster for Alts
64–73% = ❌ Bad for Alts
54–62% = ⚖️ Neutral / Good for select alts
<45% = ✅ Historically Great for Altcoins
💬 What do you think? Is this a final dominance pump before reversal? Or are we witnessing the long-awaited re-centralization of crypto around BTC?
One Love,
The FXPROFESSOR 💙

Bitcoin dominance is aiming to hit FIb 1.141 - Alt Season when ?Currently bitcoin dominance is around 64% and about to hit Fib 1 which is the previous high 64.34%.
We can expect bitcoin to breach this previous high easily and head towards the next resistance around the fib value 1.414. This is a strong resistance and if dominance breaks this value then next target is 70% is which around the high value achieve during the 2020 bear run.
I'm expecting dominance to reverse around 1.414 and altseason will start once dominance starts dropping.
Cheers!
GreenCrypto

$BTC #Altcoin Bitcoin dominance is approaching in our resistance trend. will we break or dump? stay alert 👍👍👍👍
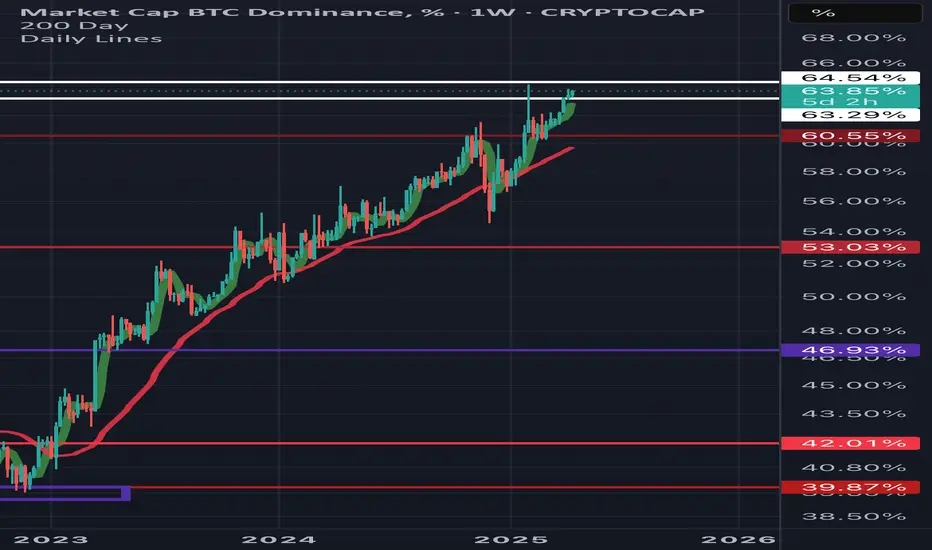
BTC Dominance (BTC.D)BTC Dominance (BTC.D) Analysis - Historical Resistance at 64%; Is the Market Ready for a Big Shift?🔥
Hey there, awesome traders! 👋
I’m here with a mind-blowing analysis of the Bitcoin Dominance (BTC.D) chart that could be a game-changer in this critical market moment. BTC Dominance is currently sitting at 64.01%, right at a super pivotal point. Let’s break down the chart together and see what’s coming next! 🚀
📊 Technical Analysis:
1. Current Situation and Ascending Triangle Pattern:
BTC Dominance has hit 64.01% and is forming an ascending triangle pattern (white lines on the chart). This pattern is typically bullish and signals strong buying pressure in the market. Right now, the price is testing the historical resistance at 64%, a level that has rejected price multiple times in the past (like in 2017 and 2021). If this resistance breaks, it could be a massive bullish signal for Bitcoin’s dominance and the start of a new uptrend. But if it gets rejected, we might see a significant drop!
2. Resistance Levels:
64% (Current Resistance): This is a strong historical resistance where the price is currently struggling. It’s been rejected at this level several times in the past, leading to pullbacks. A confirmed breakout above this level could be a powerful bullish signal.70.50%: If 64% breaks, the next resistance is at 70.50%. This level acted as resistance back in early 2021.78%: The next resistance is at 78%, a level that has been a solid barrier during historical peaks (like late 2017).86%: A longer-term resistance sits at 86%, which played a role in early 2017. It’s unlikely we’ll hit this in the short term, but it could be a target in a strong bullish trend.
3. Support Levels:
58.50%: If the price gets rejected at 64% and drops, the first support is at 58.50%. This level has acted as good support in the past (e.g., mid-2023).
54.50%: The next support is at 54.50%. This area has also held price during previous downtrends.
50.50%: A stronger support lies at
50.50%, which could be a good reversal point if the price reaches it.46.50%: A long-term support is at
46.50%, where the price bounced back in late 2022.
4. Signals and Market Behavior:
The chart shows an active "SELL" signal, indicating potential selling pressure at this 64% level. However, if trading volume picks up and the price manages to stabilize above 64%, this signal could be invalidated, turning into a strong buy signal for Bitcoin. On the other hand, if it gets rejected, we might see a drop toward the supports at 58.50% or even 54.50%.
📈 Overall Analysis and Prediction:
BTC Dominance at 64% is at a critical juncture. This level reflects Bitcoin’s control over the market, and a breakout here would signal that investors are favoring Bitcoin as a safer asset in the current market environment. This could put significant pressure on altcoins, as capital flows from them into Bitcoin, potentially leading to a downtrend for altcoins. However, if this resistance is rejected and dominance drops, it could spark a golden opportunity for an altseason, with altcoins seeing a solid rally as funds shift away from Bitcoin.Possible Scenarios:
Bullish Scenario: If the price stabilizes above 64% (e.g., a few weekly candles close above this level), it could head toward 70.50% and then 78%. In this case, Bitcoin would gain more strength, and altcoins might face selling pressure.
Bearish Scenario: If the price gets rejected and falls below 64%, we could see a drop to 58.50% or even 54.50%. In this scenario, altcoins could see a strong growth opportunity as capital flows from Bitcoin into them.
💡 Suggested Strategy:
For Bitcoin Traders: Wait to see if the price stabilizes above 64%. If it does, this could be a strong buy signal for Bitcoin. But if it gets rejected, be cautious of a drop and consider buying at lower support levels like 58.50%.
For Altcoin Traders: If you’re focused on altcoins, play it safe for now. A breakout above 64% could hurt altcoins, but a rejection might create an excellent opportunity for altcoin growth.
Trading Volume: Keep an eye on trading volume. A breakout without high volume might be a fakeout.
🔥 Final Thoughts:
This chart shows the market is at a crucial, game-changing moment. A breakout or rejection at 64% could shift the entire crypto market’s direction. What do you think? What’s your take on this analysis? Drop your thoughts in the comments—I’d love to hear from you! 🙌
Don’t forget to like and follow—let’s rock the market together! 💪
#BTC #Dominance #Crypto #TechnicalAnalysis #TradingView
Quick Recap:
Resistances: 64%, 70.50%, 78%, 86%
Supports: 58.50%, 54.50%, 50.50%, 46.50%

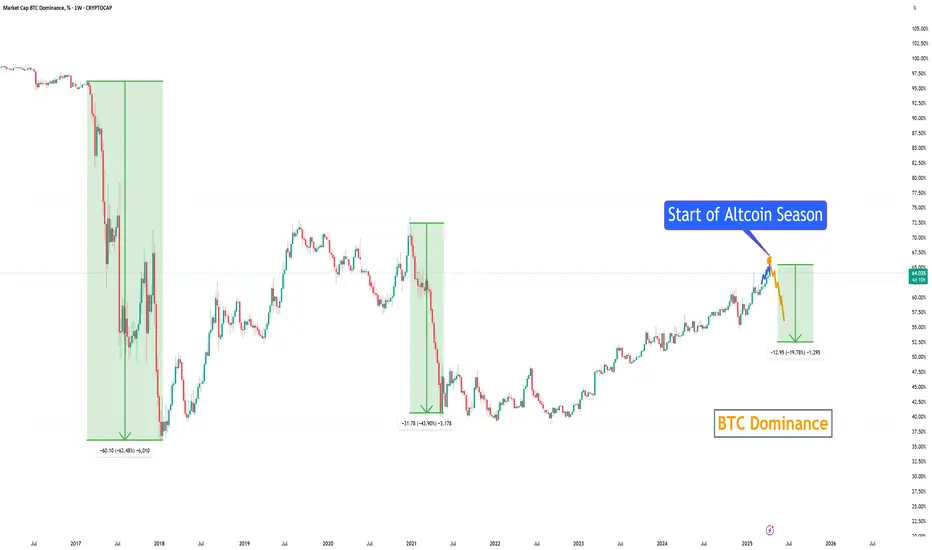
Altcoin Season in May/June 2025First proper Altcoin Season -> 1 Year, -62% for BTC Dominance (Alts Crush BTC)
Second proper Altcoin Season -> 6 months, -44% for BTC Dominance (Alts Crush BTC again)
Third proper Altcoin Season (upcoming) -> 2-3 months, -20-25% for BTC Dominance (Alts will outperform BTC)
Diminishing returns for Altcoins, because there is not much utility for Altcoins as of now
ETH -> underwhelming performance in the last 2 years, thus gthe eneral altcoin market suffers
Mantra, memecoins, Luna, FTT , and many other scams affect the market, More people just buy BTC and forget and don't touch alts
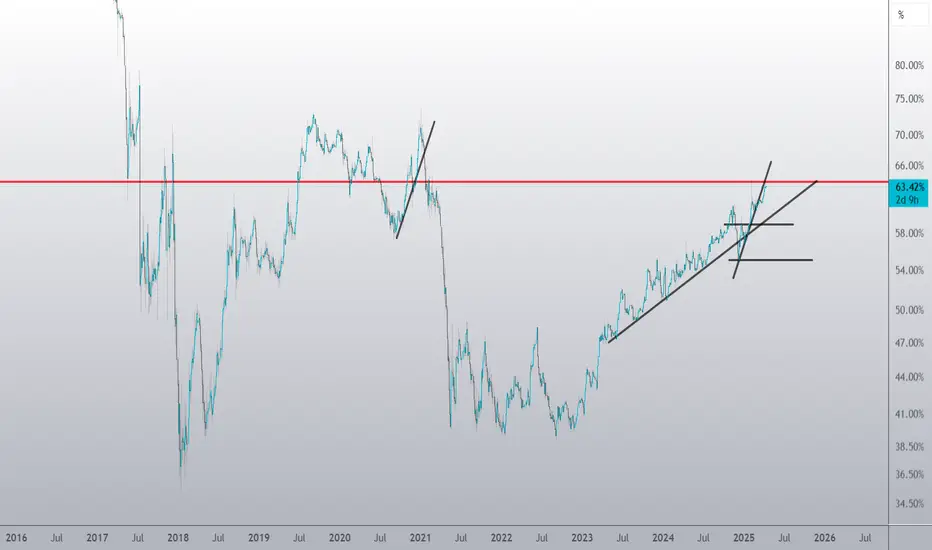
BTC.D Bitcoin Dominance!Are you ready for a big Altcoin rally? We are facing an Altcoin Season that may not last long. Load Your Bullets!
Maybe?7 Consecutive weekly Green candles, 5 consecutive monthly green candles
Retesting Ascending Wedge/ Convergence of trendline from previous highs.
Uncertainty in the markets with tariffs, Alts getting crushed. Reprieve rally incoming?
Then again could be making all these trend lines up.. Time will tell
They say things never go up in a straight line….64% been the target back up
I would hope nothing higher than that would truly hurt the alts.
In my opinion I really think we have bottom unless this trade war starts to change the direction of the market again.
A break down from such a massive run should be biblical !
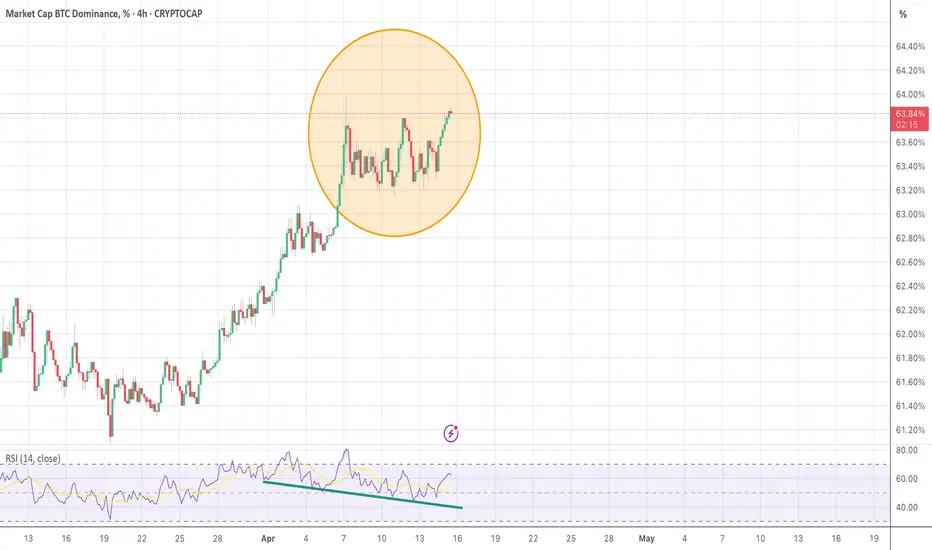
Triple top BTC Dominance on 4hr? RSI falling with each top (in circle) being higher than the previous.
Are we about to see dominance fall with ETH/BTC taking a breath?