Trump's Crypto Policies Drive Bitcoin Dominance to New HighsSince President Trump's inauguration, Bitcoin dominance (BTC.D) has steadily climbed from around 55% to over 63%, reflecting a significant shift in market dynamics. This rise is largely attributed to the U.S. government's strategic accumulation of Bitcoin, including the establishment of a Strategic Bitcoin Reserve funded by seized assets. Such initiatives have redirected capital from altcoins to Bitcoin, reinforcing its dominance in the cryptocurrency market.
BTC Dominance (BTC.D) is hovering at a critical resistance zone between 63% and 64%. A breakout above 65% could signal increased capital flow into Bitcoin, potentially pushing its price down to $75K or even $55K, while altcoins may underperform. Conversely, a rejection at this level might indicate the onset of an altcoin season. Currently, Bitcoin is trading around $85K, awaiting a catalyst to determine its next significant move.
BTC.D trade ideas

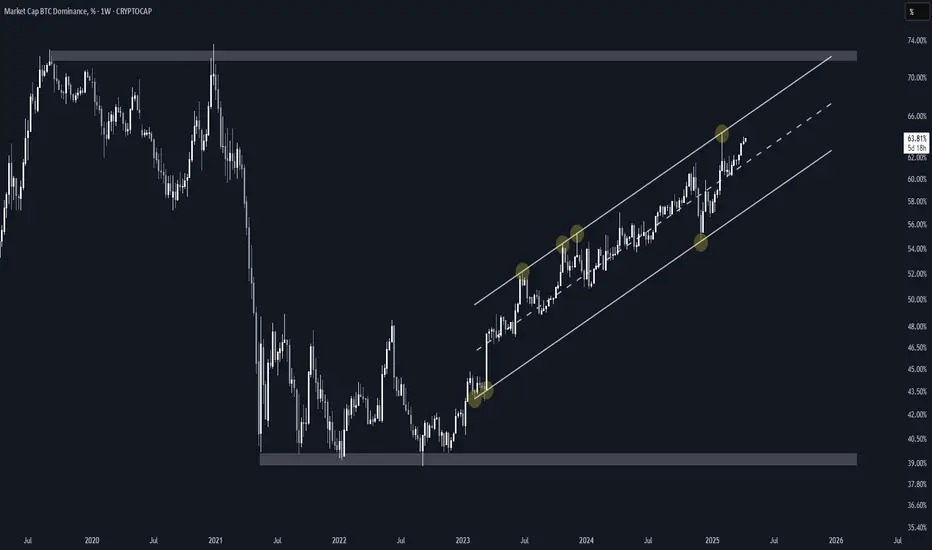
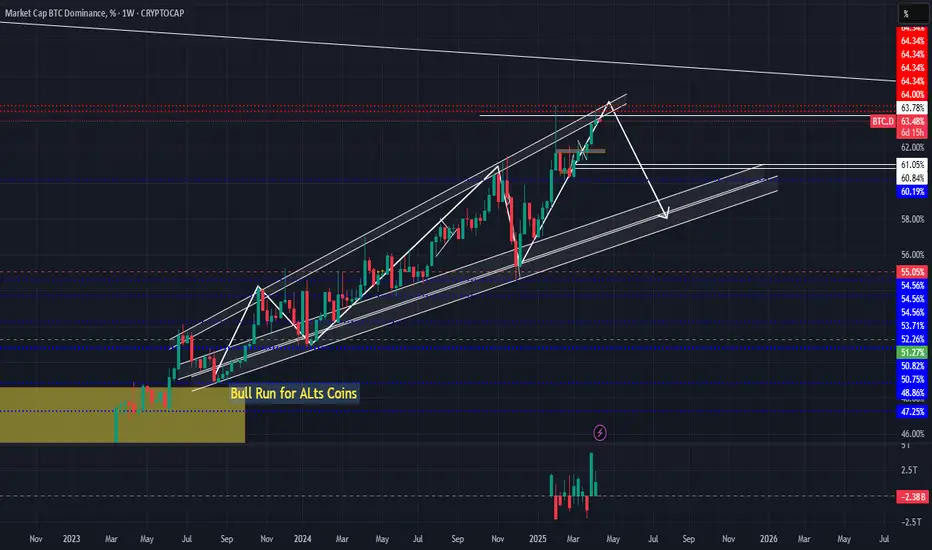
Bitcoin Dominance Ascending Channel and Altseason (1W Log)CRYPTOCAP:BTC.D has been in a clean uptrend inside an ascending channel for over 2 years.
• The midline has consistently acted as a magnet, but BTC.D has recently detached from it and might be headed for another retest of the upper boundary.
• Unless major macro catalysts intervene, I expect no notable changes until the 72-73% key area, the same zone that triggered 2021's altseason.
Regarding altseason, this cycle isn't like previous ones. With millions of tokens today, dilution is real, and a full-blown altseason where everything pumps seems unlikely.
Instead, I expect selective rotation into quality projects, and that might actually make it easier to find real outperformance.
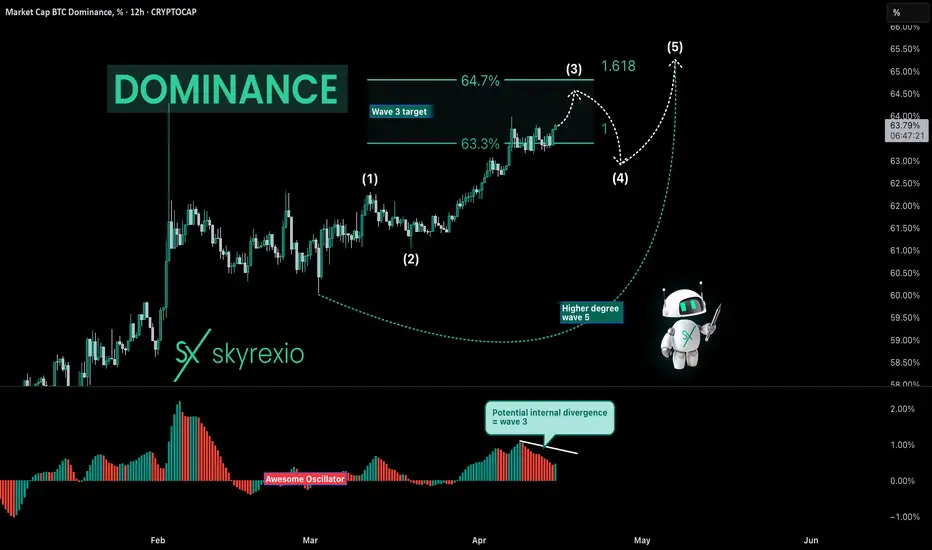
Bitcoin Dominance Is Printing The Last Shakeout Hello, Skyrexians!
Recently we pointed out that CRYPTOCAP:BTC.D is in the last bullish wave which has a target approximately at 66% and the bear market on altcoins is almost over. Today we will look in details on this wave inside and try to predict the most precise scenario.
Let's take a look at 12h time frame. Here we can see the wave 1 and 2 and now price is in wave 3. Fibonacci extension levels 1 and 1.61 is the target for wave 3. Looking at the current wave we can say that it's not over, so it will likely to see 64.7% in this wave before the correction. Correction is going to be subwave 4 which will likely be finished at 63% then we have the last wave which can be equal to wave 1. In this case predicted earlier 66% will be reached at the end of April.
Best regards,
Skyrexio Team
___________________________________________________________
Please, boost this article and subscribe our page if you like analysis!
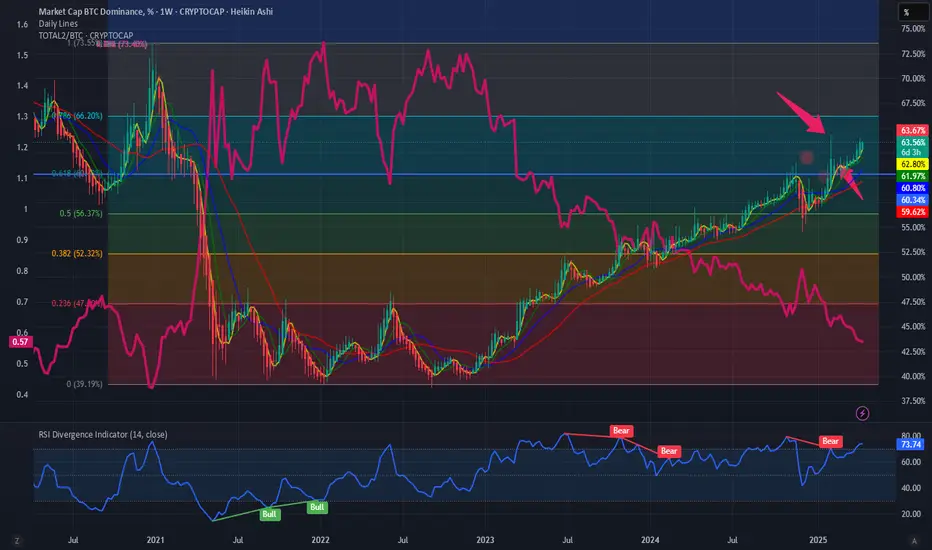
$BTC.D to 66%, $TOTAL2 / BTC down to 0.43The final year of bitcoin halving year is usually a bullish year for the Altcoins. CRYPTOCAP:TOTAL2 is the measure of the Total Market Crypto Market CAP without $BTC. Today we are looking into a ratio chart of TOTAL2 vs BTC Market cap. The supposed strength in Altcoin is missing as is evident from the CRYPTOCAP:BTC.D chart and the ration chart between TOTAL2 vs BTC.
If we plot the Fib Retracement levels on the CRYPTOCAP:BTC.D from the last cycle lows to the highs, we see that in the current halving cycle the CRYPTOCAP:BTC.D is progressing towards 0.786 Fib retracement levels which is currently indicating a CRYPTOCAP:BTC.D of 66.2 %. The ratio of Toatal2 vs BTC Market cap fits surprisingly within the Fib levels and makes new lows every week in this weekly chart. The levels to watch on the ratio chart will be 0.43
What does this trend tell us. It might be possible that the Altcoins USD pairs are bullish, but the Altcoins are making new lows vs BTC. So, it's a better strategy to go long $BTC. The risk reward is very much in favour of CRYPTOCAP:BTC rather than Altcoins.
Verdict: Long CRYPTOCAP:BTC , CRYPTOCAP:BTC.D to 66%.
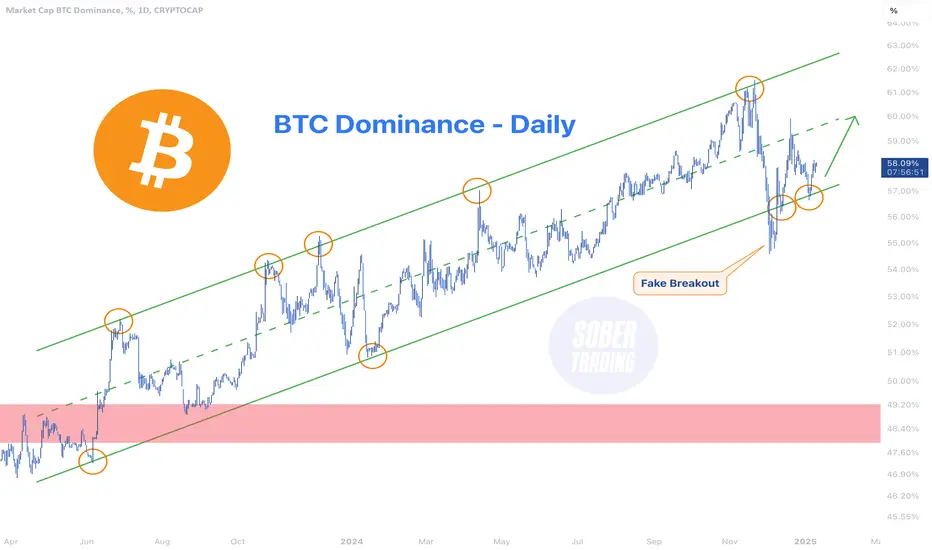
BTC.D - Still in the ascending channelCRYPTOCAP:BTC.D remains firmly within its long-standing ascending channel. The recent “fake breakout” below the channel has been invalidated as dominance swiftly returned to the channel, showing a strong reaction and confirming the channel’s validity.
This suggests:
✅ Bullish Implication for BTC: Bitcoin is likely to continue gaining dominance in bullish moves, outpacing altcoins in performance.
✅ Bearish Impact on Altcoins: In downturns, altcoins are expected to experience sharper declines compared to Bitcoin.
Traders should monitor this channel as a key indicator for market behavior, especially for Bitcoin and altcoin strategies.
BTC.D Dropping in Next and This will be the Best Bull!!!!AS you Know that BTC is getting attention from all over the world. But Now BTC Needs to stable at 100k and alts will follow this.
It’s slowly dragging.Hi.
That's what I watch.
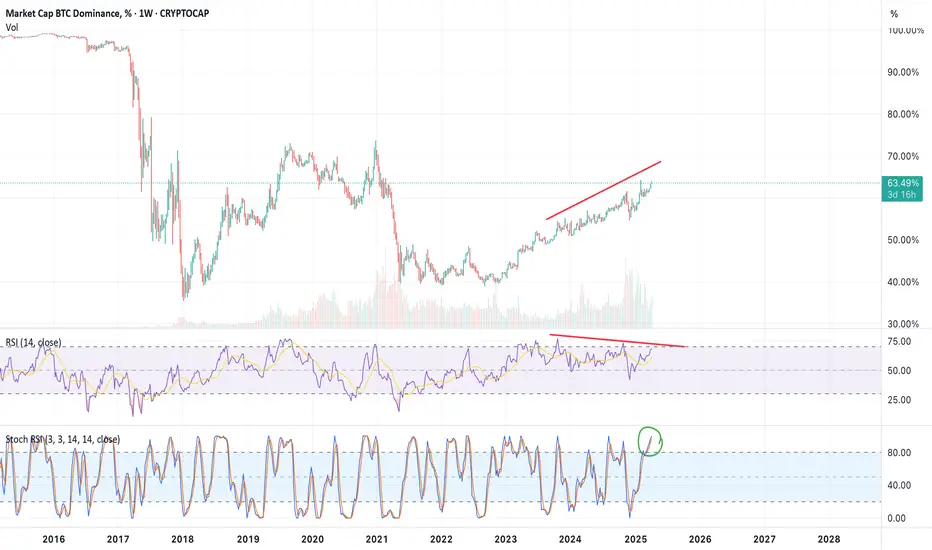
A regular bearish divergence is confirmed on the 1W chart.
So what? Over the last couple of years, there's been a pattern
of consecutive bearish divergences.
And yet there was never a real decline.
BTC Dominance : the top?Are we entering the final stages of the bull market? Will all cryptocurrencies 10-25x within 90 days?
Maybe thisPotential future directions for Bitcoin dom. A lot of international acceptance going on, which could keep it higher in the long run than we've seen in the last 7 years.
Bitcoin Dominance Update (1D)Bitcoin dominance is currently showing signs of weakness and appears to be losing momentum for another upward move.
If we see a breakdown below the 62% level, a sharp decline toward 57% is likely.
During this phase, it may feel like an altcoin season is approaching, but in reality, most altcoins will likely just be retracing previous losses rather than entering true price discovery.
Still, for those who buy the dips, it can present a profitable rally opportunity—especially in short to mid-term cycles.
— Thanks for reading.

BTC OutlookLooking for a nice double tap to mark this top at least for now.
Most alts already touch off everything seems to be lining up tough few. Months but we will be right back on track soon

Bitcoin Dominance, We Are Waiting For You!Hello, Skyrexians!
We are changing color according to the new upcoming market cycle phase, hope our forecast will be realized and it's time to be bullish. CRYPTOCAP:BTC.D is about to flash the reversal signal, while altcoins dominance and USDT dominance are already did it, but we don't also forget about disaster targets.
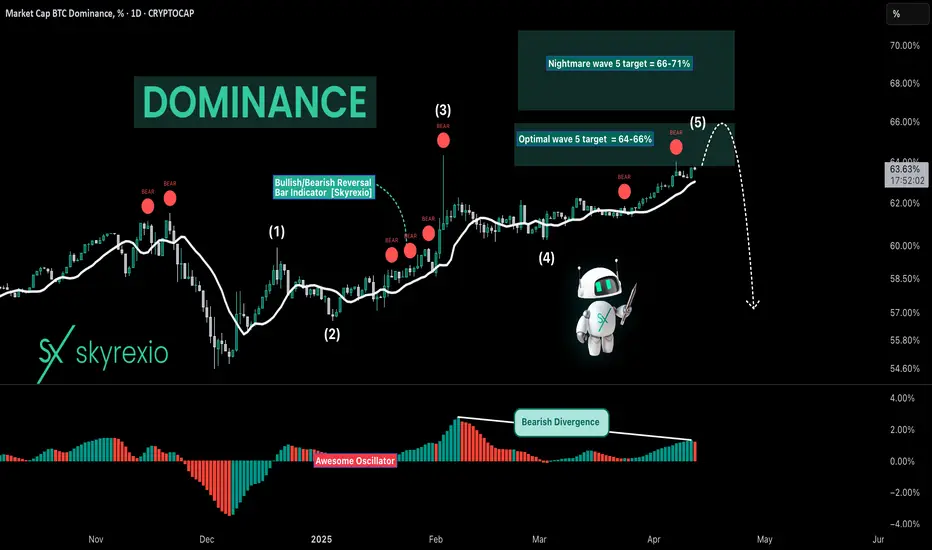
Let's take a look at the daily chart. Earlier we told that this is final wave 5 and now we are trying to catch its top. We mentioned that dominance will enter into 63-66% target area and it did it. Now we have to be focused on the reversal signals. For example Bullish/Bearish Reversal Bar Indicator has already printed the red dot at the top. Moreover Awesome Oscillator started reversing. You can say that this is the top, be our intuition tell us that some small move to the upside will be continued to 65%. Also we need to mention about nightmare wave 5 extended target at 70%, but this scenario is unlikely because it will break the divergence on the daily chart.
Best regards,
Skyrexio Team
___________________________________________________________
Please, boost this article and subscribe our page if you like analysis!
near to dump btc.dConsidering the growth of Bitcoin dominance since 2022 and Bitcoin's tendency to flow liquidity between other altcoins, it seems that, contrary to expectations, Bitcoin's power relative to the entire market will only reach such high levels of 66% under the influence of political and economic events, and the tendency to fall is quite evident.altcoin season is coming
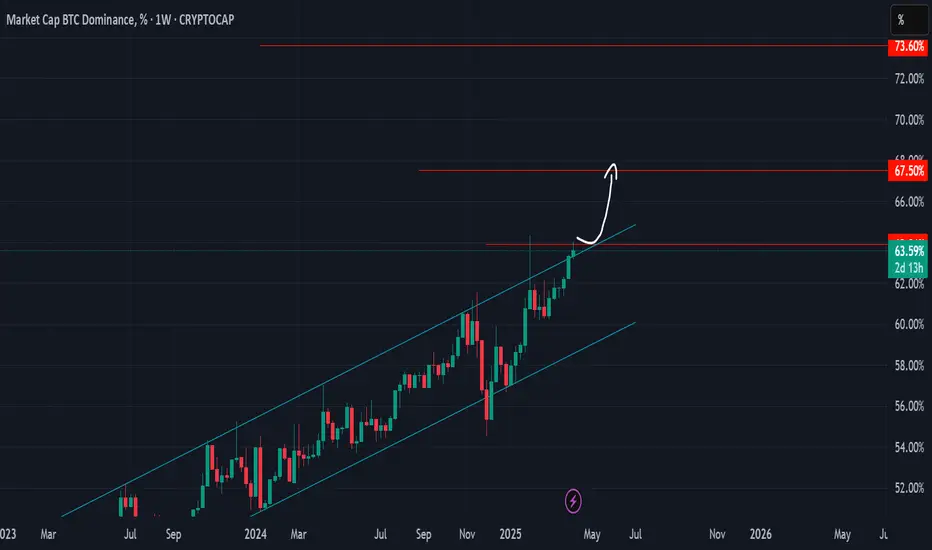
Bitcoin Dominance WeeklyIf dominance break above 64 this is also break bullish channel and maybe going parabolic to 67 or maybe can up to 70
Big Fish said to the swarm of tiny little fish: ......"You little filthy retail, take my ETH now. Since it is unlocked and in a profit. and choke on it ! "
You can already see how they 'talk' via all the twitter and YouTube influencer b.s. feed.
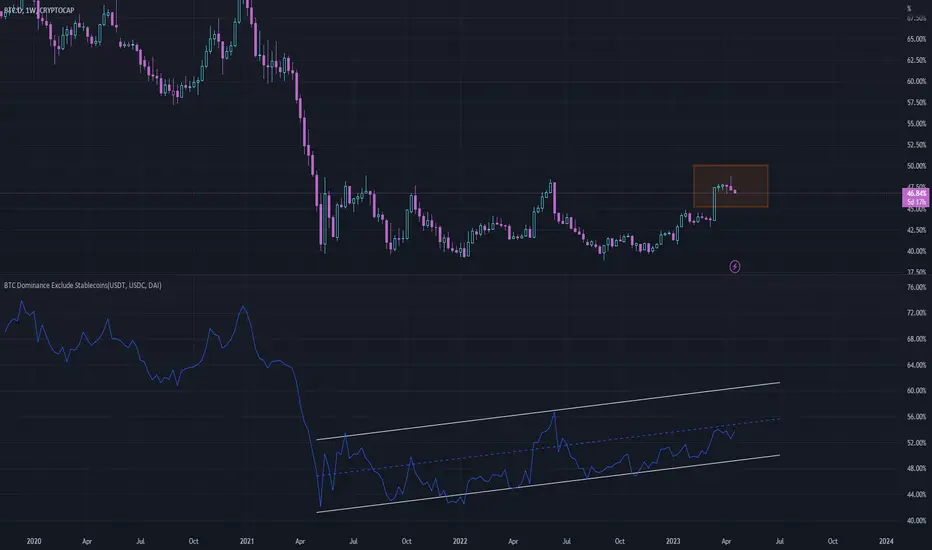
BTC Dominance without stable coins tells the real story.
BTD Dominance is in uptrend.
It did not finish yet.
This is the 'buy local top on ETH' moment for retail.
and they will shove it up your throat if you let them.
ETH is between 100-144% in profit since major bottom.
***there will be upticks on ETH usd valuation to keep 'little fish' excited and interested.
''Altseason 2025''Welcome back dearest reader,
I will probably get alot of backlash from bitcoin maxi's for writing this post, i have read and heard it all by now. I'm not disregarding their opinion on bitcoin and i think it will do well, but not as well as some altcoins which i have monitored.
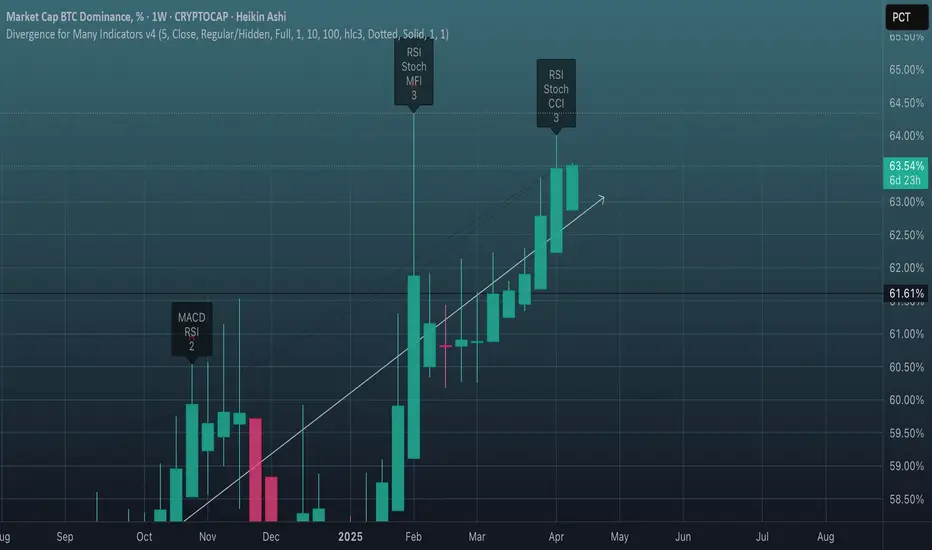
First the technical part:
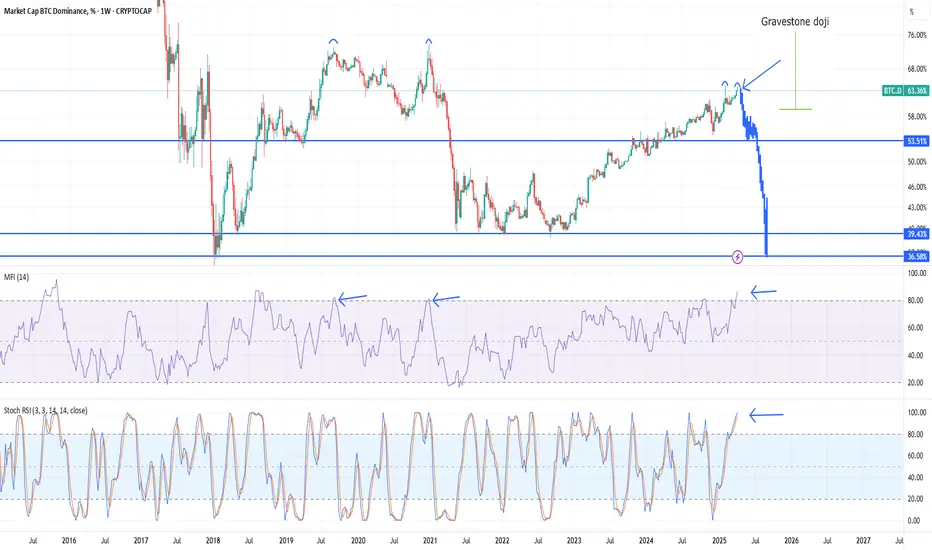
~Bitcoin has seemingly formed a double top pattern with now on the weekly a gravestone doji (confirming this sunday). Looking at previous action from 2019 and 2020, these have been topping indicators and indicate a bearish reversal which in turn will be bullish for altcoins.
~ MFI --> massively overbought.
~ Stoch RSI --> nearly at 100! Screaming for a reversal.
Over the past months everyone seemed to think ''this is the top, only to see dominance rise further and alts bleeding''. It is possible that BTC.D doesn't correct immediately, but i do suspect an altseason to be really close.
Sentiment: When everyone... i mean EVERYONE is bearish. ''Alts to zero'', ''bitcoin is the only good coin'', ''Ethereum is dead''. This has historically been the perfect time to buy. And that time is now.
''But, there are over 13 million altcoins now!''
Yes this is true, i don't think all of them are going to do well, stick to the ones available on big exchanges. Those have 400 different ones on average. From those i have covered some allready which i think are going to do well, it's worth your time to look at those ideas.
Any questions?
Ask.
~Rustle
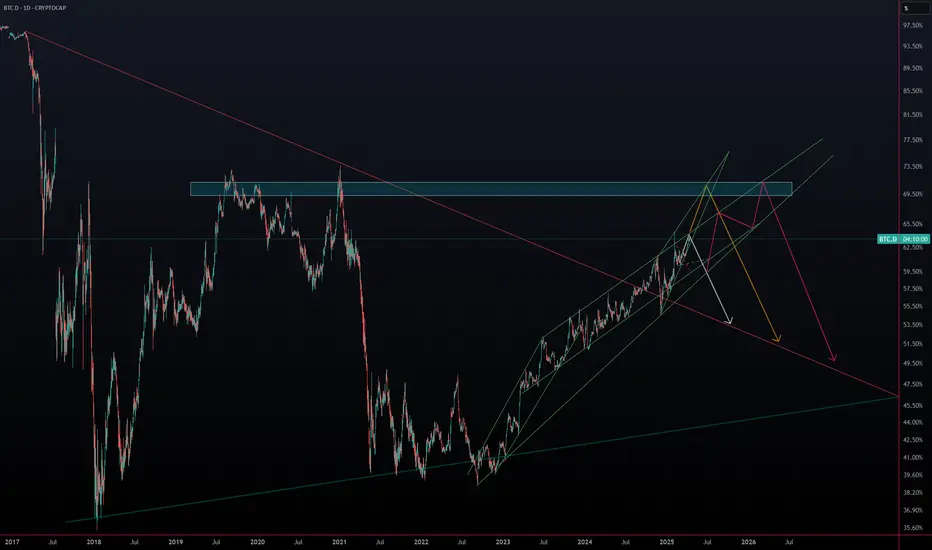
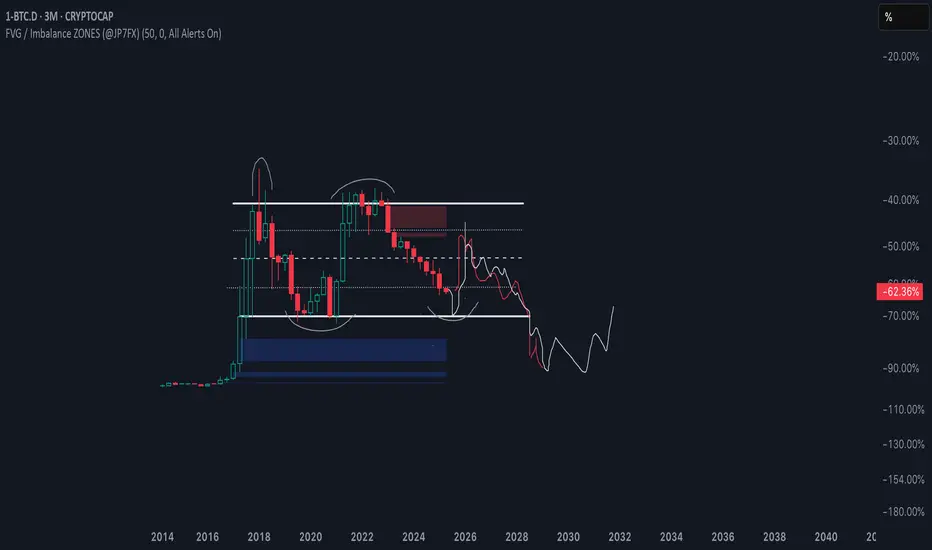
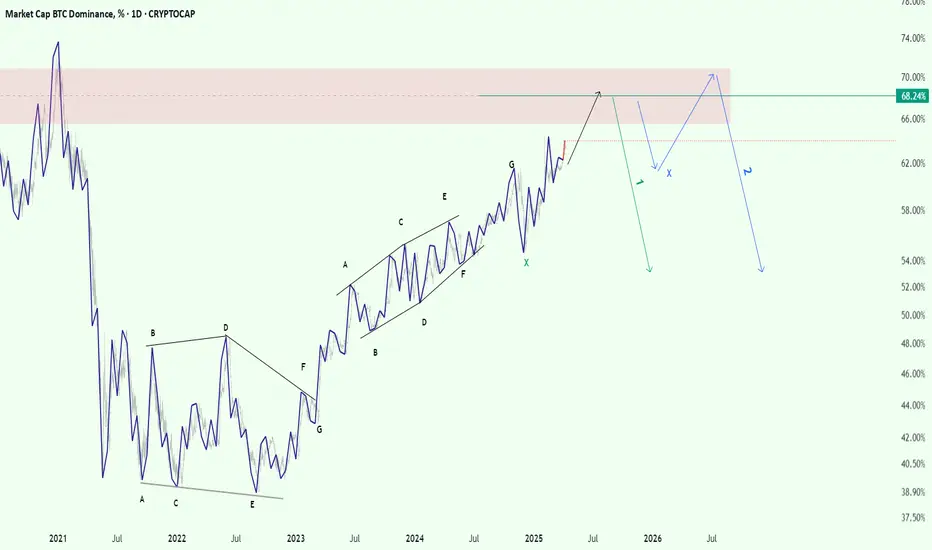
[UPDATE BTC.D] RANGE ?? 69-46-88??We either going to front run (red scenario) or go for a last crash end of Q2 then up only until the end of the year/beginning of Q1 2026. Then down until the end of the decade.
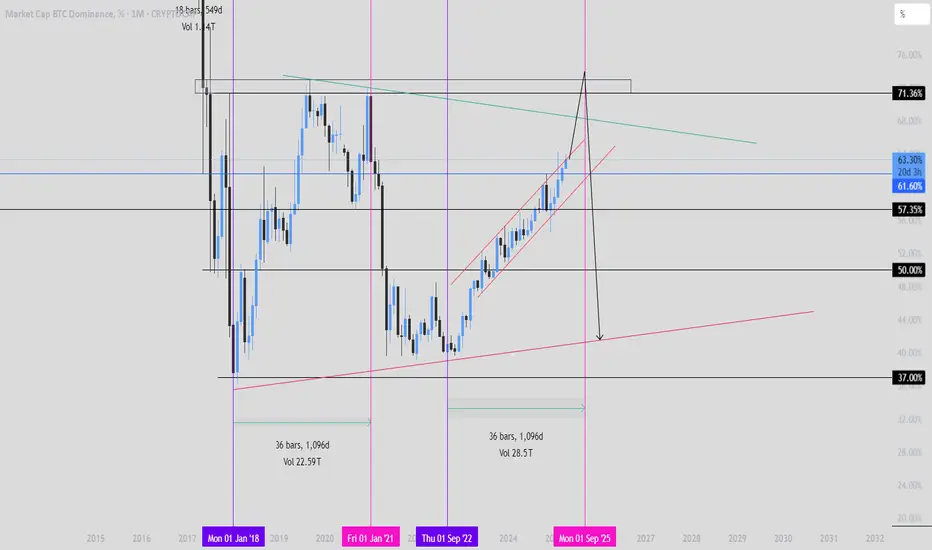
Altseason delayed ?Altseason to start on Semptember of 2025.
When you look at the history it shows that from the lowest point of dominance in 2018 to the heighest point in 2020 december it took 1096 days.
Now the lowest point of dominace for this upcoming bull run was in september 2022 and 1096 days will be in september 2025.
Until then you can accumulate usdt and buy your favorite altcoins.
See you in 2026.
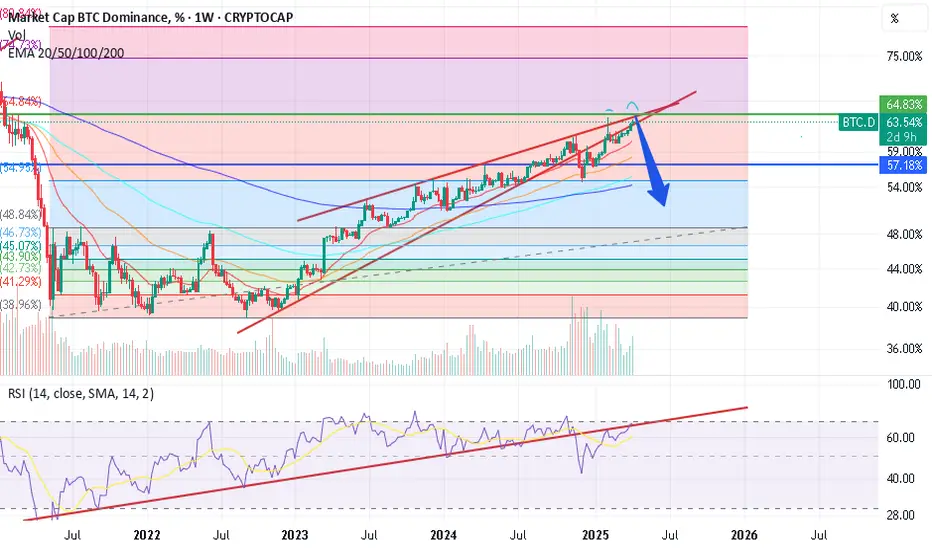
BTC dominance hinting at one last push?Hello everyone
We all are looking for a way how the BTC dominance can go down to 40% area. If we somehow can predict it correctly then we can make some money in the process.
Here is a (maybe not so) wild idea for medium term.
We are on a weekly chart.
Let's check some facts first:
- Stoch RSI is currently high (near 100).
- RSI is at 68
- Chart is making a new higher high - keep in mind previous dominance high (Feb 3rd) was a result of a flash crash of the market so I am referring to previous high as Nov 18th
So we are witnessing a bearish divergence (RSI making lower highs while chart is making higher highs). Hence drop in BTC dominance should just be a matter of time.
What if the universe aligns and following happens:
We are in economically unstable times. Markets are volatile, politicians are unpredictable so further drop in Crypto space is not impossible. BTC drops less then ALTs, BTC dominance reaches top somewhere between now and 67-68% area. In the meantime traditional markets also crash some more. After that the economic situation stabilises, we get Quantitative Easing and this drives price of ETH up, followed by other ALTs.
For reference: ETHBTC has reached strong support between 0.002300 and 0.001700 Satoshi, RSI is at 24 (same level as Sept 2019 when ETHBTC was at a longterm low).
This scenario would ignite Altseason, bringing BTC dominance down for a reset and start of a new cycle.
There are other bearish scenarios as well, keep that in mind. So trade safe and smart.
I am not predicting any of this, I am not even mentioning any possibilities for this to happen. I am just giving you some food for thought.
Good luck!
BITCOIN Dominance - BTC.DBitcoin is a decentralized cryptocurrency originally described in a 2008 whitepaper by a person, or group of people, using the alias Satoshi Nakamoto. It was launched soon after, in January 2009.
TradeCityPro | BTC.D: Predicting Alt Seasons with Bitcoin Domina👋 Welcome to TradeCity Pro!
In this analysis, I want to discuss an important crypto index that can significantly impact our trading, known as BTC.D. First, I'll provide some explanations for those unfamiliar with this index, and then we'll dive into the analysis.
🤔 What is Bitcoin Dominance?
Bitcoin Dominance is a major indicator in the crypto market. It does not directly represent supply and demand and is not tradable; the chart you see is calculated by TradingView and does not exist physically.
⚡️ This index represents the strength of Bitcoin in the crypto market. It shows the amount of money in Bitcoin divided by the total money in the crypto market.
100x(Bitcoin MarketCap / Total MarketCap) = Bitcoin Dominance
✔️ For example, if the total money in crypto is 1 trillion dollars and 500 billion dollars of that is in Bitcoin, then Bitcoin's dominance would be 50%.
✔️ Or, if the total money in crypto is 1 trillion dollars and 300 billion dollars of that is in Bitcoin, then Bitcoin's dominance would be 30%.
Now that we know what Bitcoin dominance is and how it is calculated, let's see how it can help us in trading and where it can be useful.
🤔 How is Bitcoin Dominance useful?
When we trade, we often encounter situations where both Bitcoin and an altcoin (for example, Ethereum) are triggered simultaneously according to our strategy. There are several ways we can open positions in these situations. Some open positions simultaneously on both, increasing the risk of the trade and doubling the potential loss if the market moves against us. Others may randomly choose between the two positions, which could result in taking a position on Bitcoin and hitting a stop-loss while Ethereum moves towards your target. But how can we determine which one is likely to be more profitable?
🔹 As mentioned, Bitcoin dominance indicates the strength of Bitcoin relative to the rest of the market, and there are three scenarios to consider for its analysis.
📈 In the first scenario, if the market is bullish, Bitcoin dominance can be bullish, bearish, or range-bound. If Bitcoin dominance is bullish, it means more money is entering Bitcoin, so if both Bitcoin and Ethereum are triggered simultaneously, Bitcoin is likely to rise more than Ethereum. If Bitcoin dominance is bearish, less money is entering Bitcoin relative to altcoins, so altcoins like Ethereum are likely to rise more. If Bitcoin dominance is range-bound, we analyze the market candle by candle and pay more attention to short-term momentum, deciding based on the current trend of Bitcoin dominance.
📉 In the second scenario, if the market is bearish, Bitcoin dominance can again be bullish, bearish, or range-bound.
✔️ Before explaining this scenario, let me tell you how it's possible for the market to be bearish while Bitcoin dominance increases even though Bitcoin's price is also falling. As I mentioned, Bitcoin dominance is a ratio and is shown in percentage terms, so if the market is crashing, it might be that Bitcoin is selling less than altcoins. For example, Bitcoin might sell for 10 million dollars and altcoins for 20 million dollars. Even though Bitcoin is being sold and its price is falling, it is being sold less than altcoins, so its dominance increases.
🔹 Now, let's examine the second scenario. If Bitcoin dominance is bullish, less Bitcoin is being sold compared to altcoins, so altcoins like Ethereum will have a greater drop and are better for short positions. If Bitcoin dominance is bearish, Bitcoin is being sold more than altcoins, so a short position on Bitcoin would be more suitable. Lastly, if Bitcoin dominance is range-bound, like in the first scenario, we analyze candle by candle and focus on short-term momentum.
📊 In the third scenario, if the market is range-bound, I first suggest not opening any positions because many strategies do not work well in range-bound markets, and it's better to wait for a breakout of the range's floor or ceiling before opening a position. However, if you do decide to open a position in this phase, short positions fall under the second scenario, and long positions fall under the first.
⭐ So, with Bitcoin dominance, we can optimize the positions we open and choose the best option between Bitcoin and the selected altcoin. If we look at Bitcoin dominance in higher time frames and not just as a confirmation for futures positions in lower time frames, we can identify alt seasons.
🤔 How to identify alt seasons and alt parties with Bitcoin Dominance?
So far, we've seen how dominance in different states and positions can help us in trading. Now, if we analyze Bitcoin dominance over a longer term, we can determine whether the money in the market will move more towards altcoins or Bitcoin in the coming weeks or months.
✔️ For example, if Bitcoin dominance is bullish in the weekly time frame and has a strong upward trend, naturally, more money will enter Bitcoin over time, making Bitcoin a better investment than altcoins. However, if Bitcoin dominance undergoes a correction for a few days or weeks during this bullish trend, altcoins can experience significant growth during that short time frame, which we call an alt party.
💥 On the other hand, if Bitcoin dominance completely changes trend and is bearish for several weeks or months, altcoins will naturally grow much more and will be a better investment option until Bitcoin dominance turns bullish again, which we call an alt season.
🔹 An important note about alt seasons is that Bitcoin's trend during this time must be bullish or range-bound; if Bitcoin is bearish, neither an alt season nor an alt party will occur. So, be sure to first understand the overall market trend using indicators like Total and Total2, and then look for an alt party.
Now that we've examined how this index works, let's move on to a technical analysis of the chart.
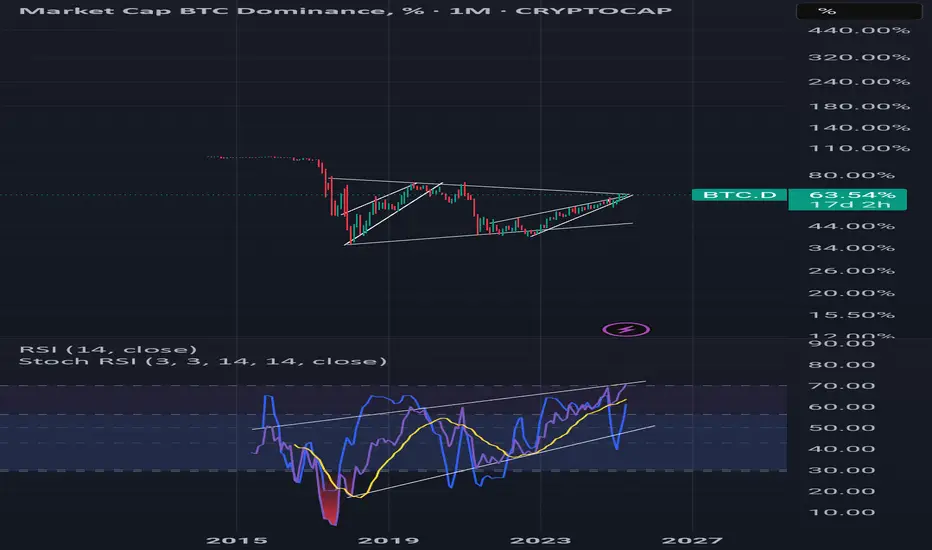
📅 Monthly Time Frame
As you can see in the monthly time frame, Bitcoin dominance had a very long range above the 95% area between 2015-2017, which was because the crypto market was still very small at that time, and many investors thought it was a scam. Thus, if anyone wanted to invest in crypto, they only bought Bitcoin.
✨ But in 2017, during Bitcoin's bull run when it reached the 20k ceiling, altcoins also entered the game, and Bitcoin dominance began to fall, spreading the crypto money among other coins. This downward movement continued down to the 40% area, and after it consolidated around this area, Bitcoin dominance started rising again, correcting the severe downturn it had experienced.
🔍 At the start of the next bull run in late 2020, Bitcoin dominance reached its peak and formed a range between 57.13 and 71.04 until the end of the bull run. After Bitcoin's bull run, in the second leg when the price moved towards the 69k area, Bitcoin dominance broke the 57.13 support and moved down to the 40% support, leading to a major alt season.
🎲 In early 2023, coinciding with the start of Bitcoin's bullish trend from the 16k bottom, Bitcoin dominance broke the 47.80 area, which was the ceiling of its box, and its upward movement restarted. Currently, Bitcoin dominance has also broken the 57.13 area and is near 64%. As long as Bitcoin dominance remains bullish, Bitcoin will still be a better buy, and altcoins will not be able to grow significantly.
💥 If Bitcoin dominance finally confirms a trend change and turns bearish, if Bitcoin's trend remains bullish, we will witness another major alt season like in 2021. For now, we confirm the change in trend in Bitcoin dominance on the monthly chart by breaking 57.13, and for a better and more accurate analysis, it's better to move on to the weekly time frame.
📅 Weekly Time Frame
In the weekly time frame, after breaking the 47.46 area, an ascending trend has formed within an ascending channel, and the price has been in this channel for about two years.
🧩 The next resistance for Bitcoin dominance is 65.59, which it is moving towards, and the main ceiling for Bitcoin dominance is 71.04. If the upward trend continues, more money will enter Bitcoin, and altcoins will not be good investment options.
🔽 For a trend change and a bearish turn in Bitcoin dominance, breaking the 60.50 area is suitable, and if Bitcoin dominance records lower highs and lows below this area, we will confirm the trend change. Breaking the channel will also be one of the most important confirmations.
📅 Daily Time Frame
In the daily time frame, we can analyze the price movement with more detail.
💫 Currently, the 62.23 area has been broken, and Bitcoin dominance is performing another bullish leg, having reached the channel ceiling. If the channel ceiling breaks, we can expect a move to the 65.59 area.
📉 For a trend change in this time frame, it's better to wait for the channel to break, but besides the channel, the 62.23 and 60.50 areas are also significant, and breaking them will confirm it.
📝 Final Thoughts
This analysis reflects our opinions and is not financial advice.
Share your thoughts in the comments, and don’t forget to share this analysis with your friends! ❤️

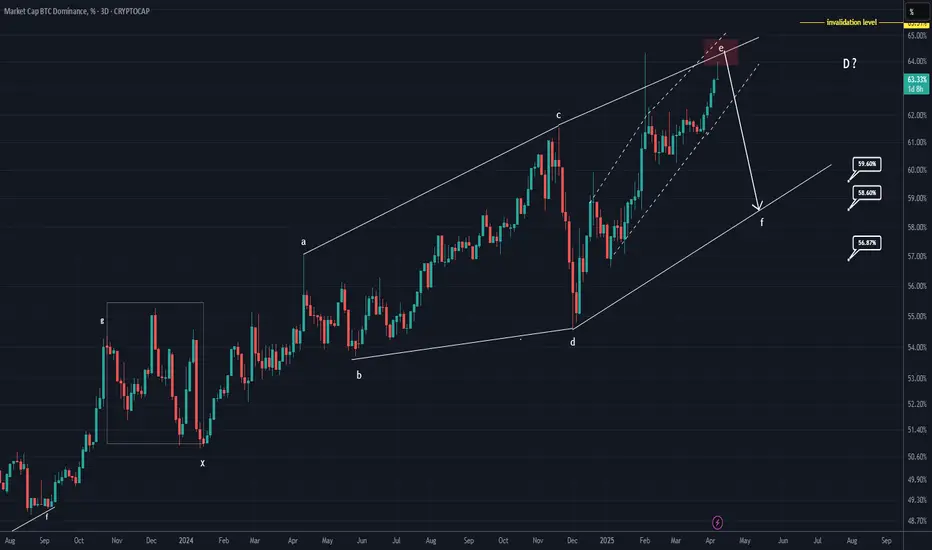
BTC DOMINANCE is fading - the altcoin wave is coming (3D)This analysis is an update of the analysis you see in the "Related publications" section
First of all, you should know that the time frame is large. the 3-day chart which means altcoins could remain bullish for 1 to 3 months. We should be looking for buy/long positions on altcoins that have strong setups.
We expect a drop from the red zone or even from the current price to complete wave f of this diametric pattern.
Targets have been marked on the chart.
A daily candle closing above the invalidation level will invalidate this analysis.
For risk management, please don't forget stop loss and capital management
Comment if you have any questions
Thank You
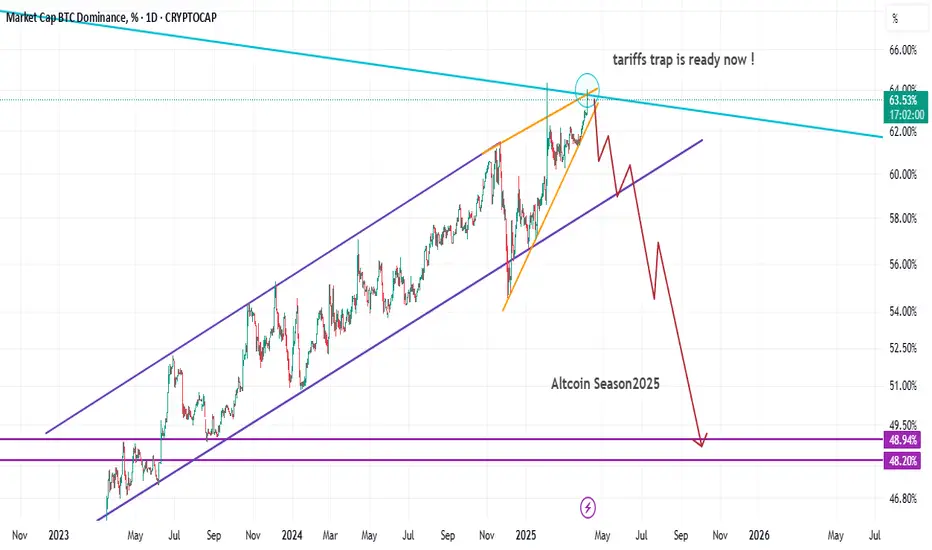
Trump’s Tariffs & the Silent Setup — Why This Could Be Bigger ?Hello Traders 🐺
I hope you enjoyed yesterday’s Black Monday 😂 because honestly, it was brutal for all investors.
But corrections like this are always necessary — and I want to talk about that in this idea with a bit more detail.
Also, I’ll update you on the current situation of BTC.D, because as I told you in my last update, the market is about to create a bear trap on the BTC.D chart.
I already shared the proof for this prediction before the dump — you can check it here:
So now, let’s talk about the economic reason behind the dump, and then I’ll go over the technical side of the chart.
This idea I’ll explain how we can use macroeconomic data in our trading decisions.
So make sure to read it carefully and see how you can apply it to your strategy ✅
Do deep corrections always mean danger?
Not necessarily.
Let’s go back and remember some of the biggest crashes in financial history —
The COVID dump or even the famous Black Monday.
If you ask yourself now, “What was the smartest move back then?”
You’ll probably say:
Buy. Accumulate. Because that was the bottom — and we never saw those prices again.
And guess what?
The current state of the market is no different.
So why do I believe Trump’s new tariff policy could actually be bullish?
Let me break it down simply for you:
🔥 The Tariff War: Why it started
For years, most countries had easy access to the U.S. consumer market — the largest in the world — with little or no tariffs.
But U.S. manufacturers didn’t enjoy the same freedom when exporting abroad — they faced heavy tariffs, while also struggling with intense competition inside their own borders due to lack of import restrictions.
So what happened?
✅ The new tariffs brought two key benefits:
1️⃣ Forced negotiations:
Other countries now have to either remove or reduce their own export tariffs to keep trading with the U.S.,
or else they lose access to a market that’s extremely consumption-driven.
2️⃣ Advantage to U.S. domestic production:
If foreign exporters lose access, U.S. producers finally get room to breathe,
and can grow competitively inside their own market.
💰 What happened after tariff fears hit?
In the past month, markets reacted with fear.
A massive amount of capital flew out of financial markets and inflation-hedged assets,
the dollar strengthened, and recession fears grew.
But here’s the twist...
What if Trump had started printing money before this shakeout?
If liquidity was still high, printing more would’ve:
Crushed the dollar
Destroyed consumer buying power
Sparked inflation again
But right now, after money has already been squeezed out of markets and the dollar is strong,
the Fed has a clean path to restart QE (quantitative easing) without tanking the dollar’s value.
So what's next?
Lower interest rates, stimulus packages, subsidies — all will likely come soon.
This time, Trump can inject liquidity exactly where he wants it to go:
Straight into U.S. industry, not into meme coins and junk assets.
With fewer export tariffs, American factories will be more competitive,
U.S. exports could rise, and the country will rely less on foreign production.
And what does this mean for the markets?
Simple.
Once the Fed pivots back to easing, markets will react violently to the upside.
So, as I always say:
Don’t waste this opportunity. Use these prices wisely.
now let's come back into the chart :
As I told you before , BTC.D now is testing the blue monthly resistance line and also hit the rising wedge upward resistance line and in my opinion there is a big chance to see a massive bull market incoming...
I hope you find this idea valuable and as always remember :
🐺 Discipline is rarely enjoyable , but almost always profitable 🐺
🐺 KIU_COIN 🐺