_Bitcoin Dominance Update
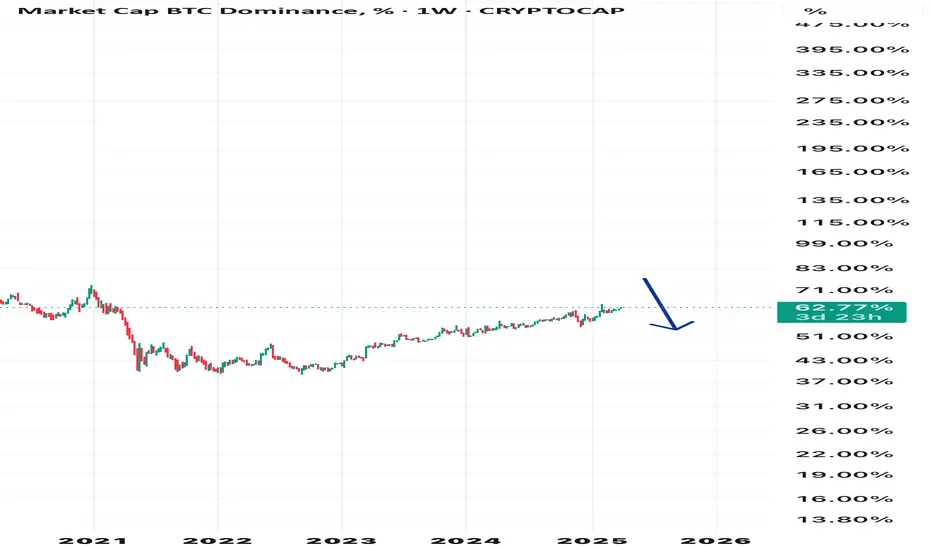
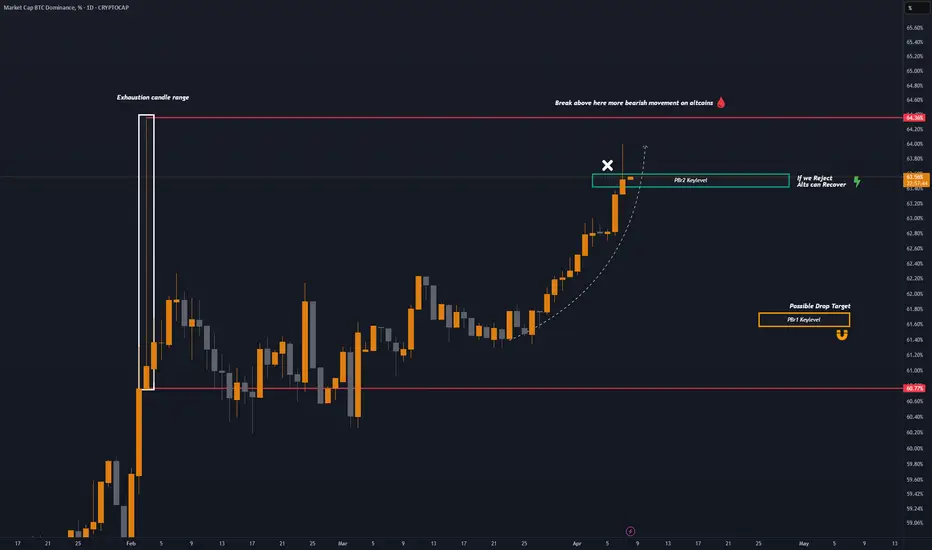
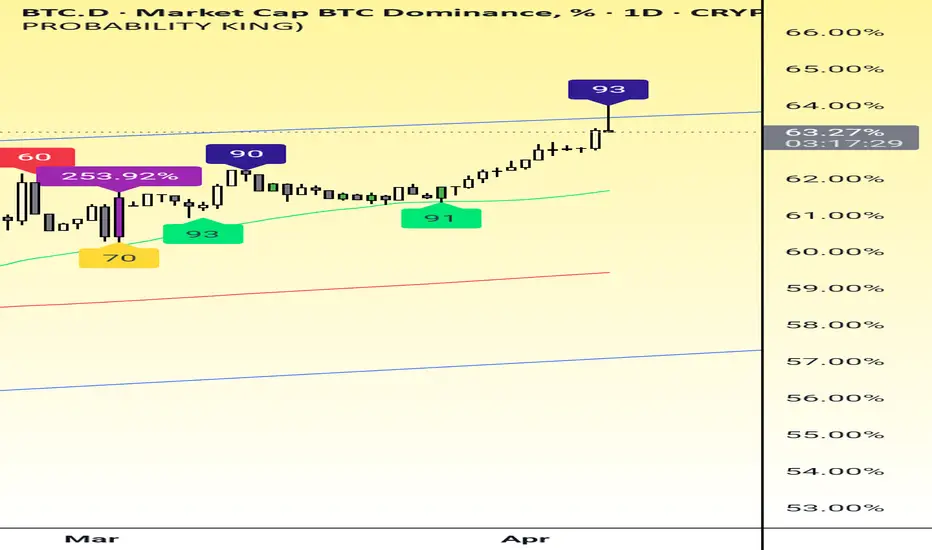
Bitcoin Dominance is now rejecting on our PBr2 panda fam, This is a good news for altcoins confluence since our altcoins is bleeding massively since the Tariff thing same time Dominance is on super bullish ⚡️
You can also see on recent movement from Feb 3 Daily candlestick we printed a strong exhaustion of candle in that range area. 👀
As long as Bitcoin Dominance is staying below PBr2 still altcoins have a chance to recover, Possible target for Dominance to drop at PBr1 below range 61.77% - 61.57% 🎯
Stay cool don't rush and keep bagging every drop sa market panda fam, Don't be part of those traders na saka na mag paplano mag bag pag nag pump na ulit ang mga altcoins. ☝🏻
BTC.D trade ideas
Will alts ever see relief.?This is really testing people’s patience as it continues to truck on up. Bullish until proven otherwise.
We all knows what happens when it tanks just be sure to take profits.
BITCOIN DOMINANCE we hit the peak of of dominance in bullrunThe dominance is rising in a channel recently we saw A new touch on Upper trend line in my opinion Maximum We see a fake out on the trend line and then the dominance is going to drop. This is the point when ALT COINS Are going to blow up You have to hold with strong hands and don’t be panic.
BTC DominanceWait dor the daily closure to print bearish candle with 93 score, if its printed the same way, we will se a short to mid term rally in ALTS.
NOT ALL ALT COUNS GONNA RALLY
Choose wisely
NFA
DYOR
XRP could flip Bitcoin again at the end of this cycle around Sepothers.d is ready to bounce after 5 red monthly candles. Just like December 2016.
while Bitcoin Dominance looks like this under Trump 2.0 trolling the economy on a much grander scale while XRP has already given us a tease of what's to come this cycle reaching a historic new ATH. And tether on the other hand, unstoppable! They are about to print so much money they could at some point flip Ethereum while Ethereum finally goes home.
Imagine if XRP and tether flip Bitcoin together (relax! it wouldn't be the 1st time. XRP did in Jan 2018 if only for a moment)
Looks promising now that Europe offered 0 to 0 tariffs. 1929 scenario could take years since dedollarization takes years to develop. (it's not going to happen overnight.)
Spring is finally here. Buy others like VeChain (the next xrp this cycle)
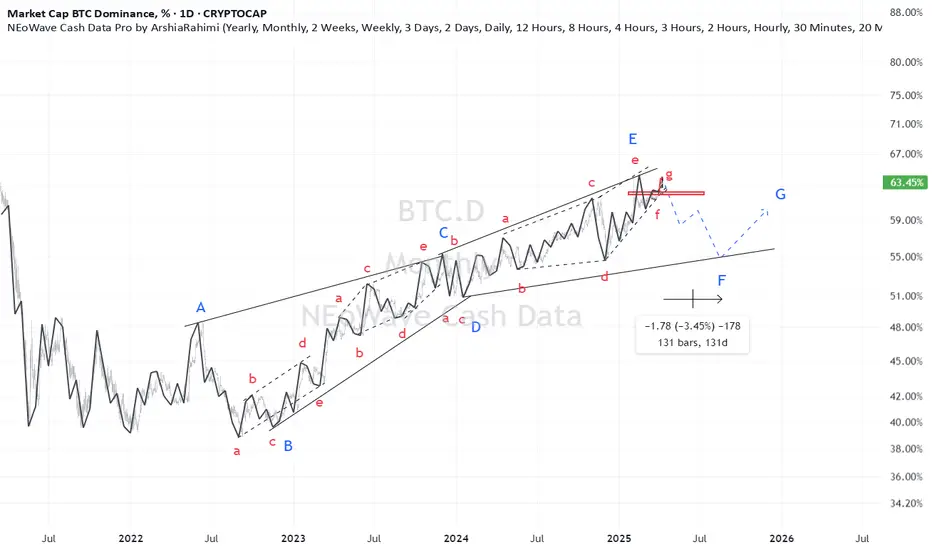
BTC.D( based on NEo wave)Bitcoin dominance is too messy for counting but I just count 2 time frames and I find out there is a little bearish wave on the way but breaking 62% confirms this.
if it happens good bullish wave can make eth over 4K
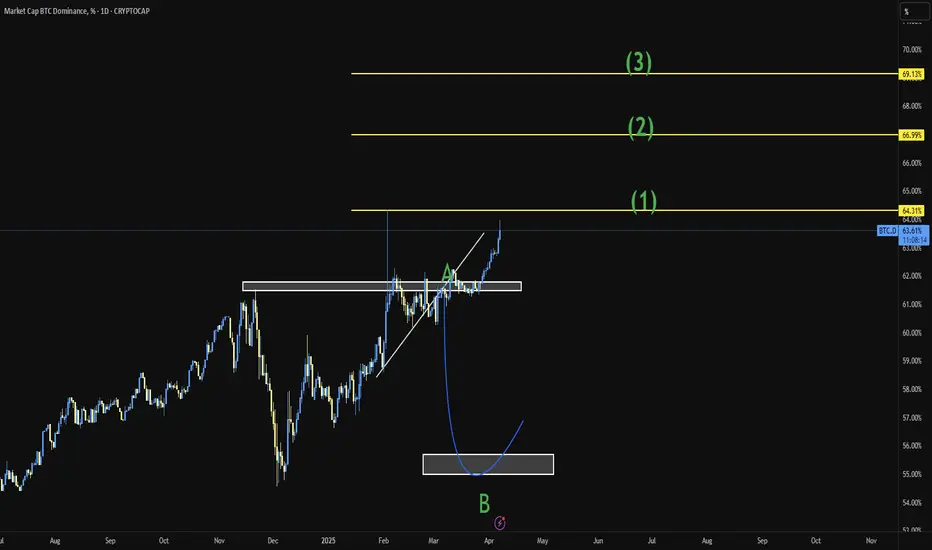
BTC.DThe Bitcoin dominance is currently at this level, and we might see higher targets. I don't anticipate a decline in Bitcoin's value. Please share your thoughts in the comments.
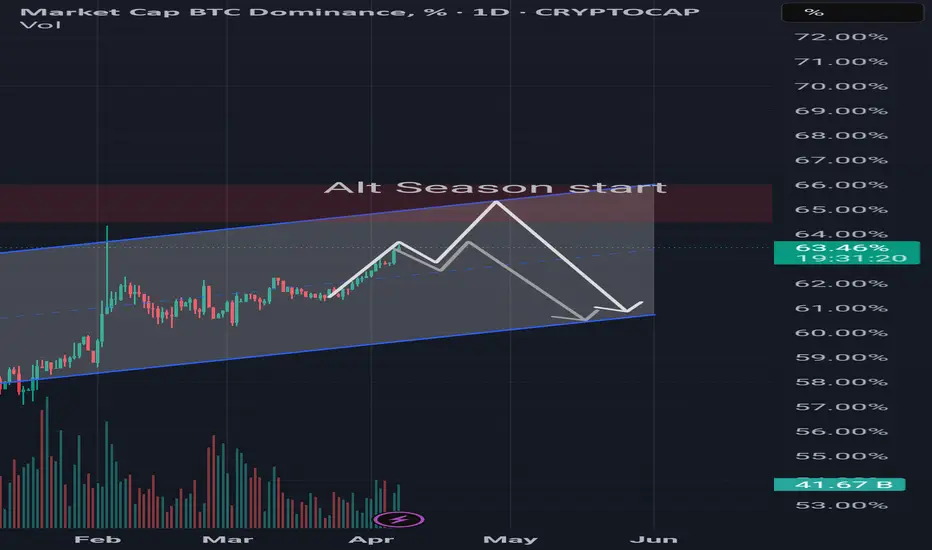
Btc.dHello, I have left you the analysis of btc.d, which promises the start of the alt season. I hope you will use it.
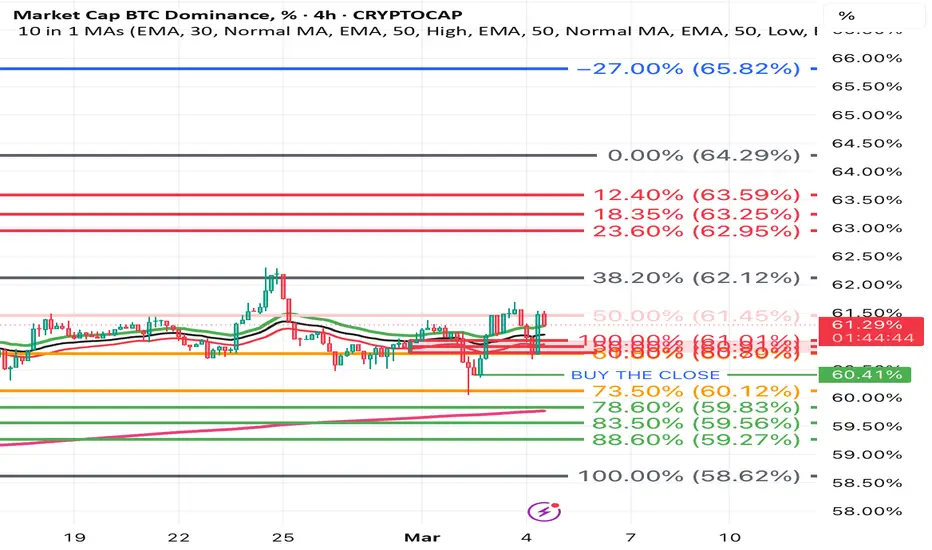
Be Very Careful crypto Traders BCTD will go upBTC.D will go back up to 63.59% so if i were anyone who trades crypto i'll hold my usdt until then its a must tha btc.d go back up before diving down be careful
BTC dominance will stay high and maybe go higher! last 2 monthly candles closed pointing at revisiting last high and I that's about to happen as bitcoin dominance is ~2% from last wick's top. Break 64.4% and it can go from 65.5 to 69%. Meaning altcoins will probably bleed bad! Wait for bottom and buy crypto!
Monthly chart confirms
BTC.D Breakdown here, alt recovery soon?BTC.D Breakdown here, alt recovery soon or will we follow BTC down to valhalla? Is it unhealthy for me to use fibs on everything?
BTC dominance I thought BTC .D would have went down by now
Definitely was wrong
Last week.
I can’t make sense of it but dominance I on a steady path!
Just not slowing down at all
Hopefully for some change because
It hasn’t seen a real turn around since November-December that was all the pump it had.
Really that’s the only significant drop it has since it bottom a few years ago.
Alts need some kinda relief.
If that doesn’t come soon.
Much more pain will be here to stay.
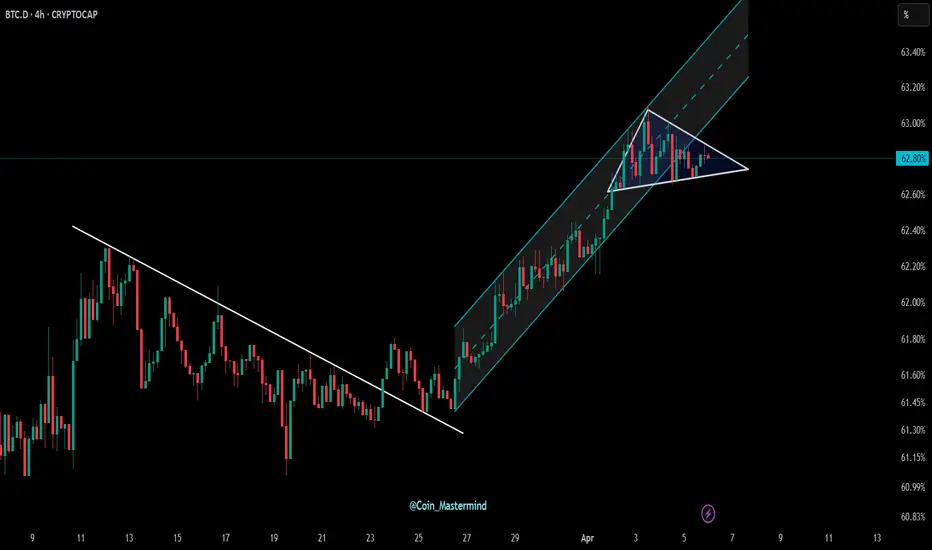
Bitcoin Dominance at a Crossroads – Big Move Ahead?🚀 BTC.D 4H Update!
📊 Market Structure Signals:
🔹 Falling Wedge breakout confirmed—BTC dominance spiked!
🔹 Ascending Channel breakdown—key support under pressure.
🔹 Symmetrical Triangle tightening—volatility loading!
⚡ What’s Next?
📈 If BTC.D surges higher, altcoins may struggle as capital flows into BTC.
📉 A BTC.D drop could spark an altcoin rally as funds rotate into alts!
🚨 The triangle breakout will decide the trend—stay ready! 👀🔥
Dominance getting weakerChart getting weaker, looks like that Alts will make a bigger push then Bitcoin in the coming pump
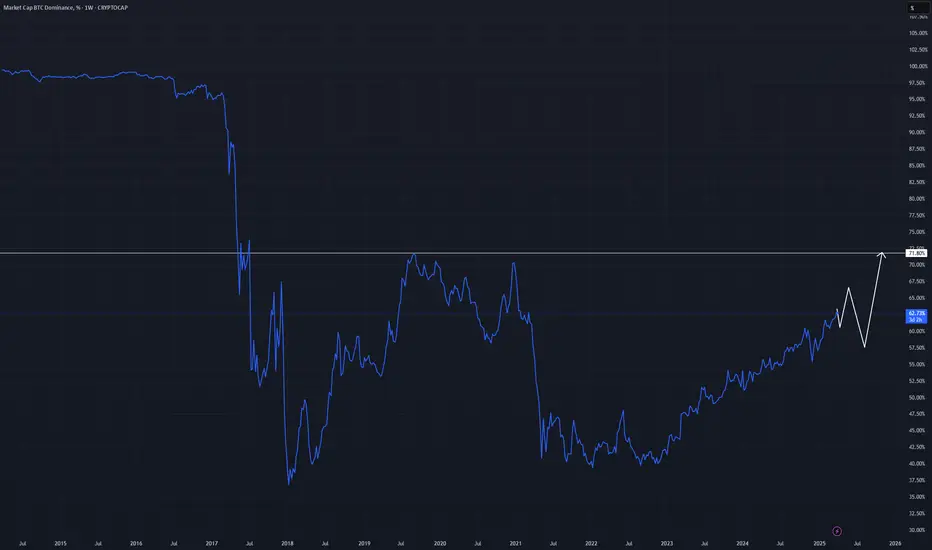
I show my expectations for BTC.DThe asset will reach the target of 71.8%, which is the final peak before the reversal.
(Not an investment recommendation)
" Don't Get Fooled! "Hello Traders 🐺
In this idea, I’ve got some shocking news for you my friends.
So maybe right now you're asking yourself:
"Am I getting bearish on Alts? Or are things still the same?"
Let me break it down for you:
As you might know, there are different scenarios that affect whether BTC Dominance (BTC.D) goes up or down. And I want to make it super clear, so you really understand how the market actually works 👇
1️⃣ BTC Pumps – Alts Drop (BTC.D 🚀)
In this case, we’ll see a brutal pump in BTC.D.
Why?
BTC.D shows how much of the total crypto liquidity is allocated to BTC itself. So when BTC pumps, naturally it grabs a bigger share of the market.
And when Alts start shaking, money flows out of them and into BTC.
2️⃣ BTC Dumps – Alts Crash Even Harder (BTC.D 🚀)
When the overall market is bearish, BTC.D still grows, because during Bitcoin crashes, Altcoins suffer way more.
Example? BTC corrects 10%, and Alts go through a full bloodbath.
3️⃣ BTC.D Sideways – Alts Start Pumping (BTC.D 👇)
Here, we see BTC consolidating or slightly correcting, and in the meantime, money starts flowing into Alts.
That’s when BTC.D starts to fall hard.
4️⃣ Bull Market Madness – Alts Go Wild (BTC.D 👇)
In this phase, BTC.D crashes hard, and Alts go parabolic.
This is typically the final phase of a bull run.
But where are we now?
Over the past 2 years, we saw BTC pump, while most Alts underperformed massively.
Even in USD terms, many Alts are still far from their ATH. And against BTC?
Total disaster. 😬
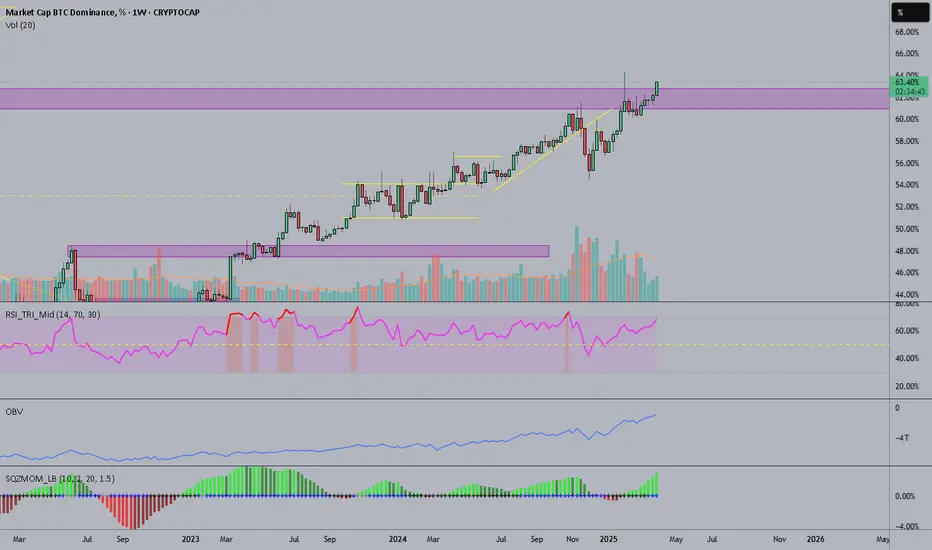
Now, if you look at the monthly BTC.D chart, RSI is printing a new all-time high, and it’s getting very close to the 70 level, which usually means overbought.
Also, BTC.D historically tends to form a double top in RSI before it starts to correct—and as we speak, it’s trying to form that exact same structure.
So be careful! Don’t let the big players fool you into selling your Alts too early.
On the daily chart:
BTC.D is currently inside a rising wedge pattern, which is a bearish setup.
It’s now getting very close to the blue resistance line, which is a monthly resistance.
Last time it touched this area, we saw a strong rejection with a big wick.
Final Thought:
This time, as BTC starts to grow, we might see a bit of lag in Alts.
But when BTC.D reaches its limit,
get ready for a massive explosion in Altcoin prices. 💣
I hope you enjoyed this idea!
Make sure to like and follow for more support — and as always:
🐺 Discipline is rarely enjoyable, but almost always profitable 🐺
🐺 KIU_COIN 🐺

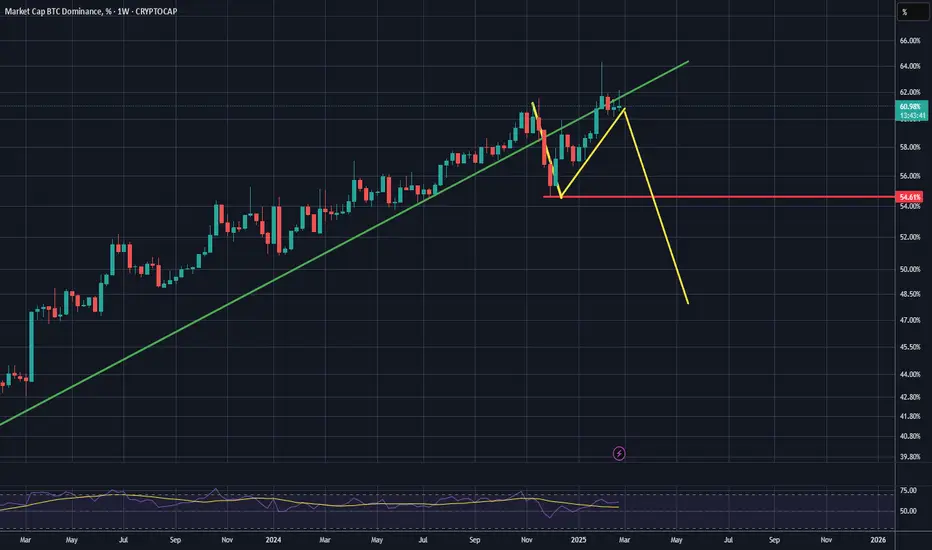
BTC.D about to dropBTC.D weekly upward trend has broken down. It’s currently testing previous support as resistance, once its finished testing the resistance it will crash. IMO, ALT season could start any day now.
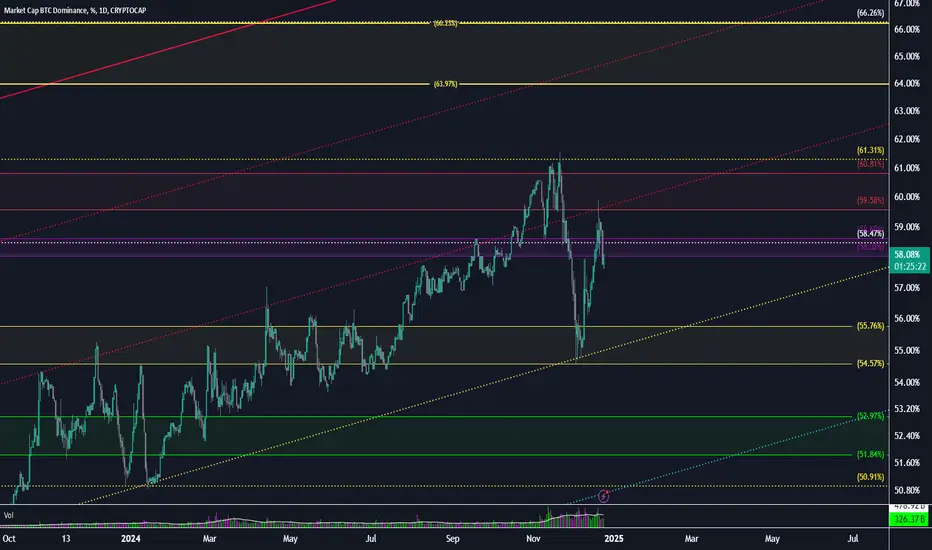
BTC.D When ALT season?BTC Dominance (BTC.D) – Updated Technical Outlook
The BTC Dominance chart reflects Bitcoin's performance relative to the altcoin market. Here’s an analysis:
Key Levels and Observations:
1. Resistance at 58.47% and 61.31%:
- BTC.D attempted to breach the 58.47% resistance but faced rejection, leading to a pullback.
- The 61.31% level, marked as a key Fibonacci retracement, remains a significant hurdle for further upside momentum.
2. Support at 55.76% and 54.57%:
- The first notable support lies around 55.76%, aligning with a historical horizontal support zone and the yellow trendline.
- If this level is breached, the next support at 54.57% may come into play, potentially leading to increased altcoin strength.
3. Trendlines and Channels:
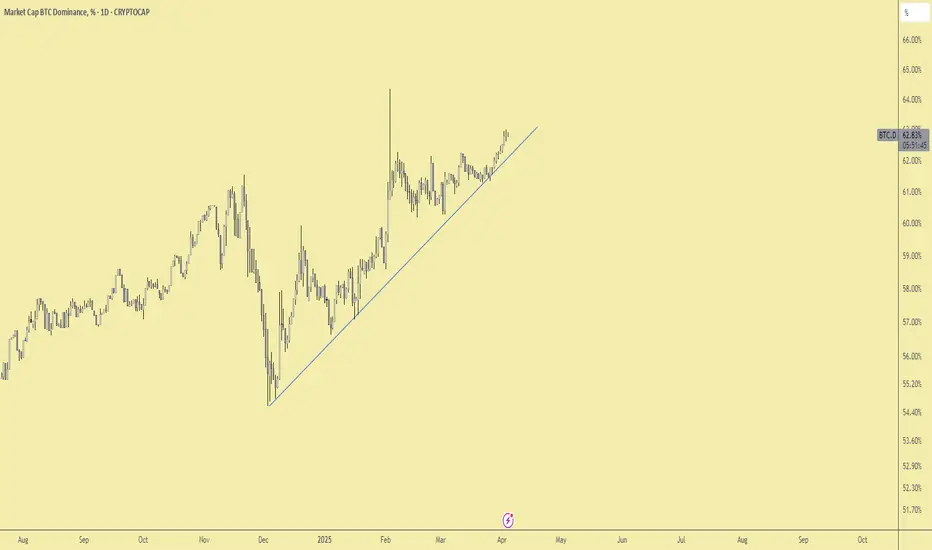
- BTC.D continues to respect the rising yellow trendline, indicating that the long-term bullish trend is intact.
- The dotted red channel lines act as a dynamic resistance zone for future attempts to reclaim dominance above 60%.
4. Volume Trends:
- Volume levels show declining momentum during the recent pullback, which could indicate temporary weakness rather than a full reversal.
- A volume breakout above 58.47% would confirm renewed dominance for Bitcoin.
5. Long-Term Perspective:
- BTC.D has maintained a higher-high, higher-low structure, suggesting bullish market sentiment for Bitcoin dominance over the medium term.
- However, consolidation between the 55.76% and 58.47% range could signal indecision before the next significant move.
Potential Scenarios to Watch:
1. Bullish Scenario:
- A breakout above the 58.47% resistance would open the door for BTC.D to challenge the 61.31% level.
- Sustained dominance above 61.31% would likely indicate Bitcoin outperforming altcoins across the board.
2. Bearish Scenario:
- If BTC.D loses the 55.76% support and breaks below the rising trendline, it could shift momentum in favor of altcoins.
- Key downside targets would then include 54.57% and the stronger support zone at 52.97%.
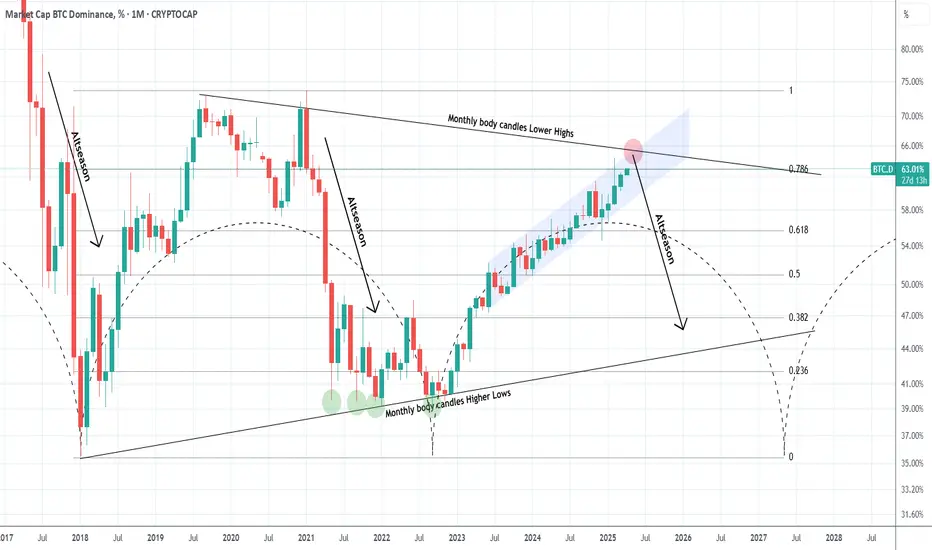
Is BTC Dominance about to reverse and start an Altseason?Well its undoubtedly what the crypto investor wants and what the market would have technically given in February if it wasn't for the tariffs trade war. Bitcoin's Dominance (BTC.D) is trading within a Triangle and February's test of the 0.786 Fibonacci retracement level was the technical level that should have given a rejection.
That rejection technically starts the Altseason which was dominant via a Bearish Leg both in 2017 and 2021. So far though both February's and March's 1M candles closed below the 0.786 Fib and April has an opportunity to even test the monthly body candles Lower Highs, which is the top of the Triangle. This is the last level that a rejection can be technically given.
Can this start an Altseason?
-------------------------------------------------------------------------------
** Please LIKE 👍, FOLLOW ✅, SHARE 🙌 and COMMENT ✍ if you enjoy this idea! Also share your ideas and charts in the comments section below! This is best way to keep it relevant, support us, keep the content here free and allow the idea to reach as many people as possible. **
-------------------------------------------------------------------------------
💸💸💸💸💸💸
👇 👇 👇 👇 👇 👇
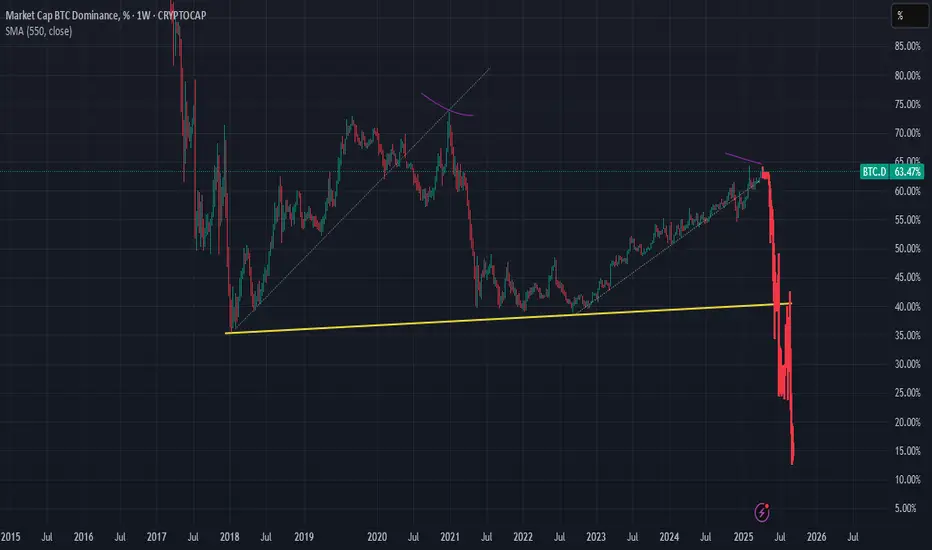
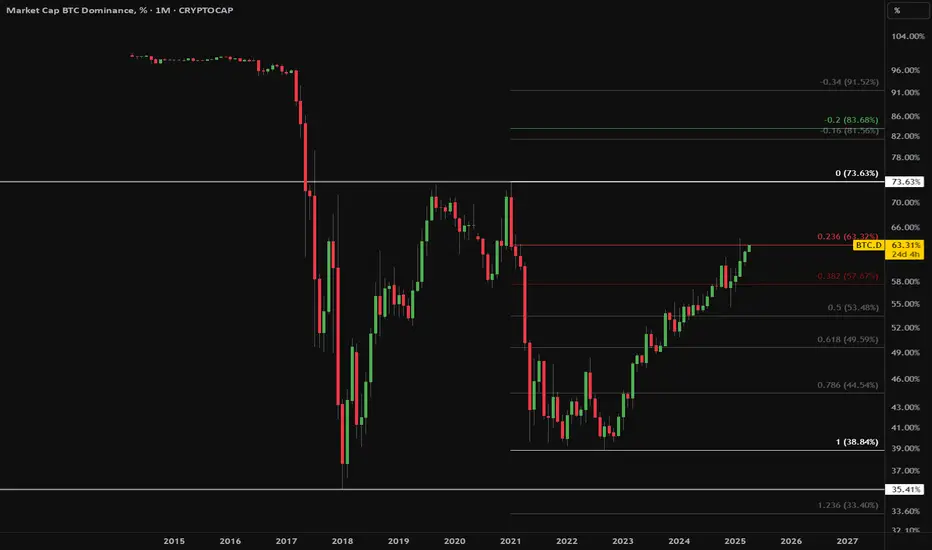
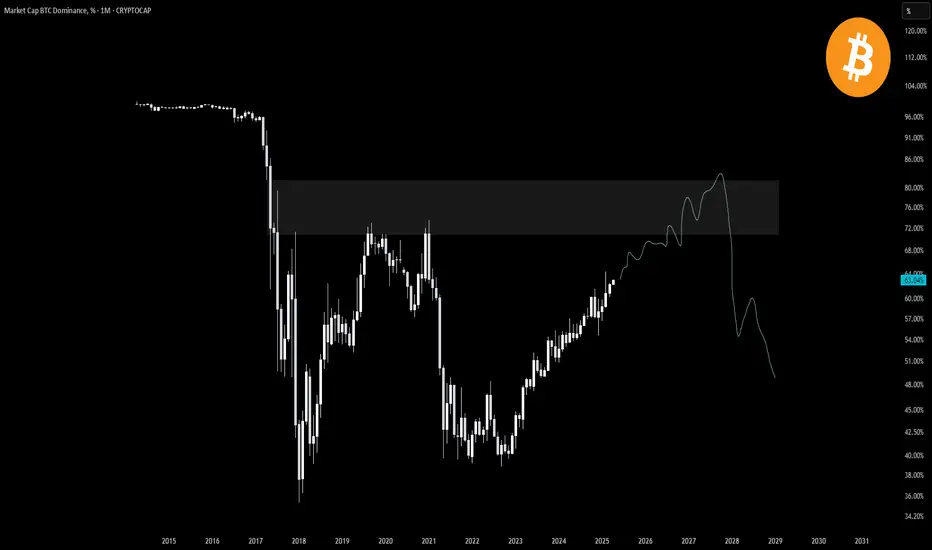
BTC Dominance Monthly Chart🪙BTC Dominance Monthly Chart
It seems like it will still take a long time for altcoins to potentially recover.
BTC DOMINANCE in Rising wedge Pattern BTC Dominance Showing Signs of Weakness – Altseason Incoming?
BTC dominance is finally topping out, displaying clear signs of weakness. Rising wedge Pattern forming on weekly time frame which is also bearish. Despite reaching new highs, momentum appears to be fading, with bearish RSI divergence further confirming the exhaustion. All indicators point towards an imminent breakdown in BTC dominance, potentially triggering a long-awaited Altseason in the coming days. Stay prepared for major moves in the altcoin market!
1. Weakness in the uptrend =Bearish
2. Rising wedge Pattern = Bearish
3. RSI divergence on weekly = Bearish
All things indicating towards upcoming Bearish trend for BTC Dominance.
What do you think share your thoughts in the comments.
🚀 🚀 🚀 🚀
This is not a Financial Advise

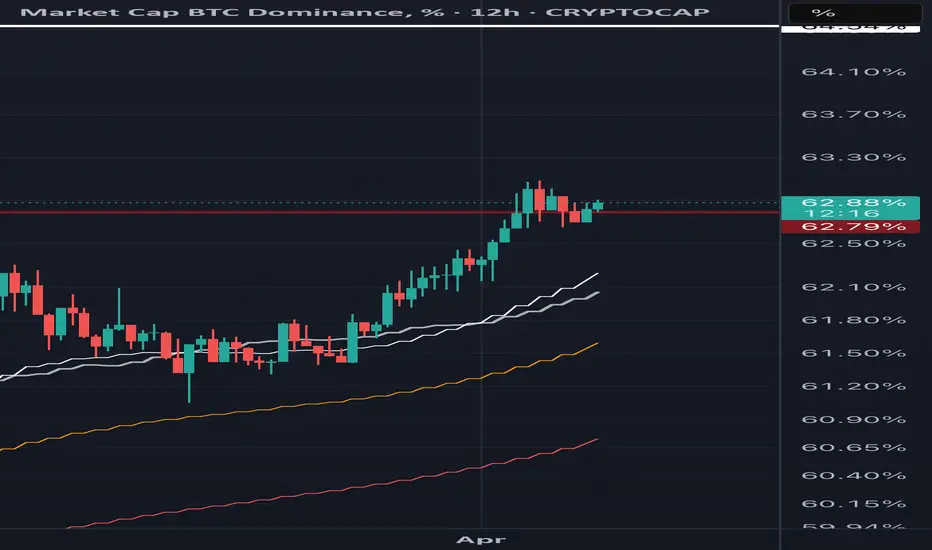
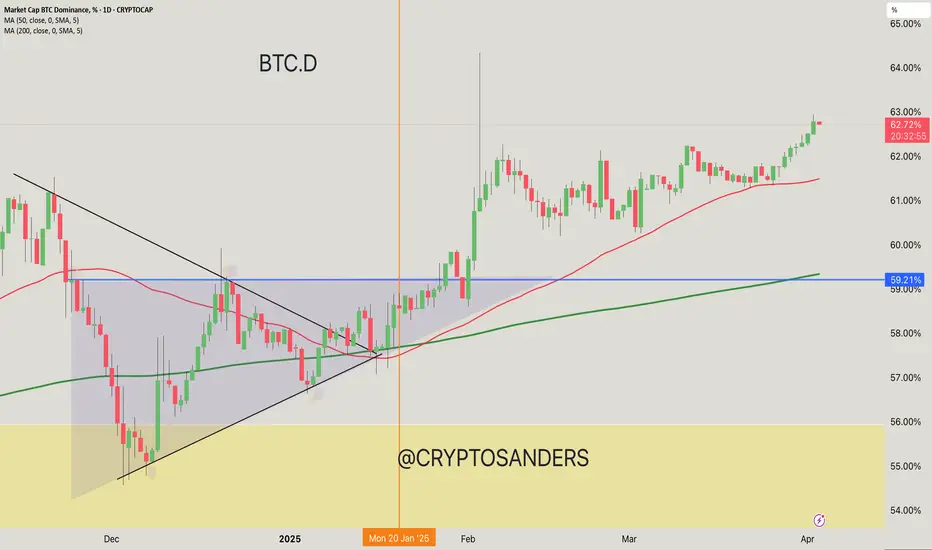
BTC Dominance Chart Analysis. 50-day MA: 61.94% (Notable Support Level)
200-day MA: 59.21% (Strong Support)
Trend: The chart shows a bullish trend in BTC dominance since the beginning of the year, with higher lows forming.
Resistance Level: A key resistance area lies around 63%, which the price is currently testing.
Support Level: The 50-day and 200-day moving averages provide solid support below current levels.
Update Points
Short-term outlook: If BTC dominance stays above 62%, it could reach 63% resistance.
Long-term indicators: Continued support at the moving averages suggests bullish sentiment if BTC can maintain its position.
Market Conditions: Monitor fluctuations in altcoin performance, which could impact BTC's dominance positively or negatively.
If you found this analysis helpful, hit the Like button and share your thoughts or questions in the comments below. Your feedback matters!
Thanks for your support!
DYOR. NFA
Update BTC D I was hoping to find a loophole for Bitcoin's takeover in the next few days, but I believe we have three months of dominance ahead of us, and I don't know if the currency will fall further or maintain its support. It seems that dominance is rising to the 73% level, after which the bull run will begin.
So, be patient over the next three months.