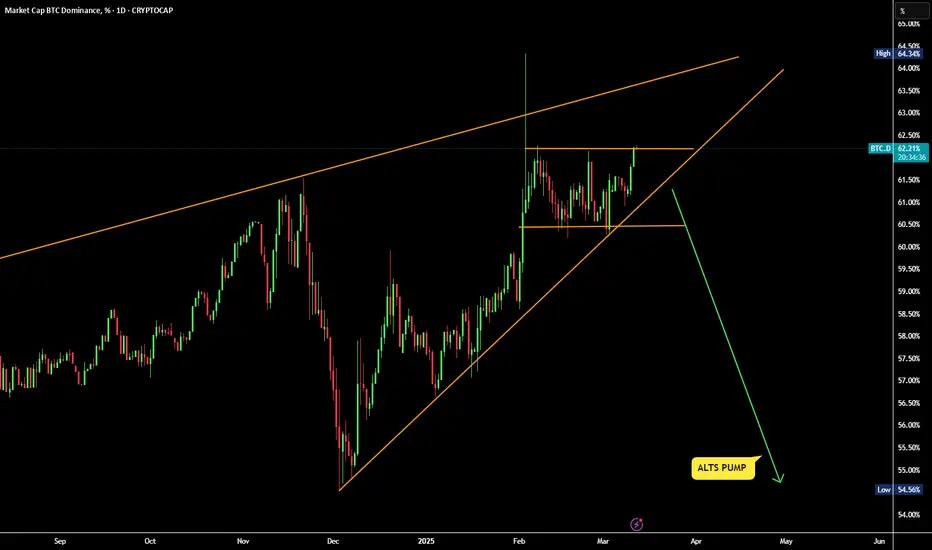
BTC.DBTC.d lost weekly support last year and price just came back to clear out that top zone. Looks like we have a DT in play. Weekly bear divergence too. Were close.... so close to altseason
BTC.D trade ideas
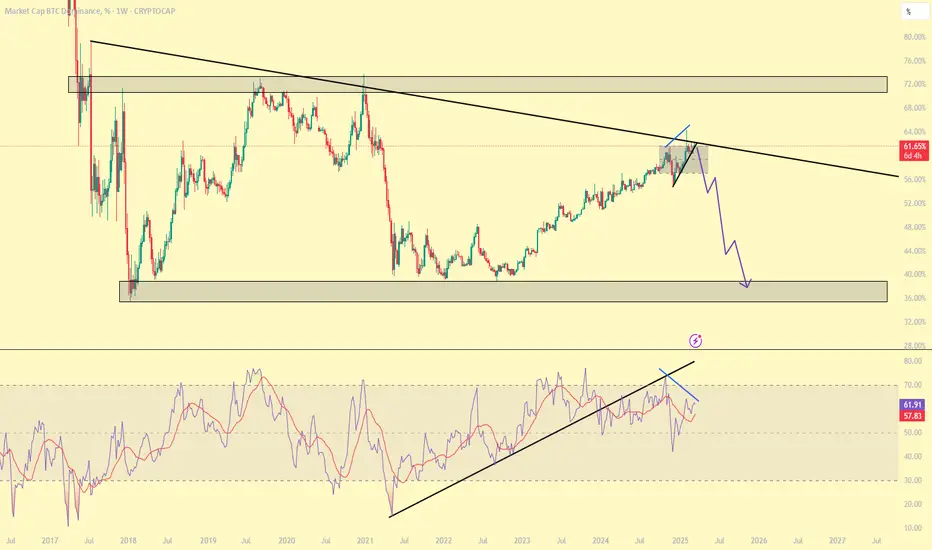
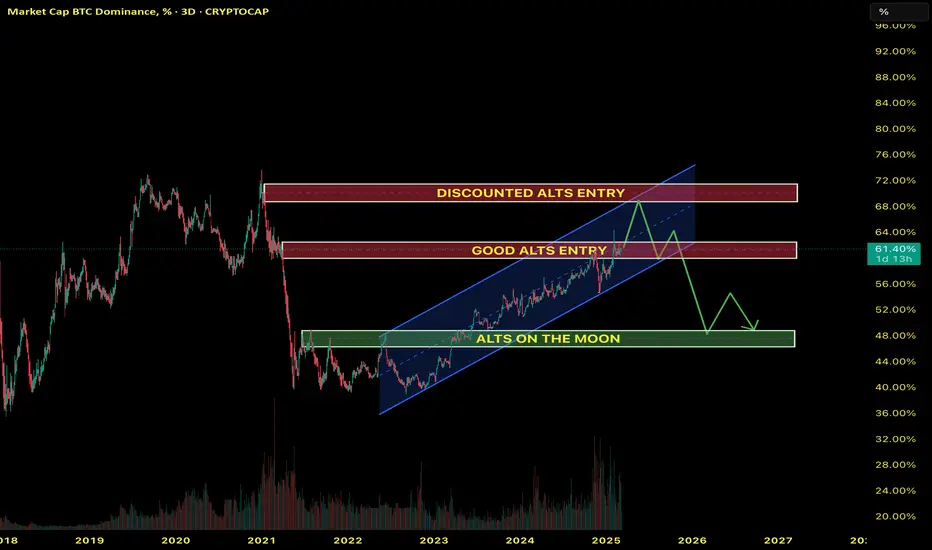
Altcoin season will be in november or december70% is our resistance (2020/2021) and the price is moving in a parallel channel
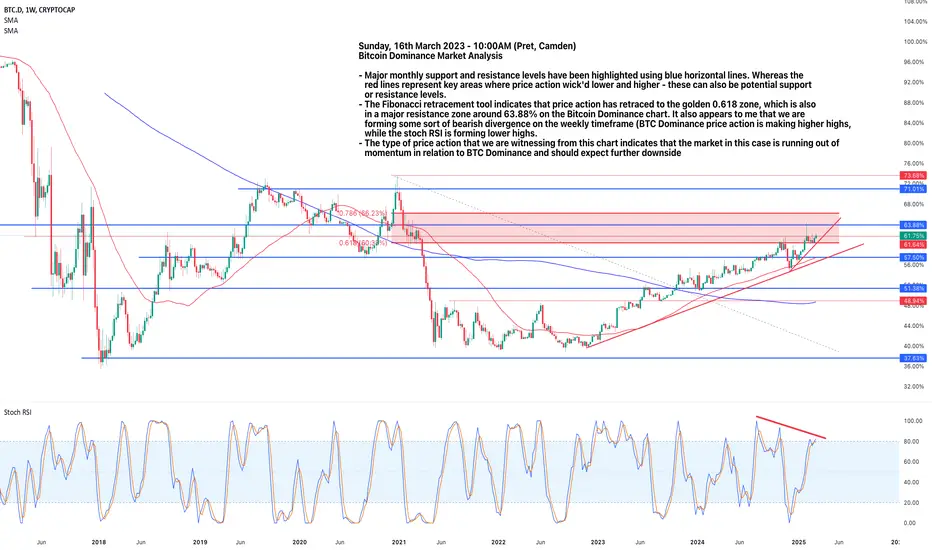
Bitcoin Dominance Weekend AnalysisBTC Dominance appears to be approaching major resistance levels, which seems to also coincide with the Fibonacci 0.618 golden retracement zone. I have also noticed some minor
bearish divergence on the weekly timeframe, which could indicate a reversal of BTC dominance, and in-turn a potential incoming rally for BTC.
BTC.D Is About to Collapse ( Altcoin Season 2025 Is Loading... )Hello Traders! 🐺
In this idea, I want to warn you about what’s coming in the market over the next couple of months.
I’ve talked about Altcoin Season many times before, but this time—it’s your final chance to get in and enjoy the ride! 🚀
But why am I saying this? Let’s break it down! 👇🔥
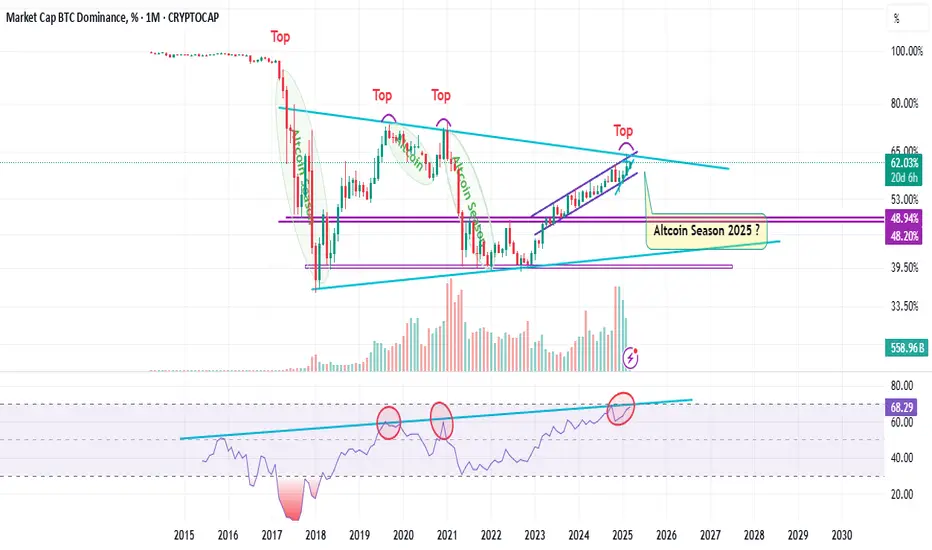
As you can see in the chart, we’ve had three Altcoin Seasons so far.
Each time RSI hit the upward resistance line, we saw a top in the BTC.D chart—and here’s the interesting part:
👉 This time, we’ve reached resistance on both the RSI and BTC.D charts!
👉 Plus, there’s a bearish divergence on the weekly chart.
In my opinion, this is a massive bearish signal for BTC.D and an extremely bullish setup for Altcoins! 🚀🔥
Also, the Fear & Greed Index is currently around 15! 📉
In my opinion, this level is typically seen at bear market lows, not during a bull market. However, here’s the key point:
👉 Altcoins are already in a bear market, while BTC itself is in a bull market. This is completely normal and explains why BTC.D is sitting around 62%!
I hope you found this idea valuable! Don’t forget to like and follow for more insights. 🚀🔥
🐺 KIU_COIN 🐺
Altcoin Season? Never Again?🚀 Did we see true altcoin euphoria that triggered the bear market this cycle? I don’t think so.
📉 Historically, bull markets end when confidence reaches irrational levels—when the market completely shifts from BTC into alts, believing it’s a "new paradigm." That’s when euphoria peaks, and the bear market begins.
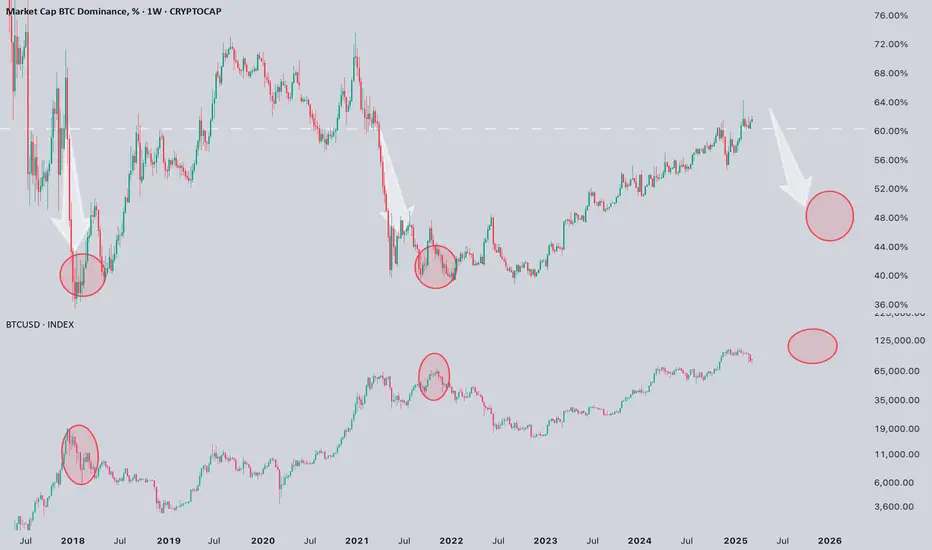
📊 Right now, BTC dominance is approaching 65%, and if we exclude stablecoins, it’s nearing 70%. Yes, cycles have evolved—now we have meme coin seasons triggering short-term hype and corrections—but overall, the market is still in a strong risk-off phase.
💡 What does this mean? The final altcoin run that historically precedes a bear market likely hasn’t happened yet. With a high probability, we’ll see it this year.
🛠️ Many altcoins are sitting at local lows, making it a good time to use the right tools to pick the strongest projects before the next move.
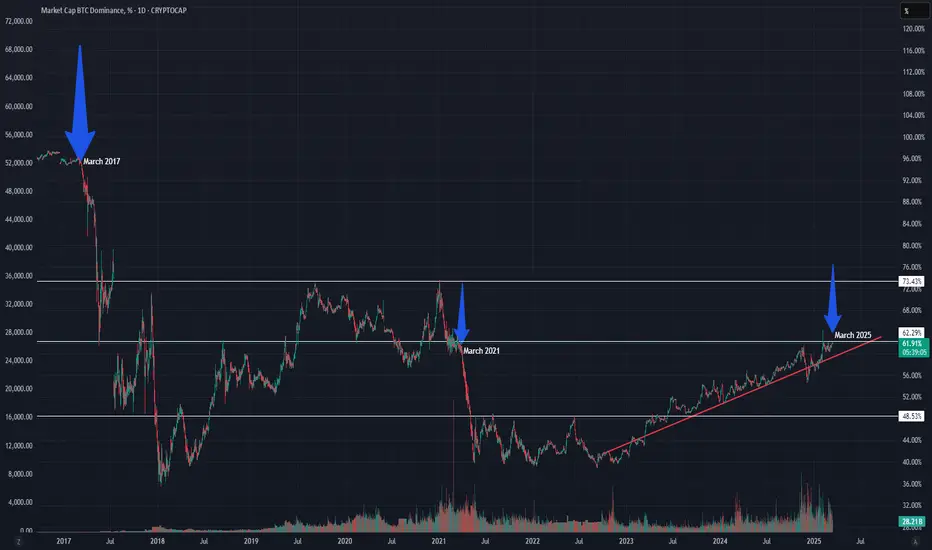
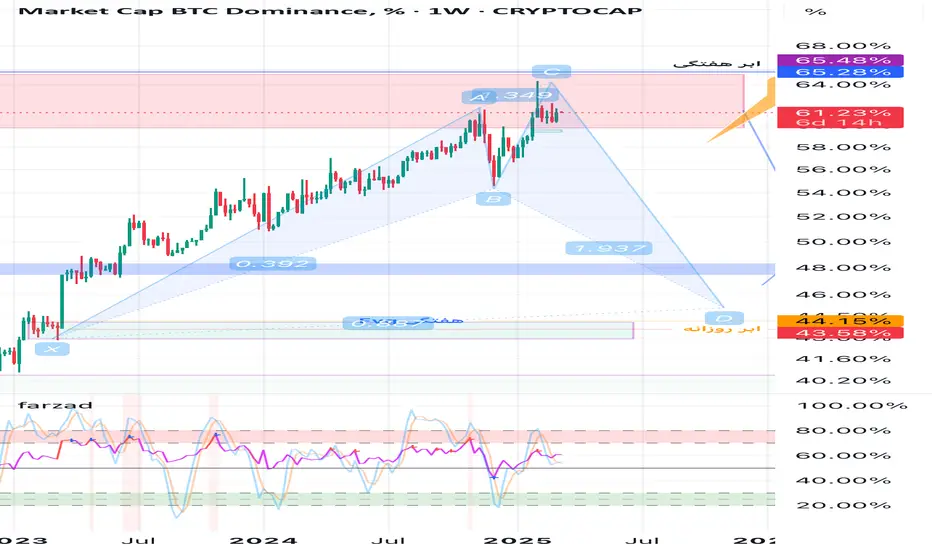
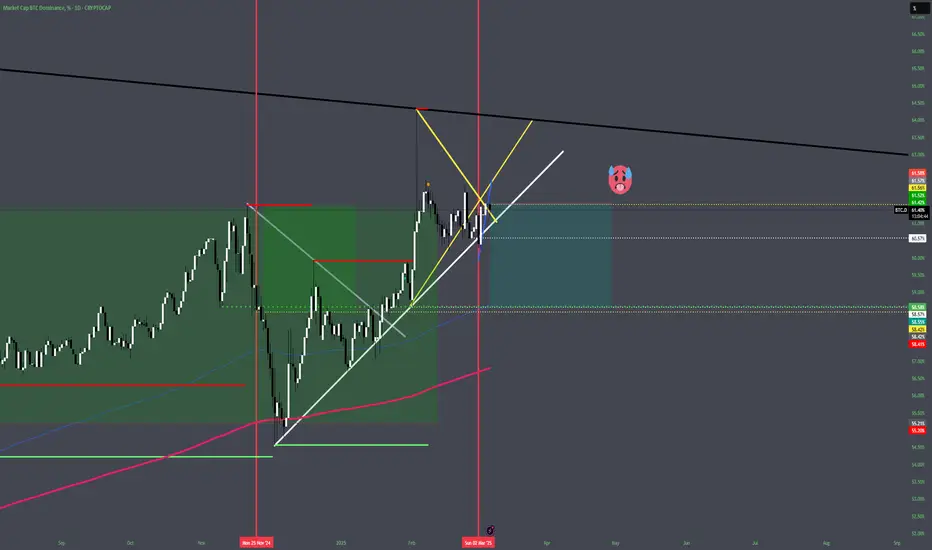
Bitcoin Dominance (March of prior 2 cycles)Both in March of 2017 and March of 2021 we saw bitcoin dominance breaking down.
Will we start to see it again this month (March 2025)?
Possible it keeps marching upwards but some hopium for alt season.
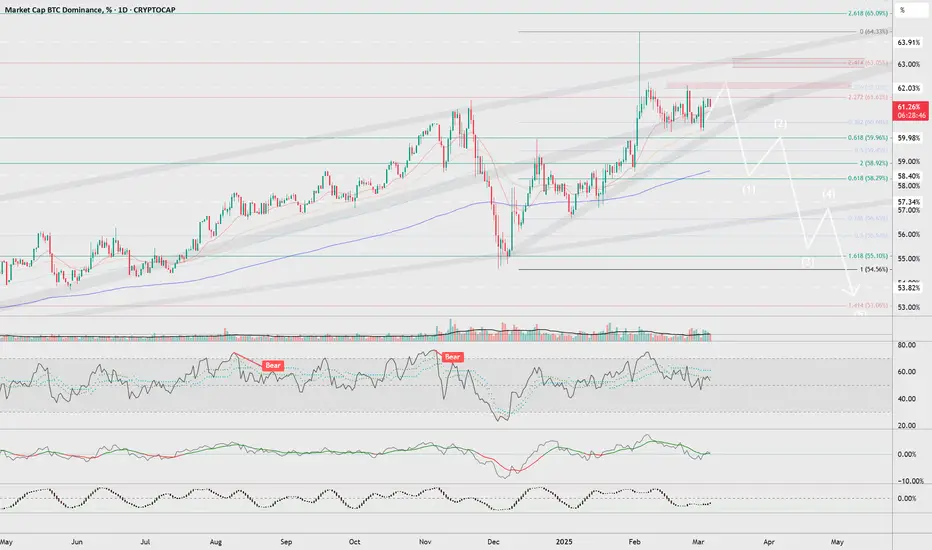
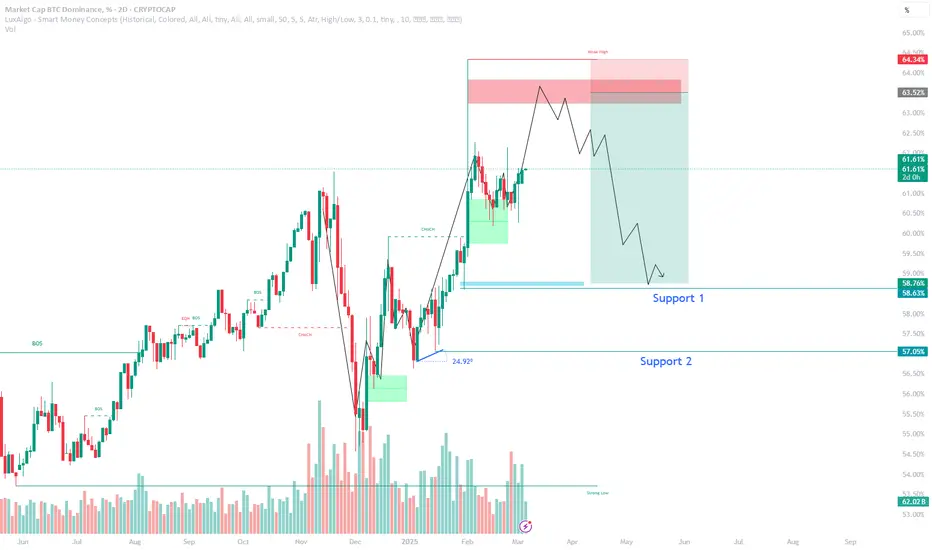
Bitcoin Dominance (BTC.D) OutlookKey Support Holding Strong
Over the past six weeks, the 60% level on the BTC.D chart has acted as strong support, preventing further downside.
Bitcoin dominance now appears to be climbing, with a potential move toward the 66%-72% resistance zone in the coming weeks.
Potential Market Implications
A rise in BTC.D typically signals weakness in the altcoin market, as capital shifts away from riskier assets into Bitcoin.
If BTC.D reaches and rejects the 66%-72% resistance, it could trigger an altcoin recovery, similar to what happened in January 2021, when a rejection in this zone led to a massive altcoin rally.
Key Levels to Watch
Support: 60% (holding for 6 weeks)
Resistance: 66%-72% (historical rejection zone)
A break above 72% could suggest continued Bitcoin dominance, delaying any significant altcoin resurgence.
Conversely, a rejection at 66%-72% could mark the beginning of an altcoin season, as liquidity rotates back into alternative assets.
Conclusion
Short-term: BTC.D appears bullish, with altcoins under pressure as dominance climbs.
Mid-to-long term: The 66%-72% resistance zone will be pivotal—a rejection could reignite the altcoin market, while a breakout would strengthen Bitcoin’s dominance even further.
Bitcoin Dominance Says That Bear Market Is Almost Over For Alts!Hello, Skyrexians!
We hope you enjoy our yesterday Bitcoin analysis which is now playing out. Daily candle closed great, but this reversal is still unconfirmed. So, we are still in danger. Today we will take a look at the CRYPTOCAP:BTC.D again, this chart is annoying, but is finally approaching its reversal point.
Let's take a look at the weekly time frame. Here we can see the 3 red dots on the Bullish/Bearish Reversal Bar Indicator . Now we will try to learn now to ignore the false signals. The first dot formed on the very weak bar with no angulation with Alligator. We can's use this. The next bar was great, but it was just the wave 3. The best signal is the last one. We have angulation, bearish divergence with AO and the potential wave 5. This reversal has been confirmed.
Expect the reversal from the current percent because price is inside the Fibonacci 0.61, or in the worst case earlier mentioned 66%. This is going to be wave 5 in 5.
Best regards,
Skyrexio Team
___________________________________________________________
Please, boost this article and subscribe our page if you like analysis!

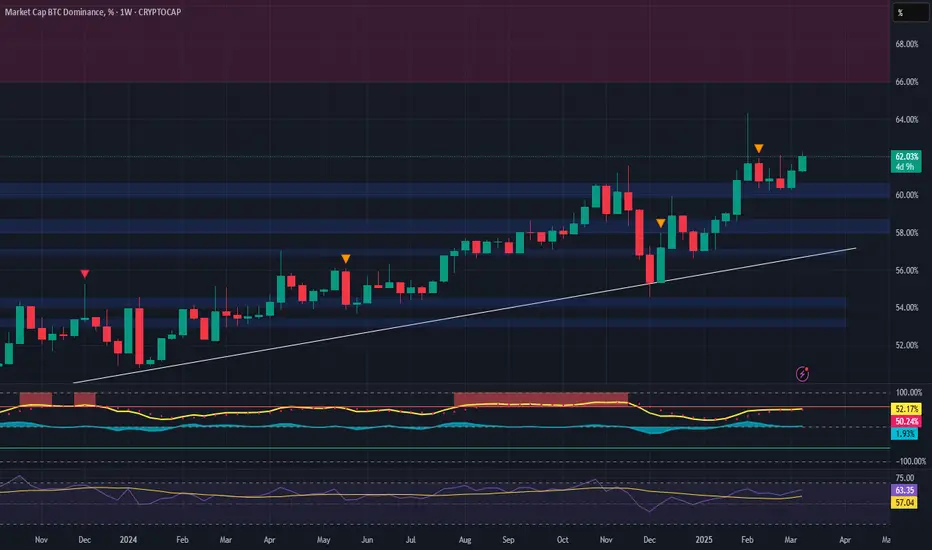
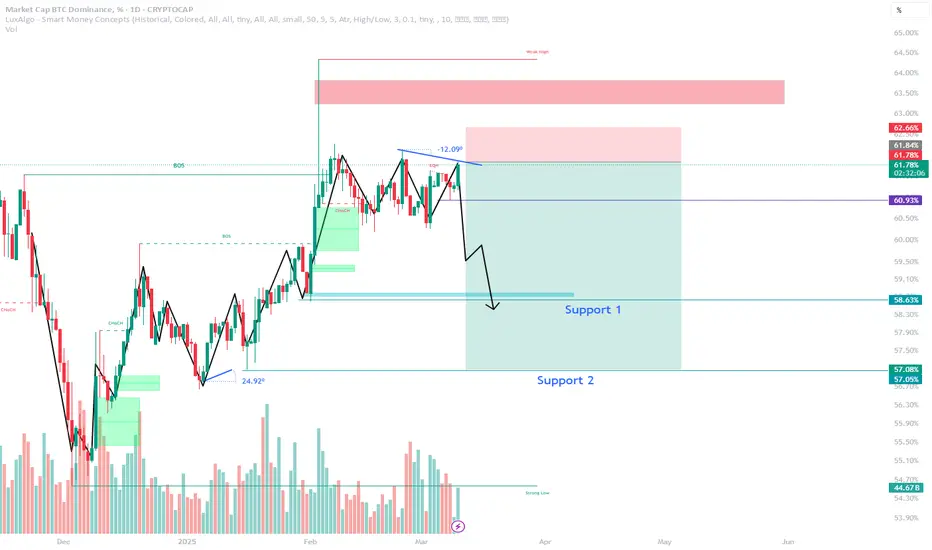
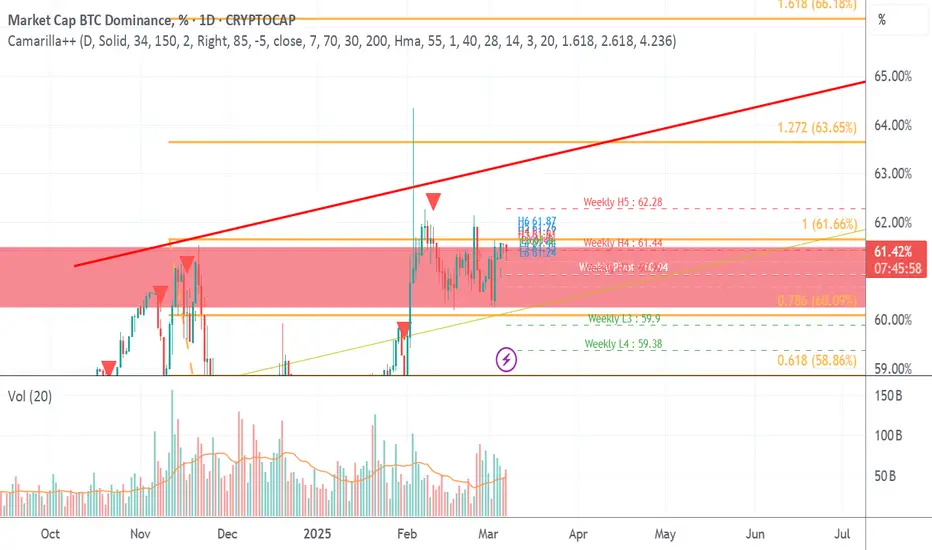
Bitcoin Dominance (BTC.D) Technical Analysis – March 12, 2025
Trend Overview:
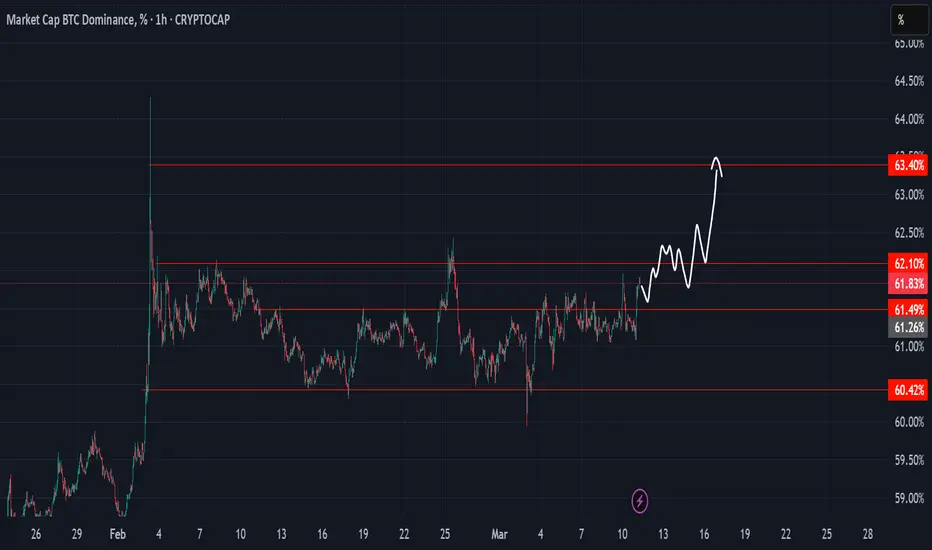
- BTC dominance is currently at 62.18%, approaching a critical resistance level.
- BTC dominance has been in an uptrend since early 2024, indicating that Bitcoin has outperformed altcoins during this period.
Key Levels to Watch:👁👁
- Resistance: ~62.5% (horizontal resistance level)
- Support: ~60% (previous breakout zone)
-Major Breakdown Target: ~54.5% (potential altseason trigger)
Technical Indicators & Patterns:⚖️
1. A breakdown below 60% would confirm a bearish trend for BTC dominance and lead to an altcoin pump.
2. In late 2024, BTC dominance rejected at a similar level (~61%), followed by a sharp decline. The same pattern may repeat, leading to altcoins outperforming BTC.
3. If BTC dominance breaks above 62.5%, it could extend towards 64-65%, delaying an altseason.
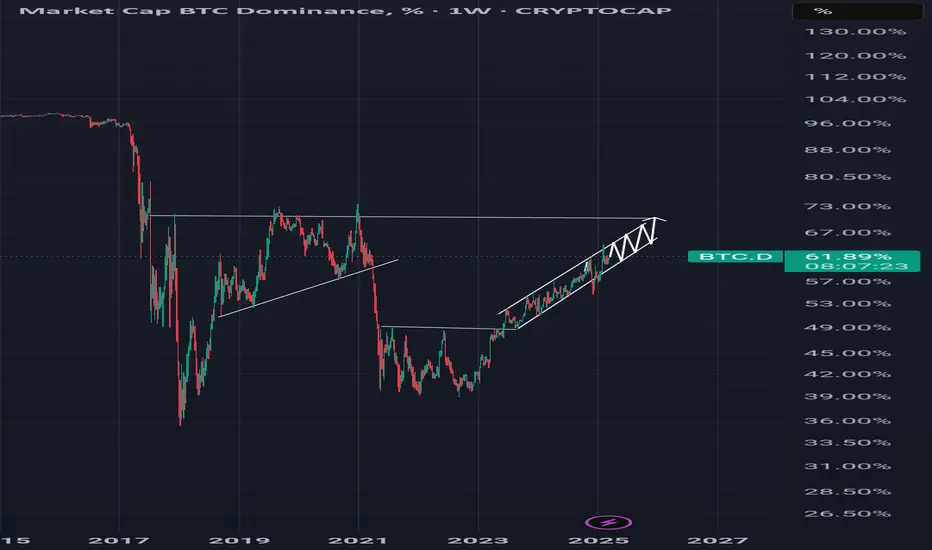
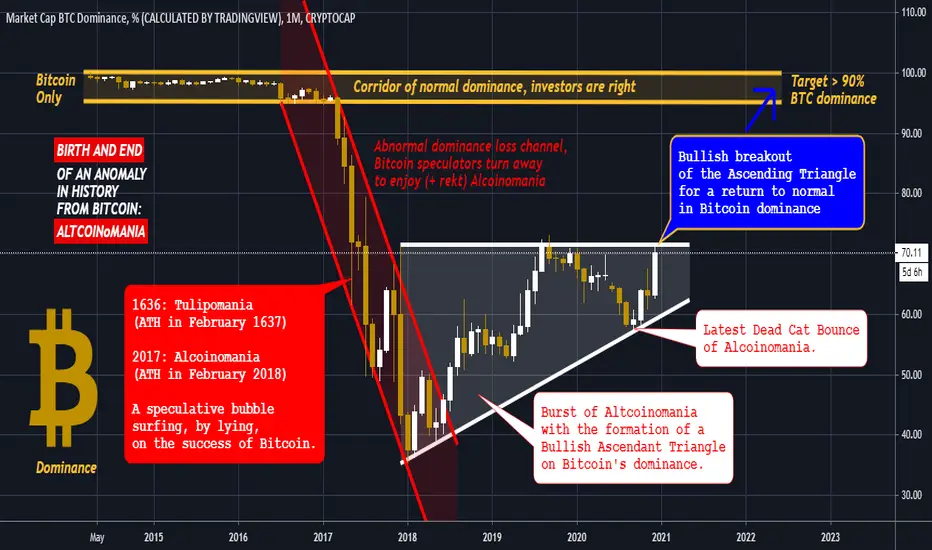
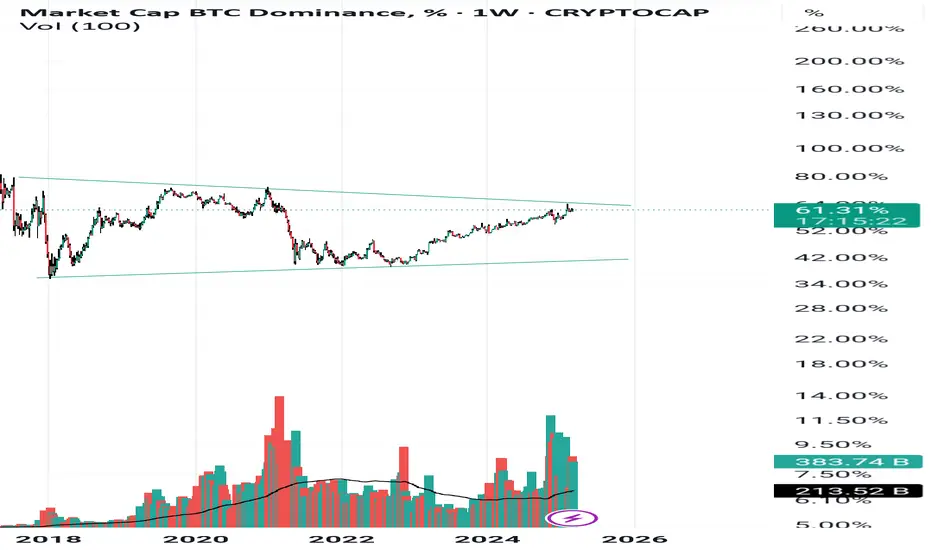
Alcoinomania and Bitcoin DominanceThe Bitcoin dominance, until then close to 100%, took off the road in 2017 with real Tulipomania, sorry, I meant: Altcoinomania.
I don't invent this burlesque qualifier of Alcoinomania by chance!
It was indeed a very intense and short-lived speculative bubble ...
... like Tulipomania, the first crash in history (1636-1637).
From the ATH of altcoins dominance in late January / early February 2018, the bubble burst.
2018 ... 2019 ... 2020 ... this gradual bursting, punctuated by "dead cat bounces" on the altcoins market share, has thus gradually made Bitcoin take the ascendancy back, by true safe haven.
Dominance Will Comeback to 63% MinimumDominance structure is pretty bullish after long wick
And we are in mid level here, pretty sure if we can pump go to 63 in dominance in several days maybe
alts in danger.btc.d is gonna climb and give last shock to anyone saved or near breakeven.
Yes this move is not major and after that alt season should chip in.
Relief for altcoins?This is currently the seen of btc.d if today candle close below its high and next candle dont break high then selling of dtc.d is confirmed.
1- All this alt damp was manupilation and rally will be stronger then before.
2-This is great time just watch next day candle close then dca in those alts where you want ot get out.
3-Place your pending or sell limits because market is gonna go rapidly.
BTC Dominance Approaching a Key BreakoutBTC Dominance Approaching a Key Breakout! 📈🔥
Bitcoin Dominance (BTC.D) is trading within a falling wedge pattern and looks ready for a potential breakout above 62.7%. If it manages to break this resistance, we could see further upside, indicating stronger BTC dominance over altcoins. I'm watching for confirmation with volume support to validate the move.
What do you think? Will BTC continue to dominate the crypto market?
Btc.dPattern harmonic shark btc.d
Below 59.2 confirmation
Alt season coming soon
When everyone is desperate, markets rise.
It is obviously Altcoin season Bitcoin trying so hard to keep the season to himself
But I think it's the time that the altcoin going to start
Especially over the low price
Cheap entry
And quick 20x
My opinion the outcoin season is going to be hard pump and hard dump
Then we are facing the next four years of bear market

BTC dominance and 2025 ALT RallyBTC Dominance CRYPTOCAP:BTC.D is currently moving within a parallel channel since very long time. We are at an ideal point to start accumulating ALT coins CRYPTOCAP:TOTAL3 to create generational wealth in the coming months.
Double roofDominance of others, long-term ascending channel bottom, Bitcoin dominance is building a double top, the indicator is in fear and the candles are excitement of fear, the market maker tells me the alt season is near...
What do you think about BTC Dominance?I think BTC.D kinda look bullish, it means alt will bleeding or stuck even BTC pump because Crypto Summit . Not break out yet, but seems the buying power looking strong
BTC.D BEARISH HITTING LEVEL 58.58 NEXTHello Squad, These next chart updates will all be very quick to the point.
BTC.D is going to 58.58 The signal just showed itself...
Please Re-Enter for sells at every buyside liquidity take and enjoy profits.
Once this trade hits 58.58 we will be updating the trade idea.
Thank you humbly your master backtester, DegenJake_
Bitcoin Dominance Moving Lower (Altcoins—Bitcoin Moving Higher)Bitcoin Dominance going lower means that the Altcoins will be rising. The Altcoins rising means that Bitcoin is bullish and ready to grow.
Good afternoon my fellow Cryptocurrency trader, thanks a lot for your continued support.
I was wondering, does the Bitcoin Dominance index chart supports a bullish Bitcoin? This index is bearish and set to move lower.
Before we go any further, Bitcoin Dominance index was bearish between November and December 2024, at the time when Bitcoin produce a major advance from $80,000 toward $110,000. Which means that a bearish BTC.D chart can support a Bitcoin rise.
The session 3-Feb long upper-shadow is a classic top signal. The top implies that lower prices follow. This is also a rejection. Current price action is happening below the November 2024 peak reading.
All in all, Bitcoin Dominance is bearish. This index being bearish supports a bullish wave, a strong advance, developing across the Cryptocurrency market space.
When BTC.D went bearish last year, the entire market grew between 300% and 600%. This time, the growth phase will be much bigger and extended. The 2025 bull-market.
BTC.D supports higher prices based on this analysis and my interpretation of the signals.
Thanks a lot for your continued support.
If you disagree, comment and follow.
If you agree, leave a comment and a follow to show your support.
Namaste.

BTC.D%, my guess for next 3 monthsBTD.D%, my guess for next 3 months. maybe there will be a trap for 61,6% or above in short term but after that it will fall to that levels belove. I expect that and follow that levels on the charts for next months.
Not financial advice.