BTC.D UPDATEBitcoin dominance potential move. This would be good for altcoins. Unless of course it takes Bitcoin with it
BTC.D trade ideas
Bitcoin Dominance is about to repeat the same pattern! Bitcoin dominance is showing signs of a repeat pattern — altseason could be right around the corner. Stay ready.

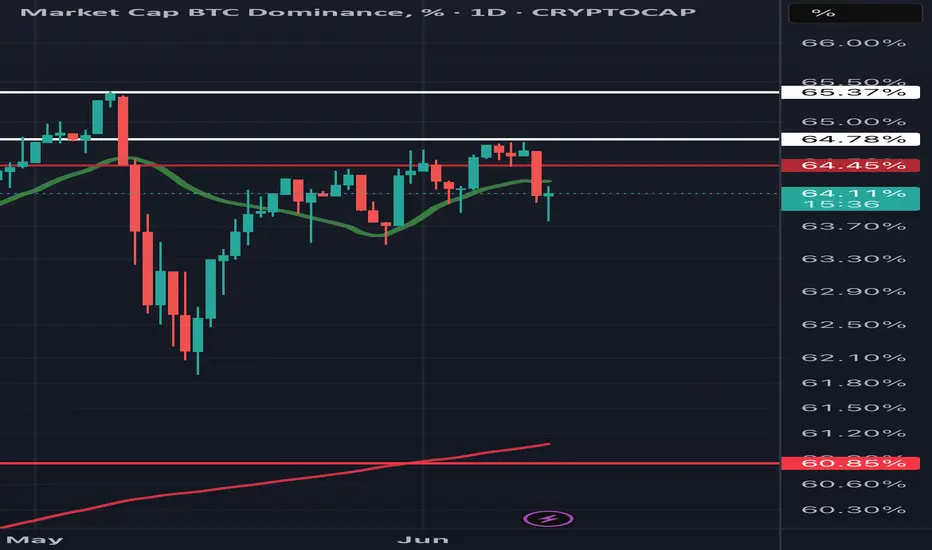
Once again…BTCD under the 20MMA
If Stays under and drop
Alts rally
Above …
More pain.
Continues to be a game of patience.
Bitcoin Dominance Will Drop To 60% SoonGood Morning Trading Family,
I really don't have much to say on this post. My last post on Ethereum showed us an inverse head and shoulders pattern, which plays out over 85% of the time. This is a clear sign that altcoins may rally within the next week or two. And here, on our Bitcoin dominance chart, you can see that the patterns are clear, BTC dom cannot last at this level much longer before a breakdown to 61% or lower occurs. Be prepared. FOMO will get real.
Best,
Stew
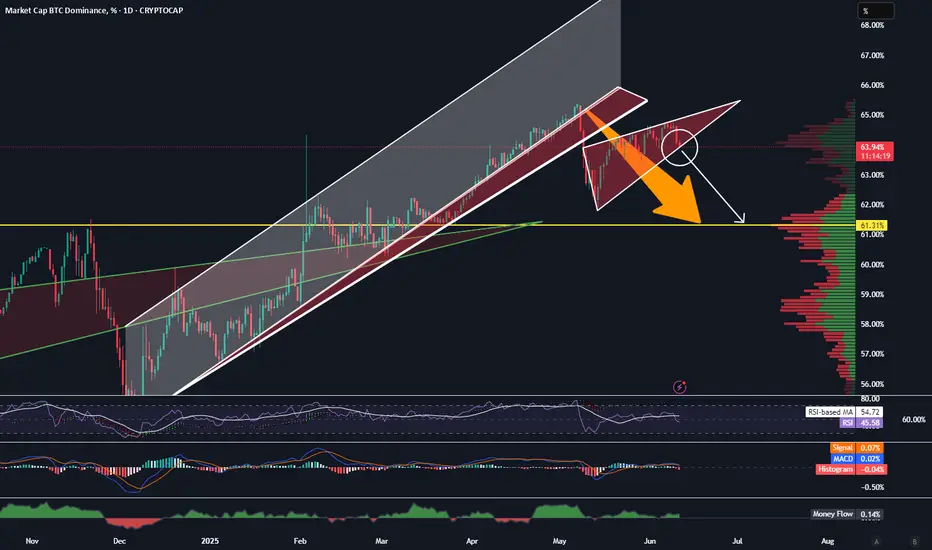
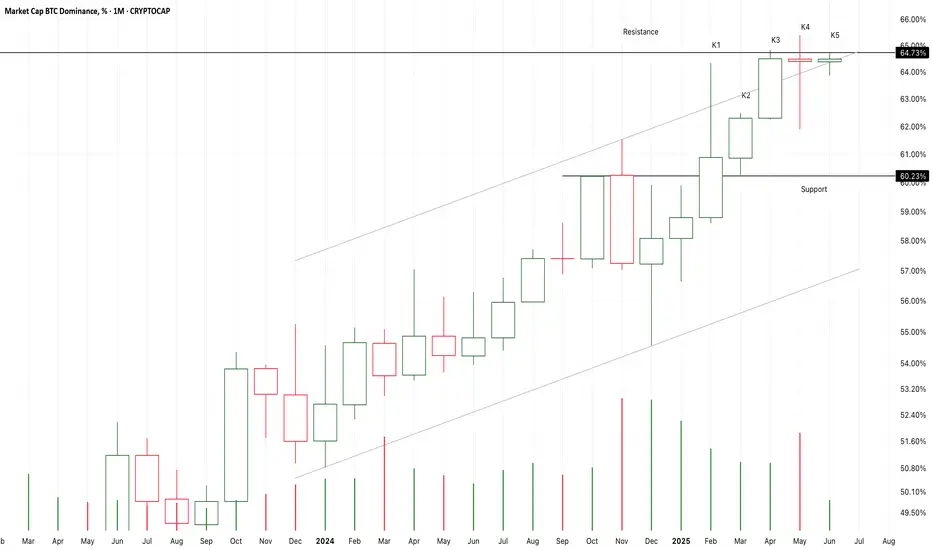
Chart Pattern Analysis Of BTC.D
After a three years bull market,
The recent candles verified a continuous strong supply pressure.
I am expecting a doji candle of K5 or K6 to terminate the bull market here.
If K5 and K6 couldn’t close upon K4,
It is likely that the resistance will push the market to test the support.
Perhaps a bear market will start here.
At the same time,
Other crypto coins may do better than Bitcoin.
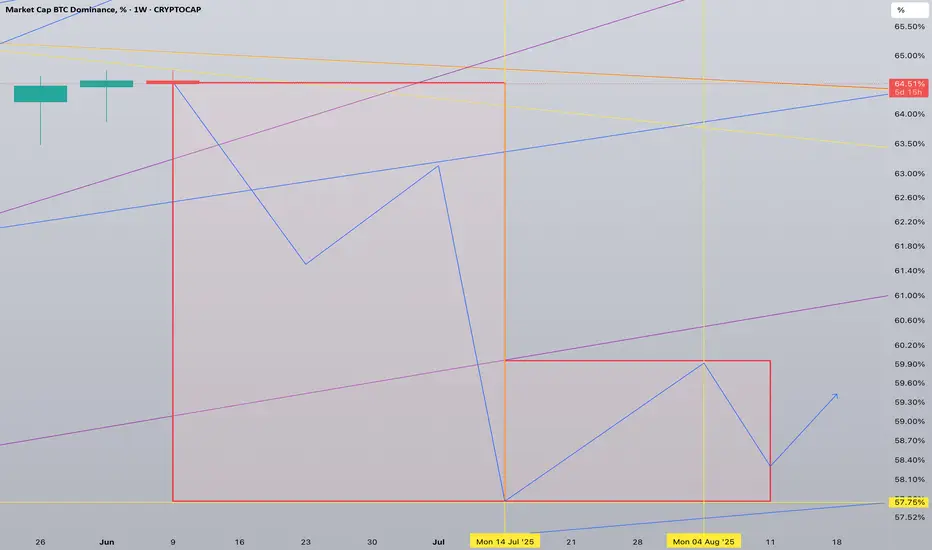
BTC.D forecast until Autust 2025This is an update of previously made forecast.
Now is a reversal week. Some alts may start running this week. But the main alts bullrun will start next week. Altseason will come in waves as usually with main events happening in July-August 2025.
Some lagging altcoins in the outskirts of crypto markets may show incredible profits in the end of August and will mark the end of 2025 summer altseason.
Don't get driven away, don't use leverage. In September we may see DXY reversal and bear market start. This will be epic for leverage and making fortunes.
For 1D charts look my Profile 'Also on'

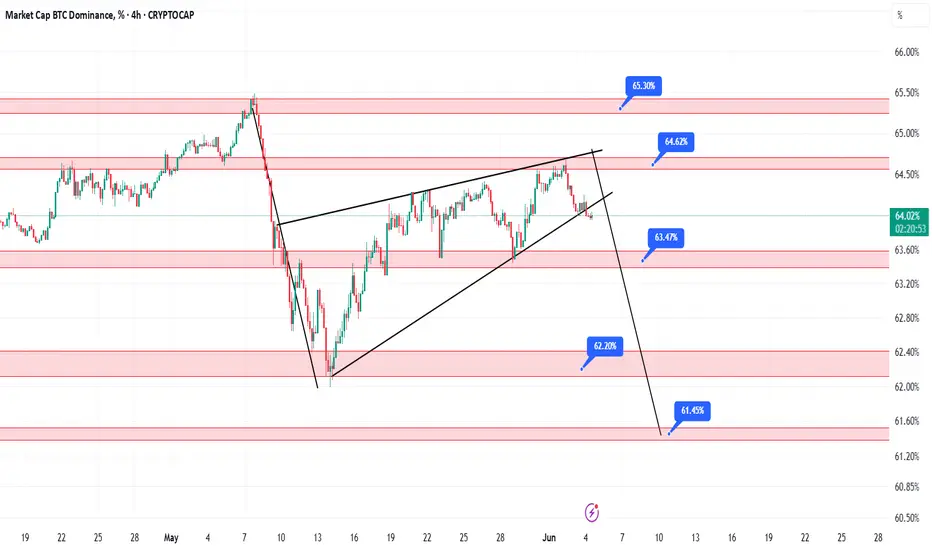
BTC Dominance Breaks Rising Wedge – Resistance in FocusCRYPTOCAP:BTC.D has powerfully broken out from the rising wedge on the 4-hour chart 🚀, now testing key resistance levels with confidence 🔥.
This move signals a potential shift in market control, often meaning money flows back into BTC even when altcoin hype runs wild 😎.
Altcoins, watch closely—will you rally or fade into the background? The next chapters in this dominance battle are unfolding 👀.
Stay tuned for what’s next in the crypto arena!

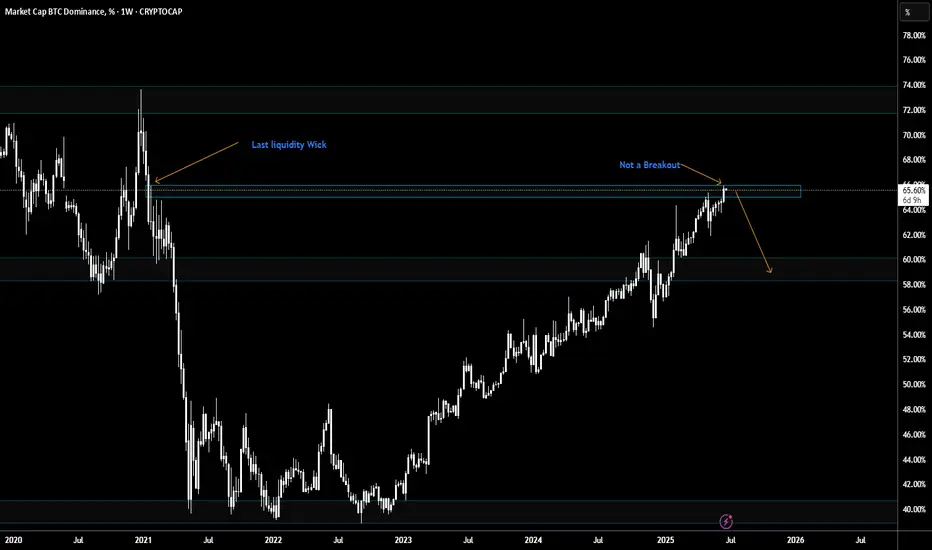
Altseason still possible | Bitcoin D. On ResistanceBitcoin Dominance is sitting on a resistance zone, reached the last liquidity wick. I still expect the altcoins to go up from here, since there is no valid breakout above this level.
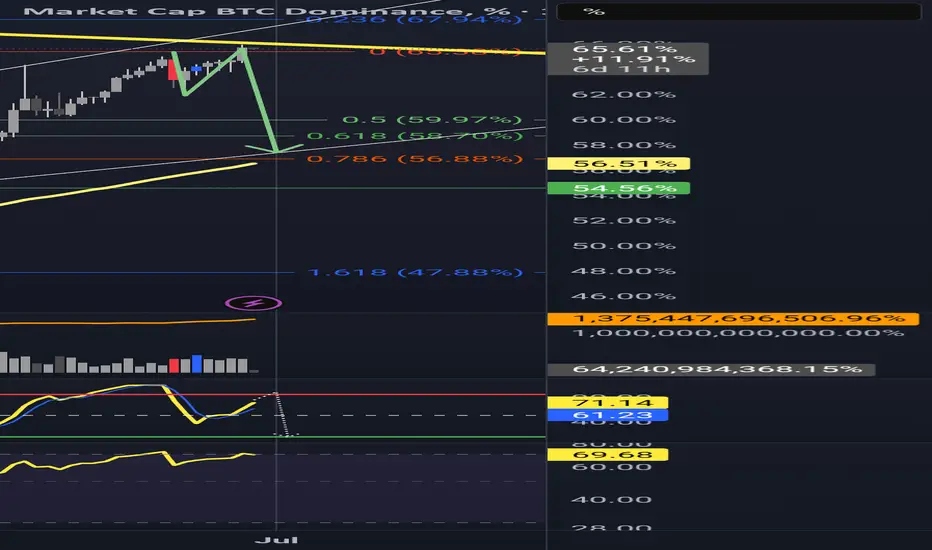
Is Altseason Around the Corner? BTC.D looks tired AF!BTC dominance just hit the top of a rising wedge that has been building for over a year. Price is stalling at 65.64 percent, sitting right against long-standing resistance.
Momentum is weakening. Stochastic RSI is at 72 and starting to roll over. RSI is sitting just under 70 and showing early signs of fading.
The structure suggests we are close to a decision. If BTC dominance starts to fall from here, the conditions for an altcoin run are in place.
Key levels to the downside are already mapped. First is 59.97 percent. Then 58.70 percent. After that, 56.88 percent. The 100-week simple moving average is also sitting at 56.51 percent. If dominance breaks below that level, it opens the door for a larger shift in market flow.
Previous retracements in BTC dominance have aligned with strong moves in altcoins. This current setup is technically clean and nearing resolution.
It is not confirmed yet, but the signals are starting to stack. This is a moment worth watching.
Weird cycle for alts Weekly update for this check lately has been painful
Outside of XRP and a few others it’s been a difficult ride this alt season.. weird to say the least . We were doing better in 24 than the Trump rally last November/Dec
Been pretty much downhill ever since.
While BTC still over 100k I fell we still have a chance but this alt season window is closing fast.
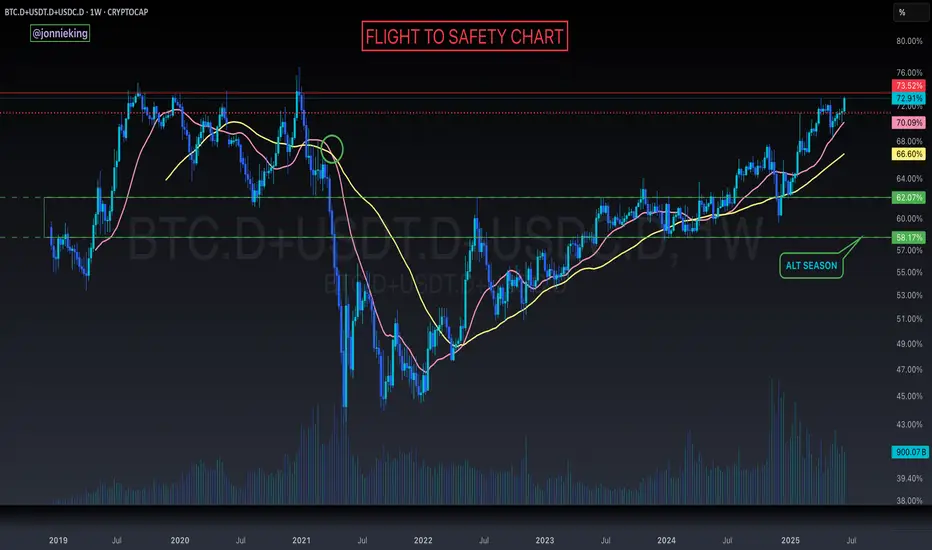
BTC.D + USDT.D + USDC.D > FLIGHT TO SAFETY SurgingStructures are being broken across the board 🚨
Looks like the Flight to Safety chart is closing the week at a new cycle ATH.
Should push to 74% before we see a meaningful turn around.
BTC.DThere's one last chance for a decline in the takeover ratio if the weekly candlestick indicator doesn't close above the 66% level. If this level is breached, the stock will reach 71% without hesitation

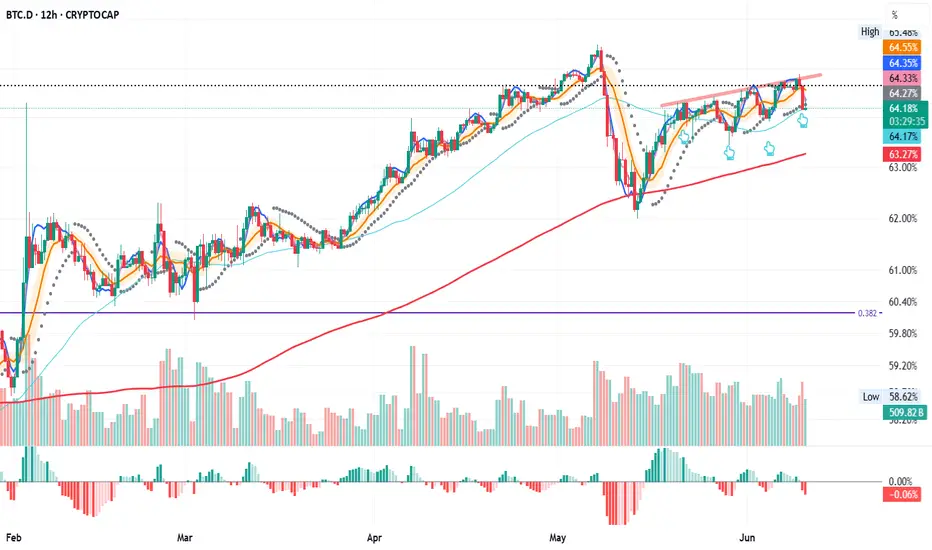
BTC.D – Repeat or Reset?
BTC.D (Bitcoin dominance) on the 12H chart is now testing the 50MA for the fourth time.
The last three touches led to a bounce toward the triple top trendline.
Will it play out the same way again, or will the 200MA need to step in as support?
Let’s watch it unfold together.
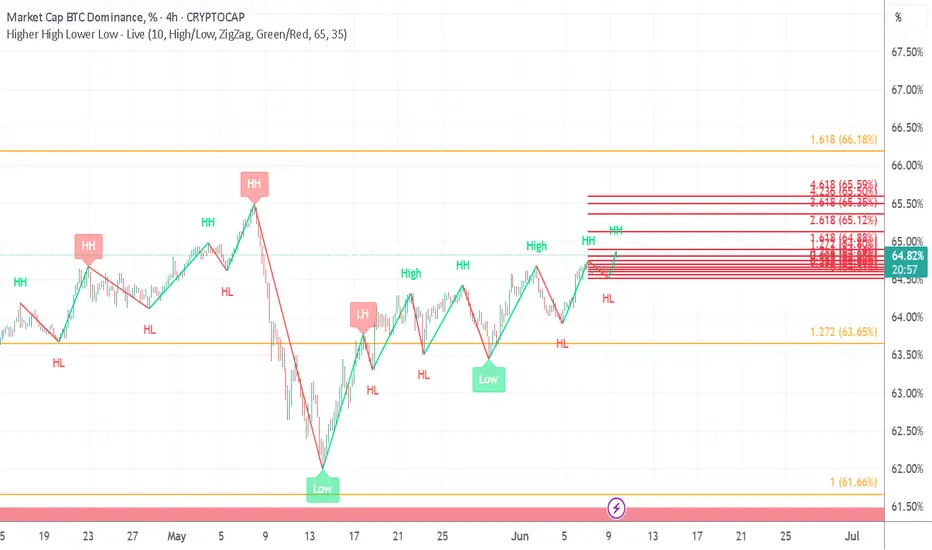
BTC Dominance still bullishIf you see , the bitcoin dominance still in uptrend , based open the fib on long term maybe can reach 1.68 on 66% and 2. 618 on around 73-74% . and in 4h (swing) can approach 65% let's see. This is crazy season where alt don't have a room to breath also so many tokens launches everyday. This season is not the same anymore
Bitcoin Dominance AnalysisBitcoin Dominance is forming a rising wedge pattern on the 4-hour timeframe, which is a positive signal for altcoins. A rising wedge is typically a bearish pattern that often breaks downward. We could see a significant rally in altcoins once the rising wedge breaks.

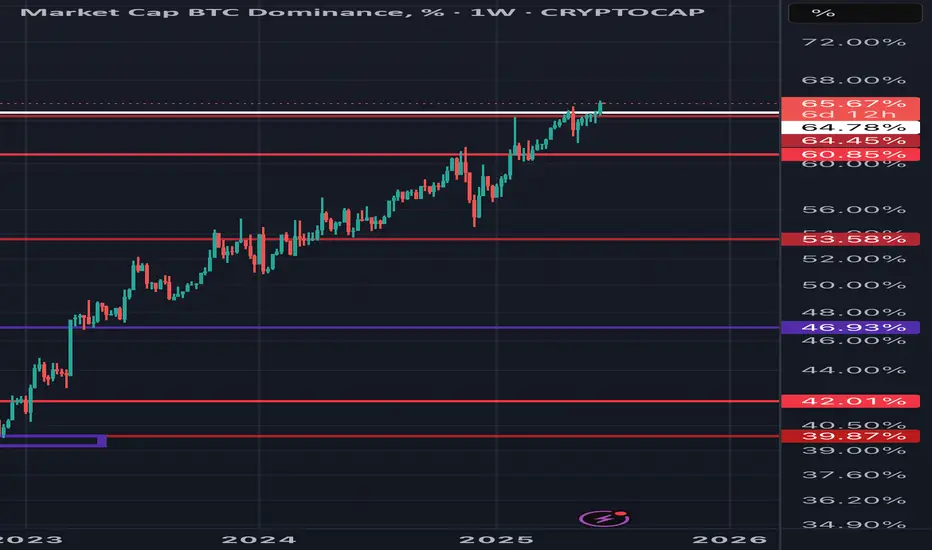
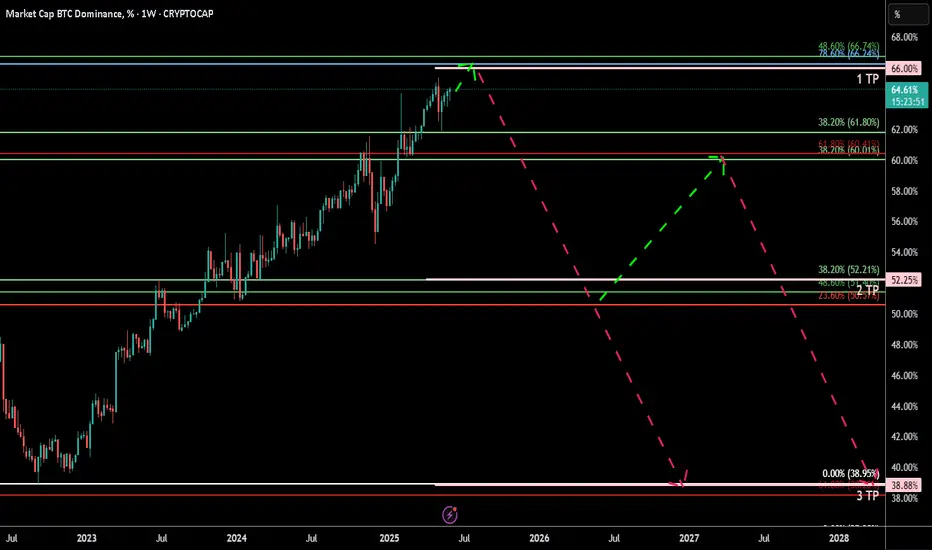
BTC.D (Dominance at Critical Fibonacci Confluence) 2025 Weekly
**Summary:**
Bitcoin Dominance (BTC.D) is testing a major Fibonacci confluence near the 66% level. This zone historically acts as a major pivot and may signal either a continued dominance rally or a potential reversal setting the stage for altseason. We use three layered Fibonacci retracements to outline dominant trend zones, key resistances, and projected targets.
**Chart Context:**
This chart uses **three distinct Fibonacci retracements** to map the historical and projected behavior of BTC dominance:
1. **Primary Fib** (100% to 0%): Captures the macro move from BTC.D \~100% down to its 0% level at \~0%, which aligns with the first altseason (2018–2019).
2. **Secondary Fib** (100% to 38.88%): Maps the first bearish wave to identify potential recovery levels. BTC.D retraced up to the 61.8% (\~73.68%) but failed to break further.
3. **Third or the Current Fib** (73.68% to 38.88%): Maps the latest bearish fall in BTC.D. As of now, BTC.D is hovering at the 78.6% retracement level of this move, indicating heavy resistance.
**Key Technical Observations:**
* **1st TP (Resistance):** 66% — Strong Fibonacci confluence zone:
* Fib2 48.6% ≈ Fib3 78.6%
* Major reversal zone historically
* **2nd TP (Support):** 52.25% — Multi-Fib confluence:
* Fib1 48.6%, Fib2 61.8%, Fib3 38.2%
* **3rd TP (Ultimate Support):** 38.88% — Historical BTC.D bottom, aligned with the first altseason.
* Intermediate Fibonacci confluences between 48%–60% serve as layered support during decline phases.
**Indicators:**
* No external indicators used; pure multi-frame Fibonacci confluence.
* Price action structure and historical patterns highlight potential market rotation zones.
**Fundamental Context:**
The current phase of the market reflects increasing speculative activity in altcoins while Bitcoin consolidates. Historically, high BTC.D correlates with Bitcoin-led rallies, while a sharp drop often triggers altseason.
* Growing inflows into ETH, SOL, and possible now XRP, and mid-cap alts suggest capital rotation.
* If BTC.D faces rejection from 66%, the market could enter a new altseason phase.
* Macro tailwinds (e.g., easing monetary policy, risk-on sentiment) support altcoin performance in the medium term.
**Philosophical or Narrative View:**
BTC.D acts as a barometer of market risk preference. As confidence expands beyond Bitcoin, money flows into altcoins—like tributaries branching off the main river. The rejection from major confluences signals this psychological shift, marking phases of creative decentralization.
**Related Reference Charts:**
* TOTAL3 Fibonacci Setup (Altcoin market excluding BTC & ETH):
* TOTAL2 Correction Probabilities:
**Bias & Strategy Implication:**
* **Primary Bias:** Bearish rejection from 66% followed by correction to 52% and potentially 38.88%.
* **Alternative Scenario:** Brief breach above 66% before reversal.
* Traders may consider rotating into altcoin exposure if BTC.D confirms reversal at the confluence zone.
**Time Horizon:**
* Mid to Long Term (1–6 months outlook)
* Weekly timeframe tracking
**Notes & Disclaimers:**
* This analysis is for educational purposes. Market conditions may evolve rapidly.
* Use proper risk management when acting on dominance signals.
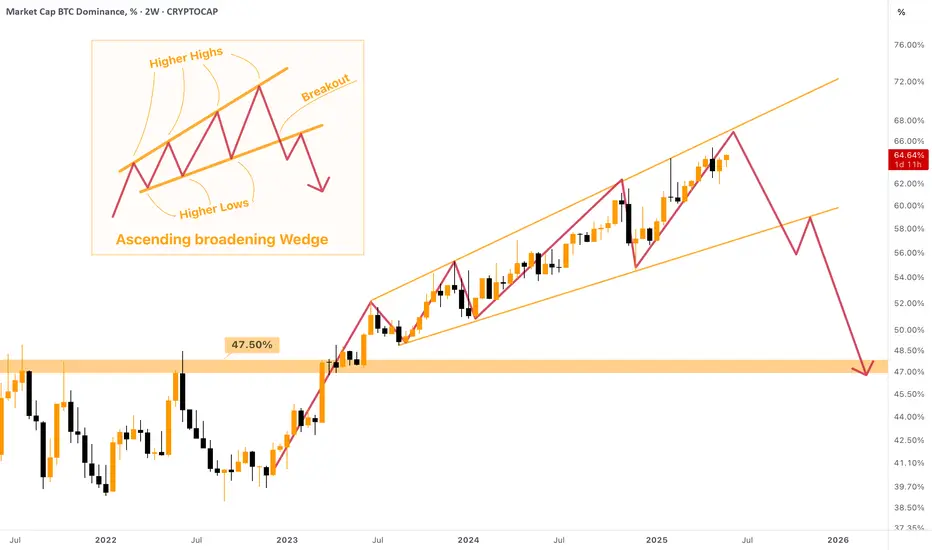
Biggest Altcoin Season of this Bull Cycle is Coming! As you can see, there is a Massive Ascending Broadening Wedge forming on the #Bitcoin Dominance!
Currently dominance is located almost near the top of the wedge. More likely we will see its ascend up to 67% which will be marked as top before the dump.
The breakdown of this wedge will signal a beginning of a HUGE Altcoin Season (comparable to Autumn of 2021 or Autumn of 2023) when not only small cap, but major altcoins will be sent to new highs. With high probability it will begin in August and will last till December this year.
Mark my words & be prepared for the last opportunity of this bull cycle!
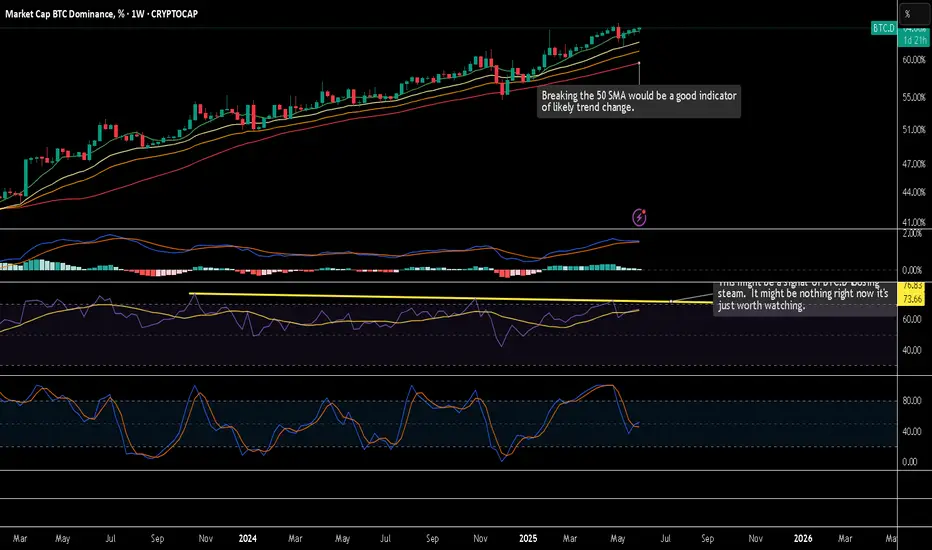
BTC.D can it go up for ever?BTC.D: A Long-Term Weekly Analysis of Bitcoin Dominance
This post is about the overall long-term trend of BTC.D, not the day-to-day action. All analysis is based on the weekly timeframe.
Fundamental Catalysts for a Trend Change
A significant downturn in Bitcoin Dominance would likely be preceded by a combination of these factors:
US Rate Cuts: An increase in market liquidity from easier monetary policy could fuel a
broader crypto rally, benefiting altcoins.
Shift in Retail Interest: A rotation of attention towards altcoins, which can be tracked by
crypto-related content views. (Note: The rise of AI Search may alter how we track this
compared to traditional Google search metrics).
"Bitcoin is Expensive" Sentiment: As BTC's price becomes psychologically high for retail
investors, they often look for higher potential returns in lower-priced altcoins.
Technical Readout (Weekly Chart)
1. Price Action & 50 SMA
So far, I'm not seeing any signs of a trend change in the price action itself. A decisive break and hold below the 50-week SMA would be a strong indicator of a major trend change. However, other indications will likely appear before that happens.
2. MACD Indicator
Currently, even a bearish MACD crossover on this timeframe would not be enough to confidently signal a larger trend reversal. It could easily just be part of a short-term pullback or consolidation.
3. Diagonal Trendline On RSI
A failure to move above the yellow diagonal trendline could be an early sign of weakness. However, on its own, this is not a strong indicator and requires other signals for confirmation.
4. Stochastic RSI
There is nothing worth mentioning on the Stochastic RSI at this time; it is not providing a clear signal.
Disclaimer:
The information provided in this post is for educational and informational purposes only. It does not constitute financial advice, investment recommendations, or a solicitation to buy or sell any financial instruments. All investments involve risk, and the past performance of a security, market, or trading strategy does not guarantee future results. I am not a financial advisor. Please conduct your own thorough research and consult with a qualified financial professional before making any investment decisions. You are solely responsible for any investment decisions you make.
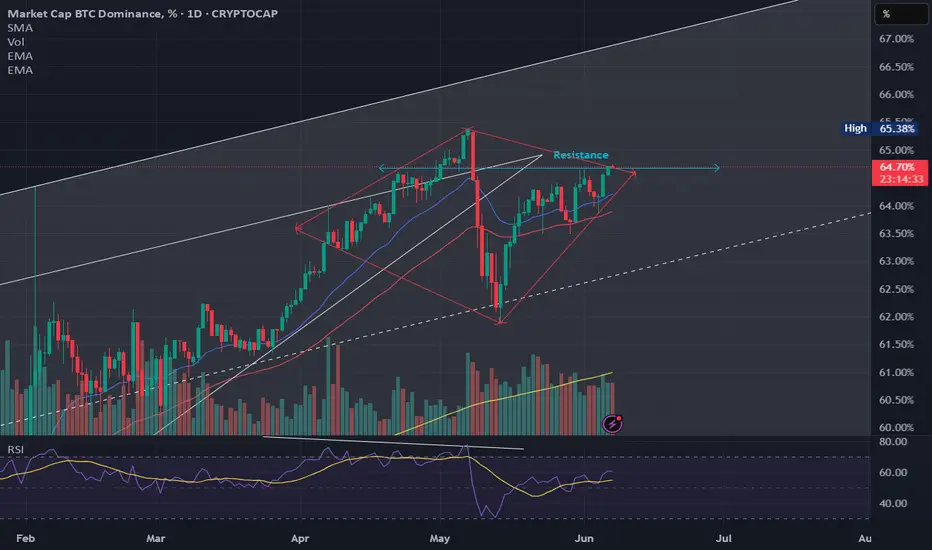
Diamond on the Daily
Diamond on the Daily after an extended uptrend could signal a potential reversal in the very near future. Resistance on the Daily (blue line) would make this Diamond Pattern complete. Anything can happen, and usually does lol, but we could see a significant pullback. Time will tell!
Bitcoin dominance deeper viewBased on the volume trend and the chart pattern, it can potentially be down to %58.

Why disappointed? Btc Dominance update here Just Trust the process
BTC DOMINANCE last leg
You can see here BTC Dominance already broked it's uptrend and started it's downtrend it is just taking a move up to retest.
Soon you will see if after touching the black box area it breaks the structure on lower time frame get ready for huge Altseason 🚀 🚀 🚀 🚀 🚀 🚀 🚀
Don't worry it's just a pull back
Only the strongest will survive
This is the beauty of the Market
Hold your horses good days are waiting for you
They just want you to sell and get disappointed.
Follow me for more premium content free

BTC Dominance New Update (12H)We are truly at a critical point for Bitcoin dominance.
It’s possible that the main drop in Bitcoin dominance has already begun. If the green zone is lost, dominance could experience a deep decline, especially since the final wave of this diametric pattern | wave G | has touched the 0.618 Fibonacci level.
That said, there’s still a chance that the green zone might once again push the price near the previous high before we witness the drop in dominance. However, there are also signs suggesting that the main drop may have already started. Follow the chart closely and monitor it with precision.
For risk management, please don't forget stop loss and capital management
Comment if you have any questions
Thank You
