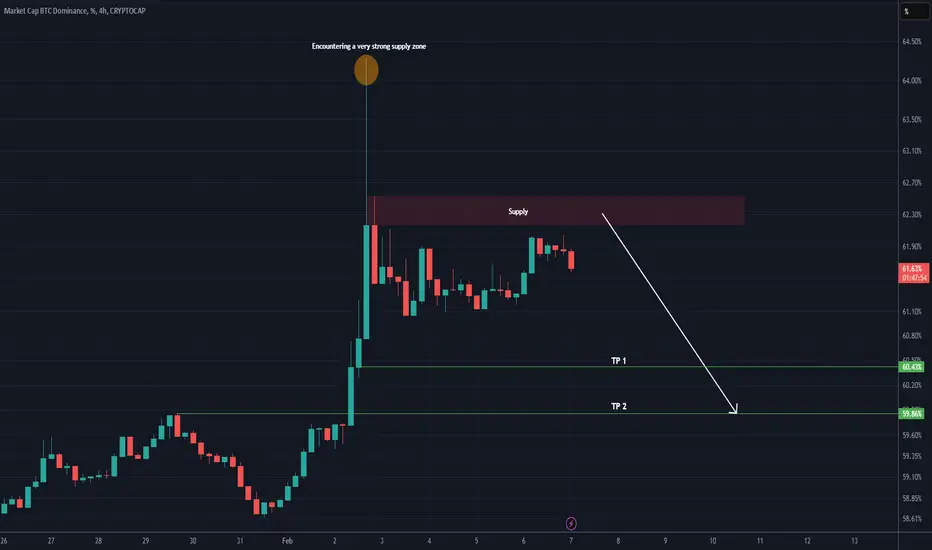
BTC Dominance is bearish (4H)Bitcoin dominance has hit a very strong supply zone, and we should not forget this.
From this point or after touching the supply, it may move toward the specified TP levels.
Since a large number of sell orders have been accumulated, we expect a deeper drop.
For risk management, please don't forget stop loss and capital management
When we reach the first target, save some profit and then change the stop to entry
Comment if you have any questions
Thank You
BTC.D trade ideas
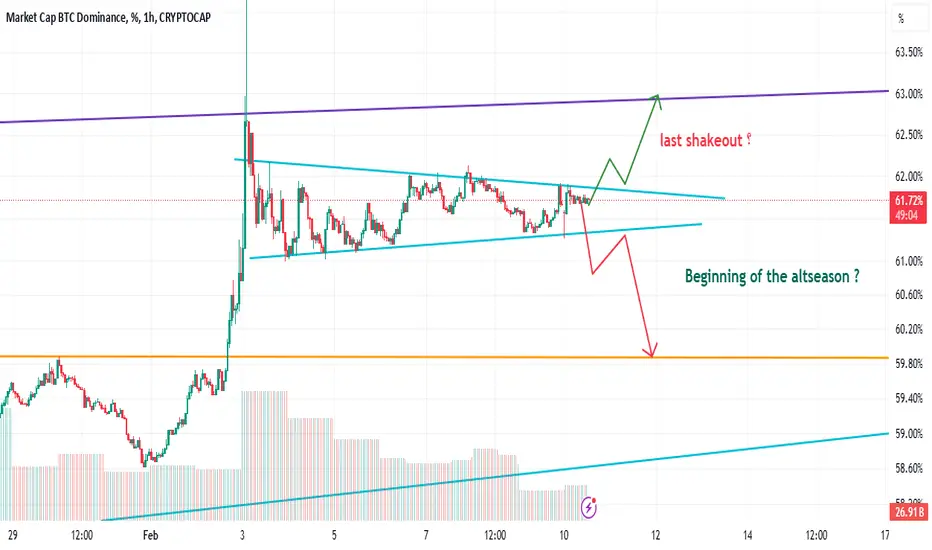
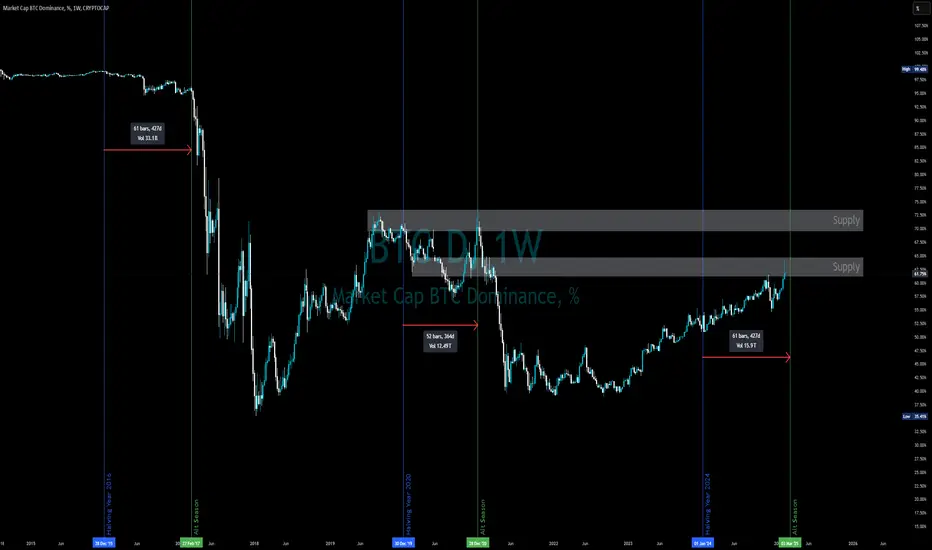
Beginning of the altseason or the last shakeout?Hello Traders 🐺,
In my last idea about BTC.D, I mentioned that this huge wick to the upside indicates that the BTC season is nearing its end , and we are now on the verge of entering the Altcoin season . But what makes me so confident about this?
As you can see in the chart above , we’re currently facing a strong weekly resistance at the 64% level, which has been a key point in the past. After the market’s most recent capitulation, we saw a massive dump in Altcoins , while BTC only corrected by 10% —a normal and expected move. But here’s the critical takeaway:
🔑 This means that Altcoins are now being traded at extremely undervalued levels.
So, why am I saying this with such confidence? Keep reading to find out why these levels present a major opportunity for the upcoming Altcoin season!
The Final Phase of BTC Season? The Big Altcoin Opportunity!
Currently, the chart is shaping something very similar to an ascending triangle—a pattern that’s typically bullish, especially when the overall trend for BTC.D is strong. But here’s the catch: a trend is our friend… until it ends!
🔥 And the key part? " Until it ends !" Yes, we are very close to that moment!
Why? The answer lies within the ALTCOIN/BTC charts . Right now, almost every single altcoin you can think of is down by a massive 90% from its all-time high against BTC ! This is not just a number—it’s a huge signal that there’s barely any room left for altcoins to go lower compared to BTC.
All the pieces of the puzzle are falling into place, and they’re spelling out one clear message:
💡 BTC dominance is nearing its peak, and we are extremely close to the bottom for altcoins—if we’re not already there!
The real question is: Are you ready for what’s coming next? Stay sharp, stay informed, and make sure you don’t miss what could be the biggest opportunity of the cycle!
BTC.D Update = What happened to the ALT SEASON?I had this possibility on the back of my mind but didn't think it'd play out since things are much different this time
I obviously missed the last downward movement (even though I had it marked on USDT.D + some alts)
PS. Trust me, BS news you see is just an excuse. It's almost always in the chart (in this case, tariffs) = This is how I was able to predict 5th August bottom (in that case, it was the Japanese Yen news but in reality, it's all in the chart but I missed it this time and I'll accept it, I was too busy so never looked at it.. the reason I stopped posting after November)
It would be wonderful if you guys interact and keep things on your panel too!

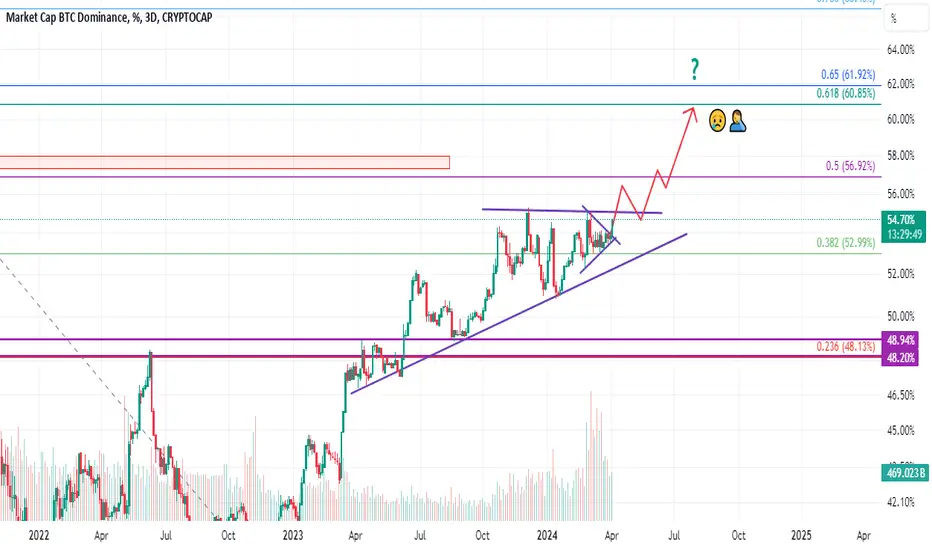
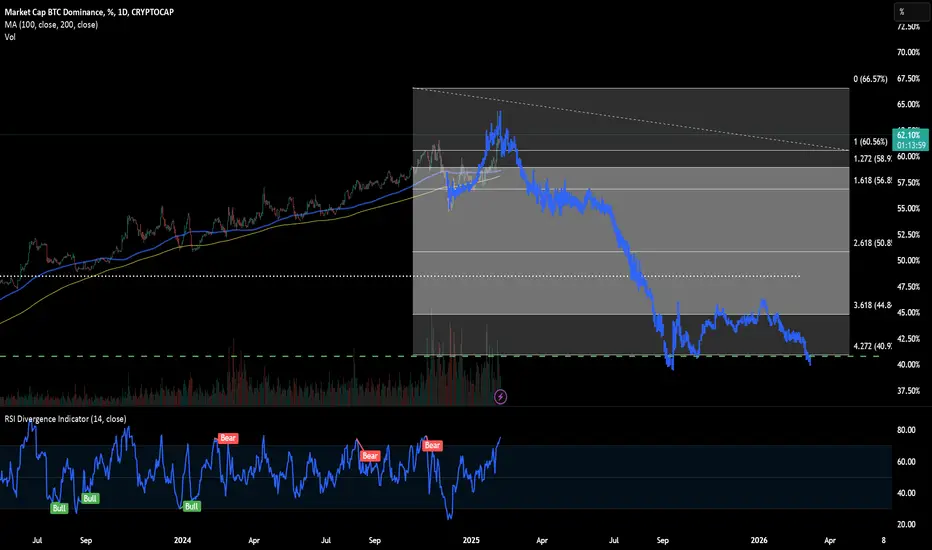
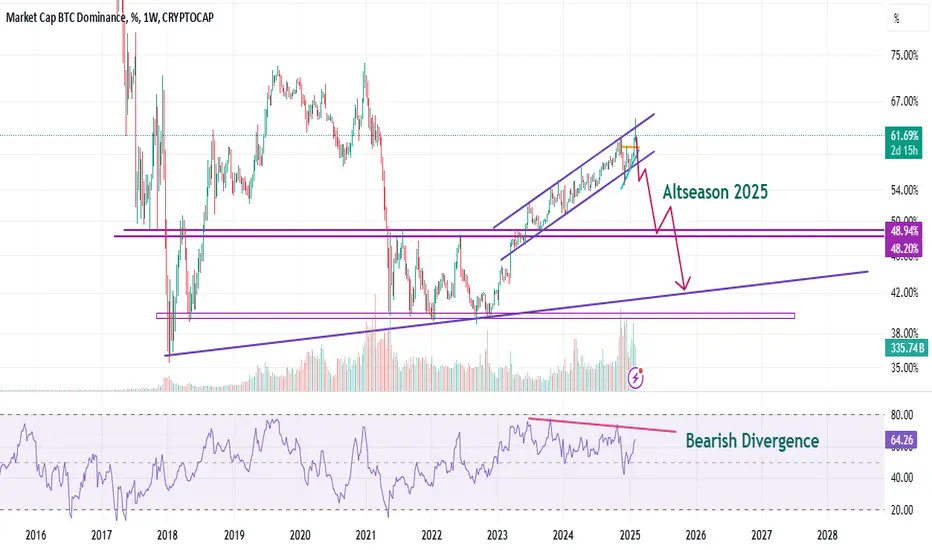
Wen Alt Szn?BTC.D has just tested the .618 of its December 2020 long term high, December 2020 marked the beginning of the 2021 alt season. Its December 2020 long term high is the .618 from December 2016, December 2016 marked the beginning of the 2017 alt season.
BTC.D's weekly RSI has entered overbought levels while forming bearish divergence similarly to the December 2020 long term high.

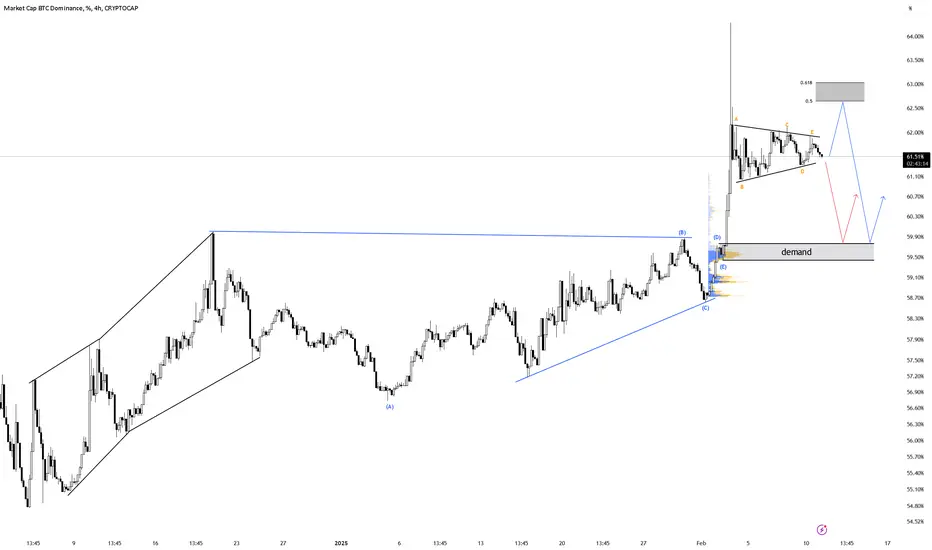
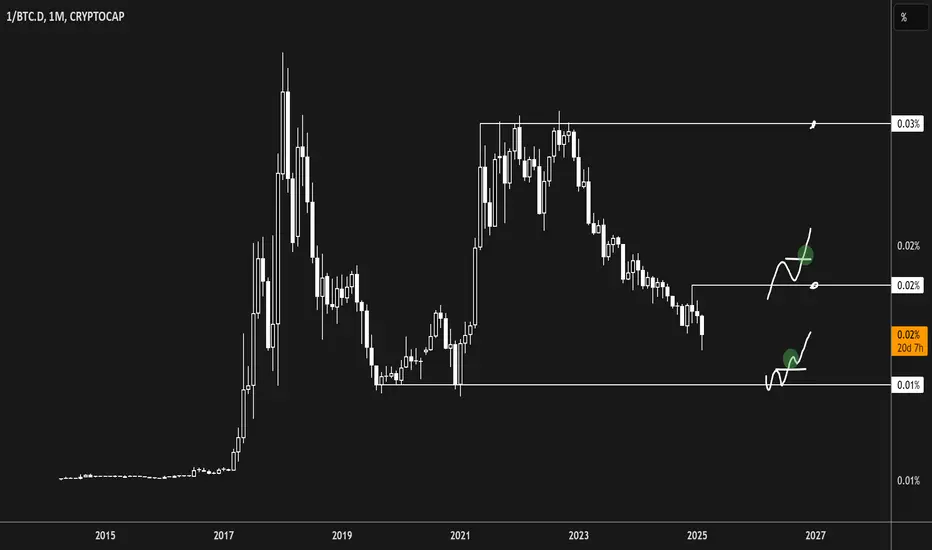
BTC.D update#BTC.D made a small triangle in hourly time frame and before this triangle is a down spike so the next step will be another down but i saw this many times that the next way after a triangle become opposite of the first move so its possible that the market go up and then go down to the demand zone
BTC.D DOWN MID TERM!As seen in the graphic BTC.D is about to complete a bullish cypher that also coincides with the FIBO channel support. Then comes a long term rise up to %83 area which will melt down altcoins. In the mid-term altcoins will rise till August-October this year then crush badly.

btc.d The expected move for me to take over soon is a downward movement with a head and shoulders formation.
The End of Bitcoin ( Alt started Great Rotation )BTC dominance is ending, marking the start of the great rotation. Targeting a 40% shift, equivalent to $800B in capital flows at the current market cap. Happy to see Alts great rotation.
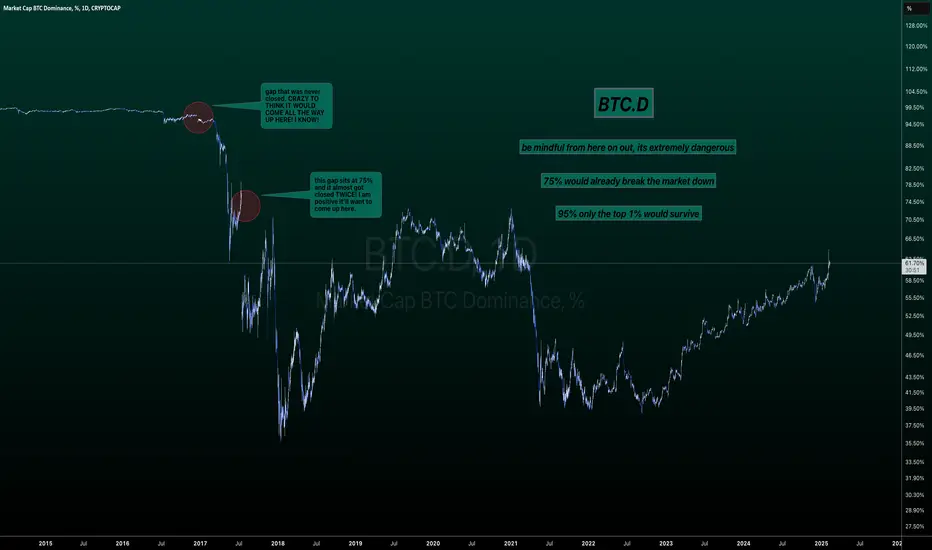
BTC.D - Doomsday or Expected?Evening fellas,
Remember back then when we would say "only the top 1% will actually make it"
Yeah, what about that? People seem to forget this market is extremely fake, full of shitcoins that will not go anywhere.
Trust me, the bottom for alts is not in. Minimum we go here is 75%.
Once the bitcoin maximalists have acquired enough btc by trading alt/btc pair they will dump everything they got back into only BTC.
Gonna leave this here.
Trade thirsty, my friends.
$BTC.D is at key Fib Retracement level. More upside-expectedThe most important story of this Crypto cycle has been the relentless strength of CRYPTOCAP:BTC against other crypto. The index CRYPTOCAP:BTC.D which measures the dominance of BTC in the total Crypto market in terms of Market Cap hit its low in Dec 2021 when CRYPTOCAP:BTC.D hit a multi-year low of 39%. That means only 39% of the Total Market Crypto can be attributed to $BTC. But since then, the Fed quantitative tightening began and most of the cryptos faced a meltdown. Even though CRYPTOCAP:BTC faced a bear market in CRYPTOCAP:USDT terms but still it fell less than the average Crypto. Since then, the CRYPTOCAP:BTC.D chart has made a bullish double bottom and then made new higher lows and higher highs. If we plot the Fib retracement levels on the CRYPTOCAP:BTC.D weekly chart we saw recently that the Dominance chart stalled around 0.5 and 0.618 Fib levels. Since then, the Dominance chart has been making new highs and broken past the 0.618 . The next key level is 0.786 which will take the dominance to 66.12% percent. Watch out for my blog when CRYPTOCAP:BTC.D reaches the key level for more insights.

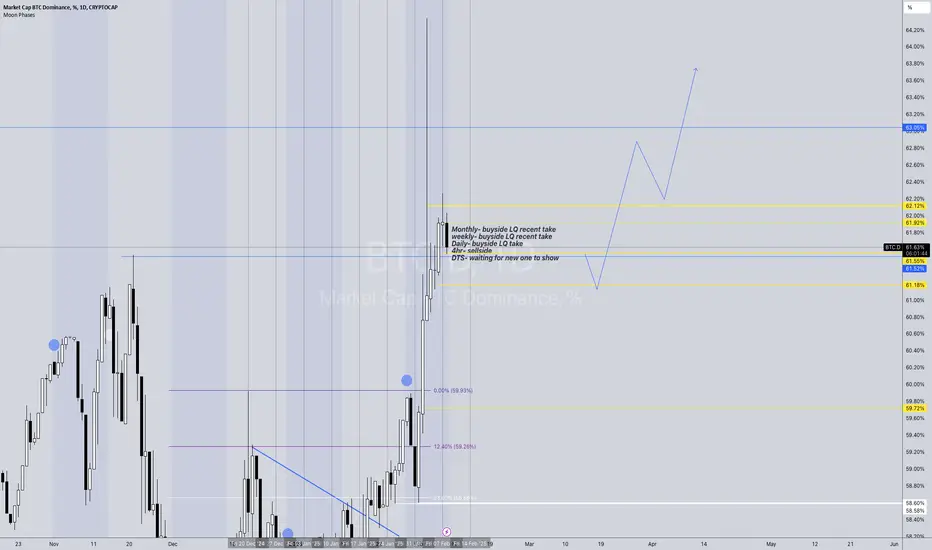
BTC.D update Hello everyone. Today for BTC.D we have here it showing a lot of Bullish momentum a lot of buyside LQ has been taken on higher TF as shown here, but also just 4hr sellside getting taken out being used as support showing a lot of Bullish power to just use 4hr and keep scalling upward is what its showing..but all I can say is buying should be the objective here. wait and spot those 4hr sellside LQ pockets use them for help. but anyways not until a DTS shows would I consider a change of trend other than than that im really waiting for a daily reaction thats when things will get good. but until then enjoy the set up do the work. have enjoy and trade safely. I am not a financial advisor this is all based off speculation and non credible calculations and probably biased information in general. trade at. your own risk this is not a signal nor am I responsible for losses or potential gains. thank you. Stay Blessed.
Bitcoin Dominance and DXY pattern correlation!Is the bitcoin dominance correlated to the DXY?
So far... I think so. Chart pattern wise anyway.
So, according to the DXY, if the Dominance follows this pattern we should be in the biggest altseason to date. But it could be the last one for a while as there could be a 90% to 95% flush out of alts coming.
This would crush all altcoin belief and get rid of all the shit coins. Lets be honest at this point it's needed to flush out all this garbage, it's too much.
Then knew cycle would start over and follow with a massive altseason bigger than anything ever. Don't get excited just yet, it not happen until 2033 or later.
Also according to this chart, dominace can go a bit higher to 72% before it starts to fall. lets see
That's all I have here, I just wanted to put it out here. If you want more analysis on this I have put out a comprehensive video on my tictik and youtube page.
Remember, this is not financial advice.
Kind regards,
Demetrios

Going long on ALTSTime high conviction position sizing accordingly.
(need to make the description longer or I cant post lol)
Bitcoin Dominance | Leading Alt Season? Or Continuation Decline?| CRYPTOCAP:BTC.D | 🔎 Weekly Analysis
As you may know. alt seasons depend on a decline in BTC.D.
BTC.D is calculated as the ratio of Bitcoin’s market capitalization to the total market capitalization of the digital asset space. When BTC.D falls, it indicates that capital is flowing out of Bitcoin into altcoins or stablecoins such as USDT, USDC, RLUSD and others.
••• BTC Dominance (BTC.D) during past alt season.
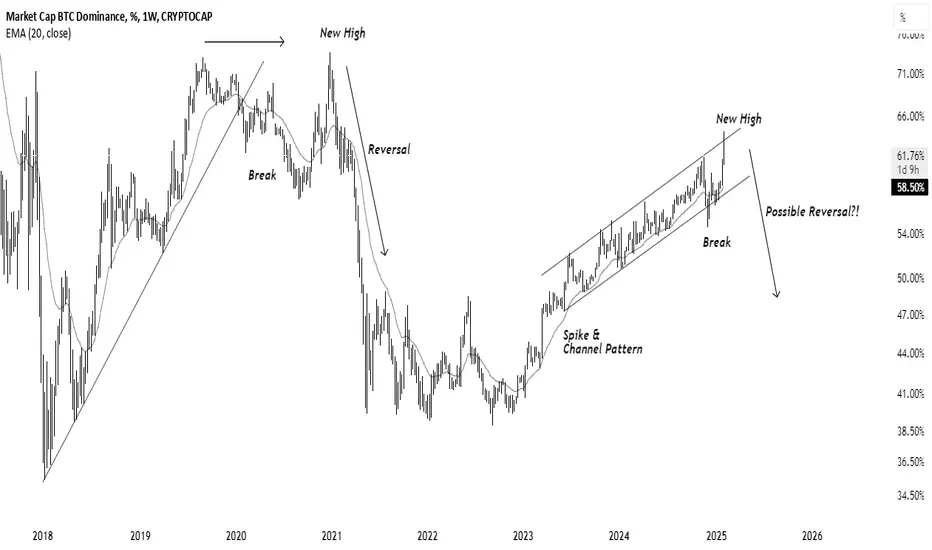
⏪ Now that we understand what BTC.D is, let's examine its behavior during previous alt season. As marked in the chart, BTC.D has experienced an uptrend. After a breakout, it pushed to new high within the upward channel, and as expected, a reversal occurred! (Price Action Rules)
••• Current state of BTC.D.
▶️ After a significant spike, it is currently following an upward channel.
A spike followed by a channel pattern is a common price action occurrence.
As Marked in the chart, similar to previous alt seasons, BTC.D has experienced a breakout from the upward channel and has pushed to new high. Therefore, we can expect a potential reversal!
🔳 Final words
Is it time to buy some altcoins? If you ask me, it's not yet time to invest. We cannot predict whether a reversal is happening or not. Since we avoid taking unnecessary risks, we should wait for clear sign of reversal in the BTC.D
❤️🔥 Thanks for reading my idea!
What does the BTC's dominance say to us?CRYPTOCAP:BTC.D
👨🏫 Analyst Alex Kelly: Bitcoin dominance looks very promising to change the trend and create a long-awaited Altseason.
✍️ Crossing the intersection of the trend line and the middle zone, along with the ascending corner pattern, confirms this move.
🚀 It's time to buy altcoins.
⚠️ Disclaimer:
This is not financial advice. Always manage your risks and trade responsibly.
👉 Follow me for daily updates,
💬 Comment and like to share your thoughts,
📌 And check the link in my bio for even more resources!
Let’s navigate the markets together—join the journey today! 💹✨

Bitcoin Dominance Pumping , Is the Altcoin Market in Trouble ?Bitcoin dominance has broken a significant resistance level, signaling a shift in market dynamics. The previous double top formation has completely failed, and dominance is now sustaining above the prior highs. This development has bearish implications for altcoins, as Bitcoin's growing market share typically leads to capital outflows from the altcoin sector.
Key Points on the Chart
Double Top Failure & Breakout Confirmation
The market was previously forming a double top pattern, a classic reversal setup that often signals a potential decline.
However, BTC dominance not only broke the double top resistance but has held above it for multiple days, confirming bullish continuation.
A failed double top often results in a strong move upward, as short-sellers covering their positions add to the momentum.
Ascending Channel Structure
The chart shows BTC dominance moving within a rising wedge/ascending channel formation.
The breakout above the mid-channel resistance suggests an acceleration in trend strength, increasing the likelihood of BTC dominance rising further. As long as dominance stays within this structure, Bitcoin will likely outperform the altcoin market.
Key Support & Resistance Levels
56.44% level was a major resistance in the past and is now a confirmed support zone.
61.91% (current level) marks the breakout region, now acting as new support.
If dominance continues its uptrend, the next potential resistance area could be 66%–68%, marking the upper boundary of the trend.
Impact on Altcoins
Altcoin Weakness Likely to Continue
Historically, when BTC dominance increases, altcoins tend to bleed as capital rotates toward Bitcoin. Many altcoins may struggle to gain momentum unless BTC dominance reverses from this region.
Conditions for Altcoin Recovery
For altcoins to regain strength, BTC dominance must decline from this breakout zone.
A rejection from the upper trendline (~64%–66%) could create a temporary relief rally in altcoins.
Altcoin Seasonal Trends
Typically, altcoins start recovering once BTC dominance peaks and shows weakness.
Until then, Bitcoin remains the safer bet, while altcoins carry higher risk.
Trading Considerations & Strategy
For BTC holders: The breakout suggests strong dominance continuation, meaning Bitcoin may remain the best-performing asset in the short term.
For altcoin traders: Monitor Bitcoin dominance closely a drop back below 60% would be the first sign of relief for altcoins.
For market timing: If BTC dominance approaches 64%–66%, a potential rejection could provide entry points for altcoins.
Bitcoin dominance has broken a crucial structure, signaling altcoin weakness and Bitcoin strength. Until BTC dominance reverses or consolidates, altcoins may struggle to gain momentum. Watch the 64%–66% zone for signs of exhaustion if BTC dominance starts rejecting from there, it could mark the beginning of an altcoin resurgence.

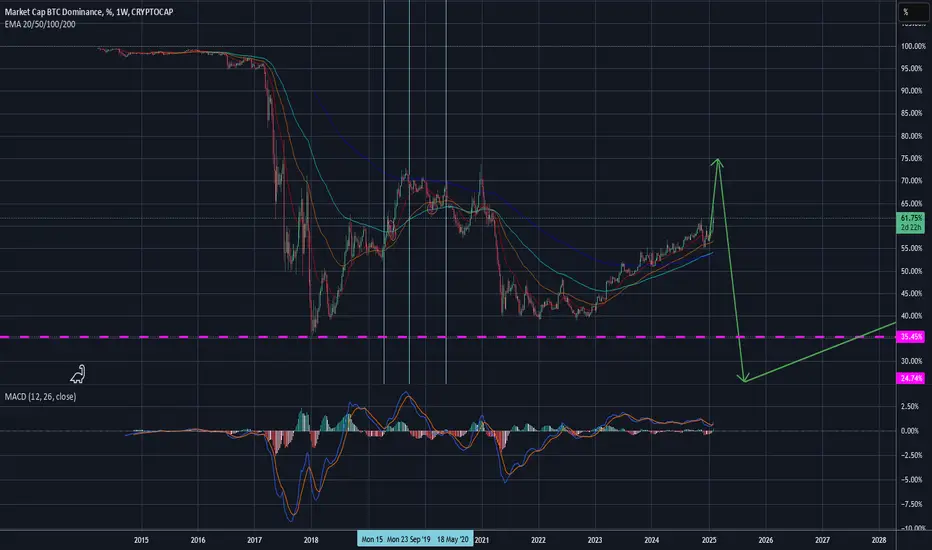
BTC.D - No Gain without Pain
Hi,
Please see my BTC.d prediction for this cycle. My motto this cycle: No Gain without max Pain.
Cheers and goodluck
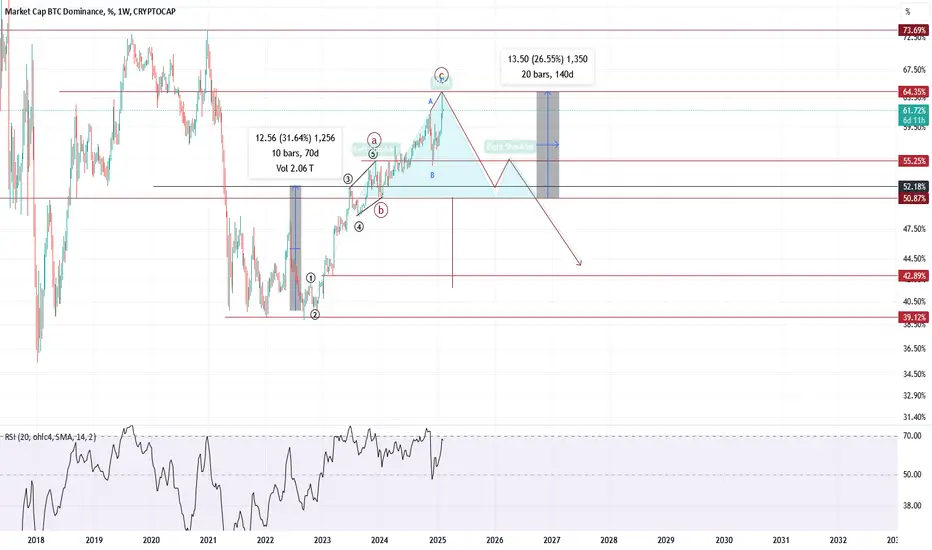
The Exact Target When Altseason Will Be Started Revealed!Hello, Skyrexians!
Recently we have already made analysis on CRYPTOCAP:BTC.D where pointed out that this Bitcoin season finally is about to end. Today we share with you our precise analysis of last dominance growth to understand when there is going to be the final reversal.
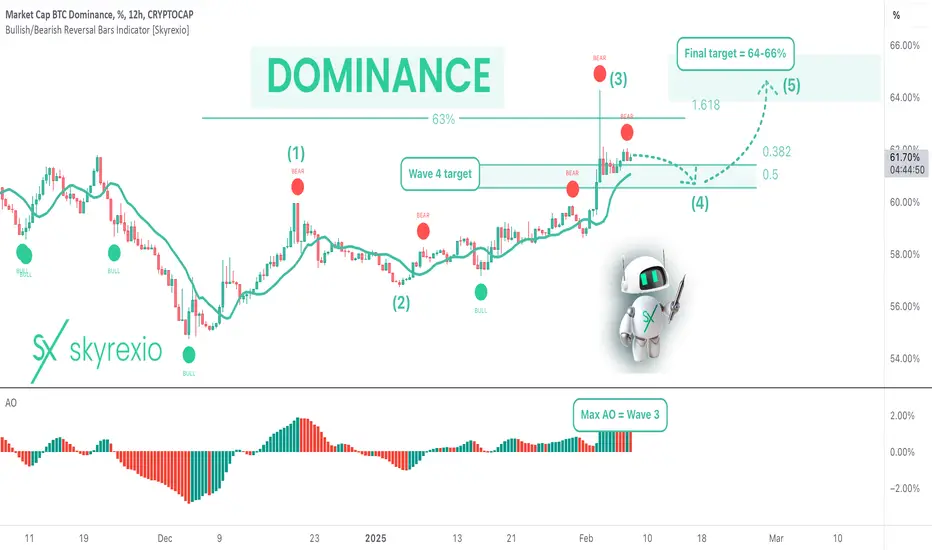
Let's take a look at 12 hours time frame. Here we can see that Elliott waves structure. It has pumped to the wave 3 target at 1.61 Fibonacci and then retraced in the wave 4. We expect consolidation between 61% and 62% for some time before the final growth in the wave 5. This wave will be finished approximately at 65%. The red dot on the Bullish/Bearish Reversal Bar Indicator and the bearish divergence with Awesome Oscillator are going to be the reversal confirmation factors.
Best regards,
Skyrexio Team
___________________________________________________________
Please, boost this article and subscribe our page if you like analysis!
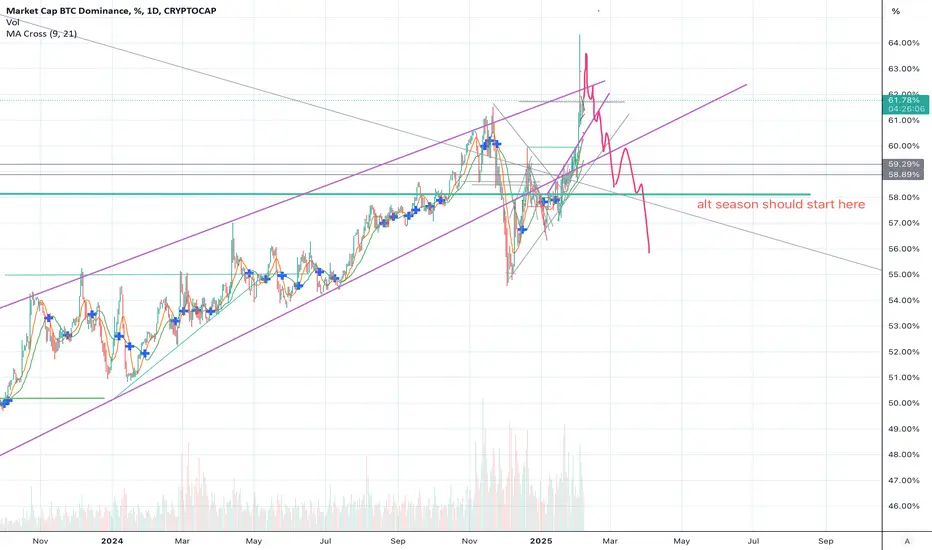
Altcoin Season 2025 Hello, traders 🐺
I hope you have been doing well over the past few months, enjoying the BTC season, and making significant gains on your BTC holdings. But now, as I predicted a few weeks ago , we are already at the top of the BTC.D percentage, and it's time for a correction, which will obviously lead to the Altcoin season.
So, make sure to read this idea until the end and follow me for upcoming updates!
As you might know, when BTC price starts to rise, the flow of money is usually much higher into BTC than into altcoins—even ETH itself. This naturally causes an increase in the BTC.D percentage, so it's no surprise to see BTC outperforming other coins.
However, this isn't the end of the story! If you understand the exact order of the bull cycle scenario, after a major shakeout in altcoins, we will see a top in BTC.D , which, in my opinion, is the best entry point for altcoins.
Right now, ETH itself is relatively cheap against BTC, which is a clear indication of the beginning of the altcoin season. So, after this idea, I will publish an analysis on ETH and reveal my price targets, which are absolutely insane and will blow your mind!
BTC.DI was wrong about the bottom on /BTC pairs.
The ability of whomever took the title "Spoofy" back in 2017 to flush these markets is greater than anticipated. Expecting blood in the streets before the bottom is in, followed by a major bounce.
Should be serious tumult in the markets in the days ahead.
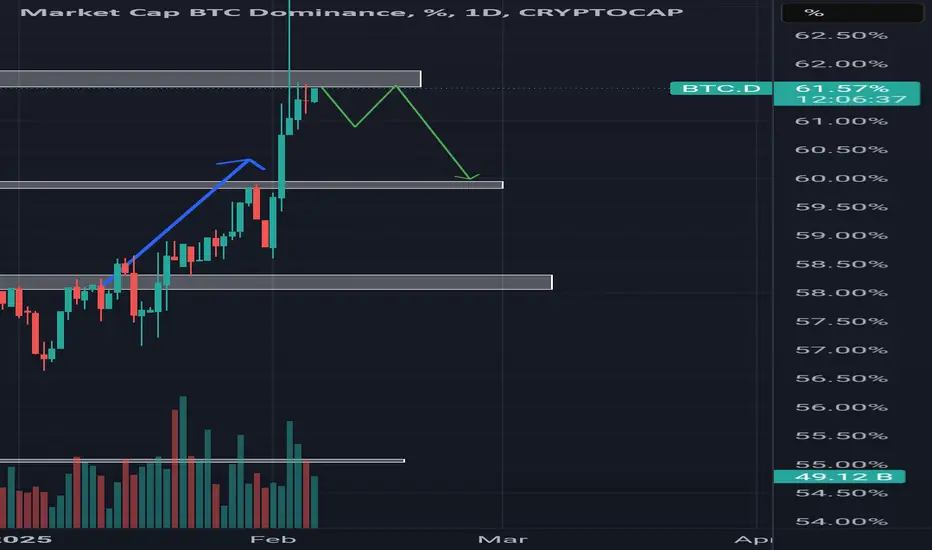
BTC.D Analysis:
🔸 Current Situation:
BTC Dominance (BTC.D) is trading at 61.58% and has reached a key resistance zone.
🔸 Key Support Zone:
If BTC.D faces rejection, the first strong support is around 60.00%.
🔸 Risk and Uncertainty:
If the 60% support fails, BTC.D could decline further toward 58%.
A strong BTC dominance usually puts pressure on Altcoins.
We'll keep updating if any major directional change occurs!
🐺 big dump before the altcoin season ? 🐺Hello my friend ! 🐺
Today I open up the chart and see something not honestly good for the market especially for altcoins but why ?
As you can see in the chart , we have ascending triangle which is a bullish pattern but bullish for the BTC.D and bearish for the altcoins and total crypto market , in this special case I can say if BTC.D break above the resistance line , we would defiantly see a massive dump in the altcoin and for the BTC itself we have 3 choices :
first one ; BTC rise and altcoins just playing around and don't move or small pump
secondly we could see a dump in a altcoin market itself
and the last option is a worse one ; we could expect a massive dump in the altcoins and BTC both ; in my opinion this is a possible because if we look back into the history of the BTC , we can see a significant dump before every BTC halving .
Have nice trades my friends ! 🐺