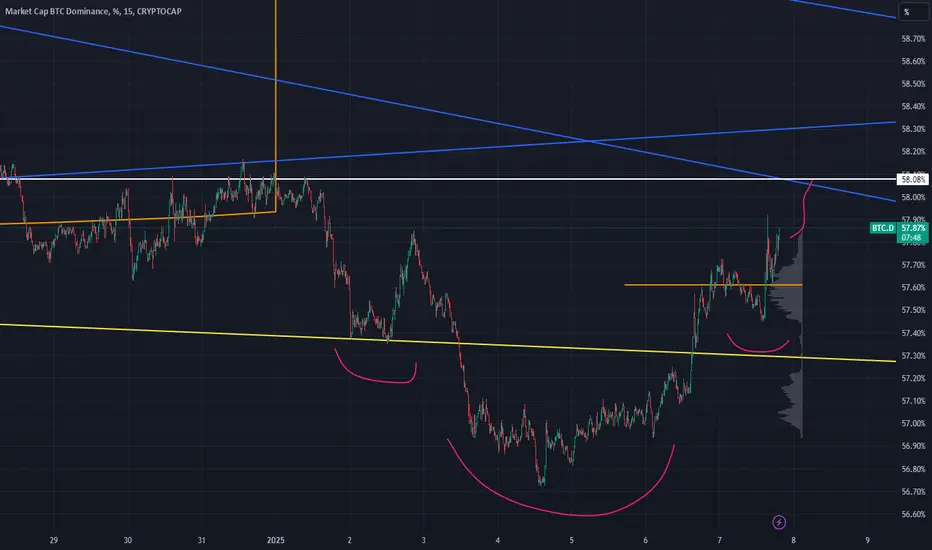
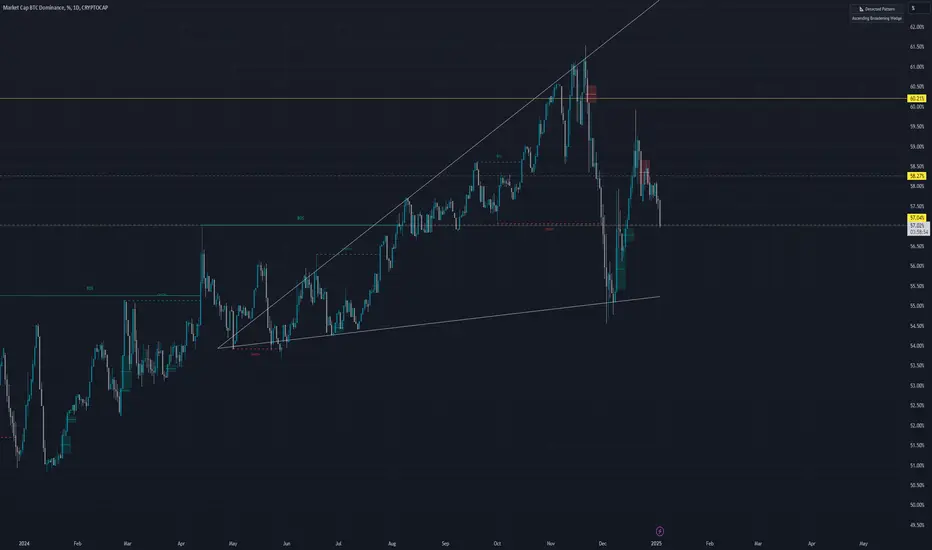
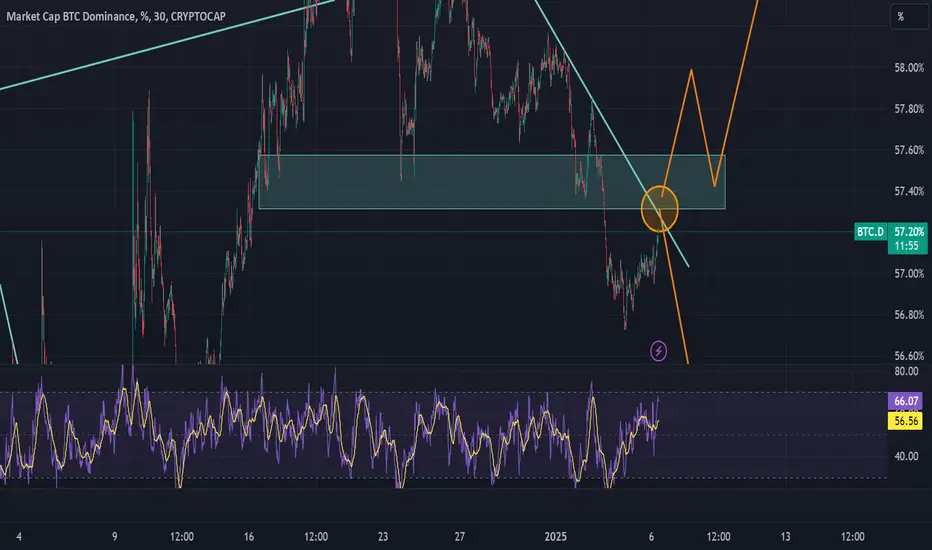
IHS on LTF for BTC.Das per title, on the short term timeframe BTC.D should go higher
where next we reassess when reach it
BTC.D trade ideas
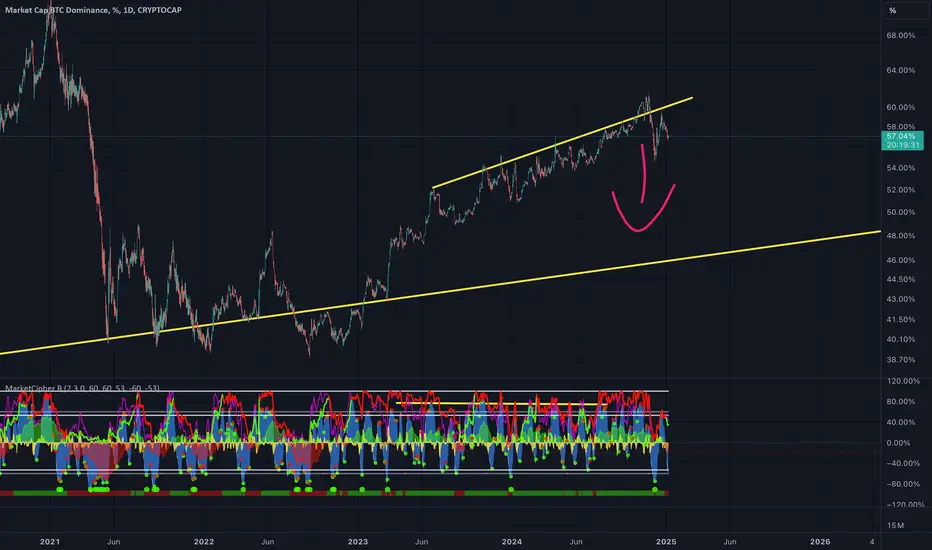
When is altcoinseason?
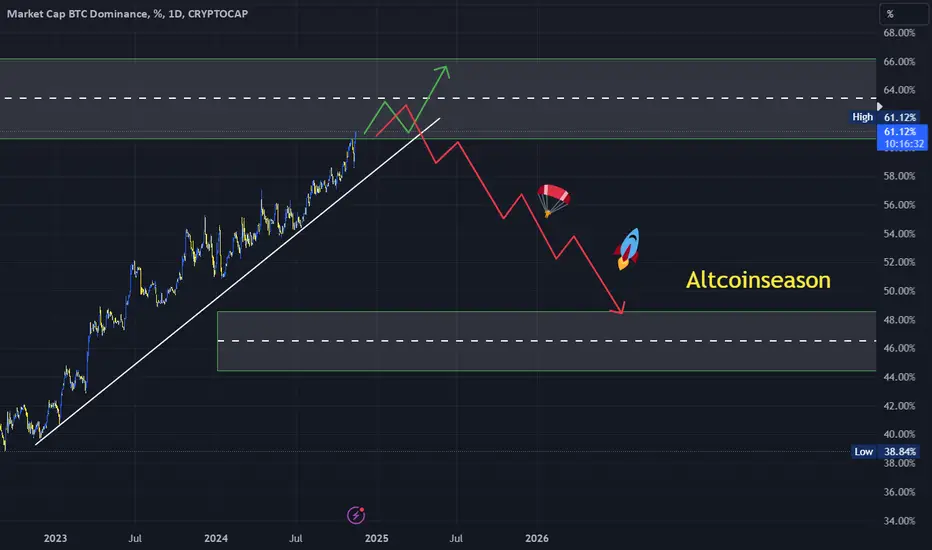
I think altcoinseason is getting closer.
We have to follow the trend line, the dominant one has already reached a sensitive area, it may go up a little more, even up to 66%, who knows, maybe even a little more, but when the trend line breaks, that's when we'll have the first serious signs from the start of altcoinseason.
It is quite difficult to reach the 70% area because the market in general has matured and matures from cycle to cycle.
BTC DOM VS USDT DOM!!TL:DR - ALTS GONNA BOOM IF BTC HOLDS.
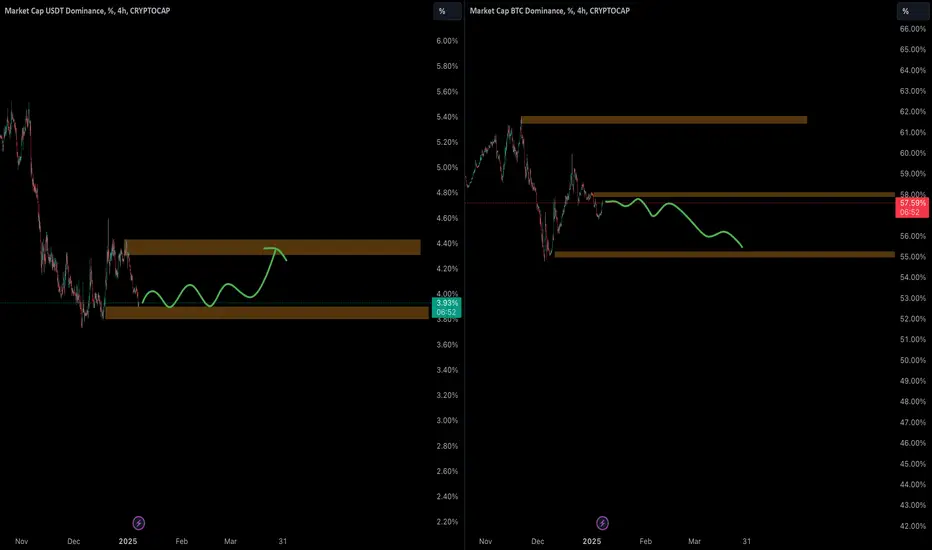
BTC dominance (BTC.D) and USDT dominance (USDT.D) with the following observations:
BTC Dominance (Right Chart):
• Current Level: BTC.D is at 57.62%.
• Resistance Zone: A marked resistance zone between 58.00% and 62.00%, indicating potential rejection if BTC.D rises into this area.
• Support Zone: A support zone is visible around 55.00%, suggesting BTC.D could drop to this level if selling pressure increases.
• Projected Movement: The green line indicates a potential drop and oscillation within the range, implying consolidation or retracement in BTC’s dominance.
USDT Dominance (Left Chart):
• Current Level: USDT.D is at 3.93%.
• Resistance Zone: Highlighted near 4.40% to 4.60%, showing potential rejection if USDT.D rises to this zone.
• Support Zone: Around 3.60%, indicating USDT dominance could fall to this level, with buyers likely stepping in.
• Projected Movement: The green line suggests a possible bounce from the support zone, followed by oscillation and eventual testing of the resistance zone.
Implication:
• BTC Dominance Drop: Indicates an increase in altcoin activity as funds move from BTC to other cryptocurrencies.
• USDT Dominance Rise: Reflects risk-off behavior, with traders holding stablecoins amid market uncertainty.
All we need now is ...MONEY $$ , Look at those resistance from the trendline or the incoming Fair Value Gap. We can get thru them only if $$ is flowing into them + Bear get short squeeze. We have the CHOCH on the Daily, the party has just started. Let's monitor it carefully
Possibly no alt season for now
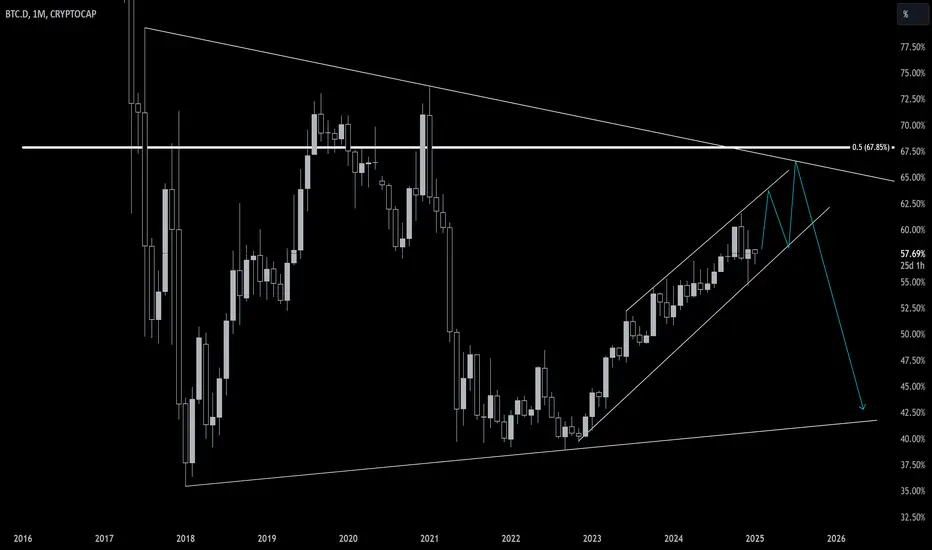
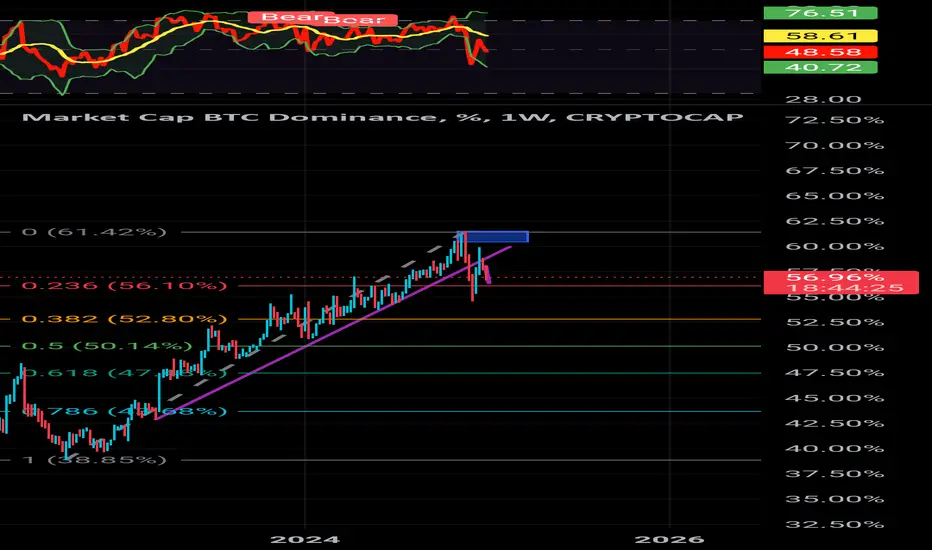
Greed indicator is at 76 and could be close to 80 tomorrow. The previous BTC dominance monthly candle closed in green and two daily candles are green so far. The BTC dominance may be moving towards 67% to hit 50% fib and the trendline.
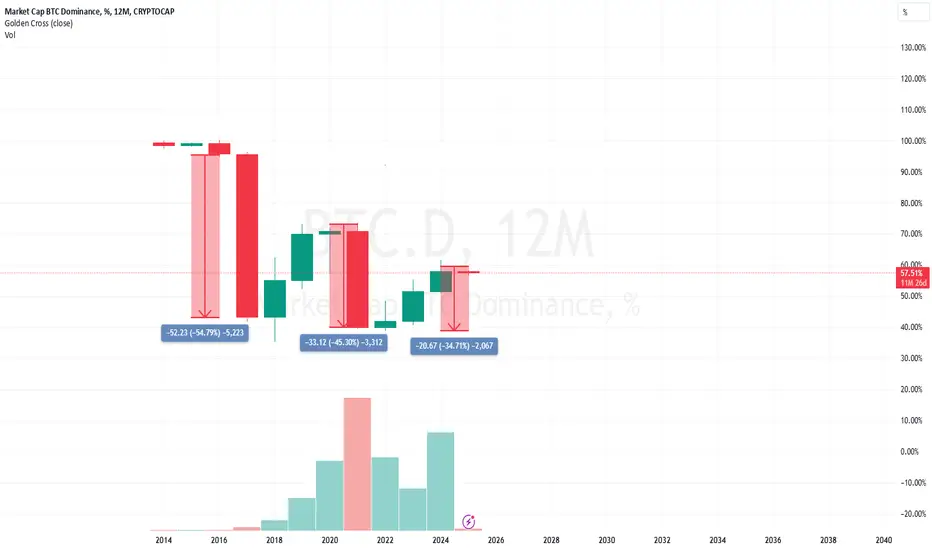
Next Alt sessionBTC.D tends to drop right after its halving cycle; this may be the last altcoin season.
BTC dominance reveals how to navigate crypto cyclesHello everyone,
this one is for patient (long-term) traders/investors, not for those chasing daily gains or short term swings.
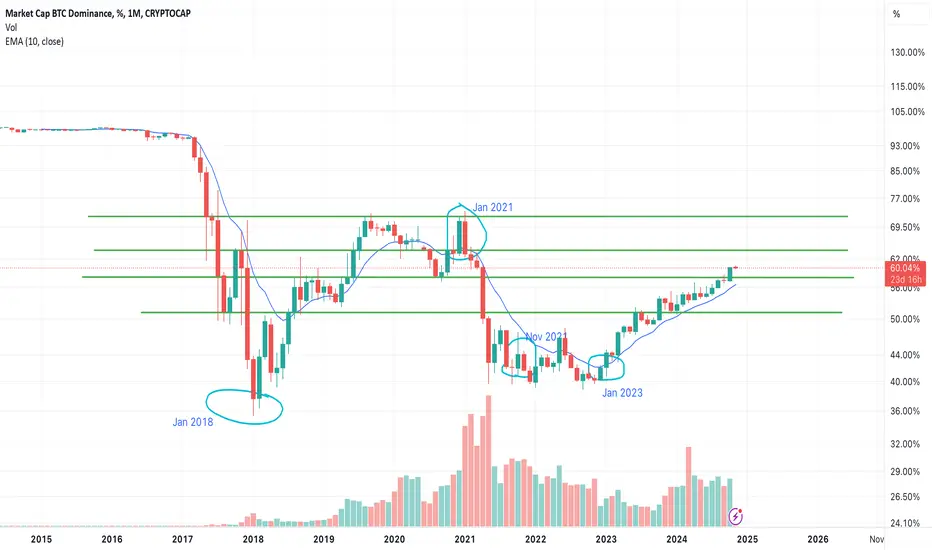
We are looking at BTC dominance chart. BTC dominance is currently at 60%, which is pretty high.
Everyone who follows cryptos for some time should know how crypto cycles work. BTC is king and always leads the way. BTC if the first one to start the bull run, altcoins follow. When BTC is near its peak, money transfers into ALTs --> start of ALTSEASON.
The first peak of altcoin season was January 2018. BTC dominance was at 35%. After Jan 2018 we went into a bear market. BTC dropped in value, ALTCOINS dropped even more. Consequently, BTC dominance went up.
BTC dominance reached top at 74% in Jan 2021. That is when ALTSEASON started.
THIS DOES NOT MEAN THAT BTC REACHED TOP in Jan 2021.
BTC rose from 40k to 70k between Jan 2021 and Nov 2021, but ALTs in this period made bigger gains.
BTC dominance in this period plummeted from 74% to 40%, creating a base for future.
From Jan 2023 BTC has been rising and increasing its dominance, currently sitting at 60%. I am positive it will not break high of Jan 2018. Next strong resistance is in the area of 64-67%, I expect dominance to reverse in this area.
BTC has already made a new ATH, but total crypto market space is not at an ATH yet. So ALTs are lagging in comparison to previous cycle.
I believe we are at the start of ALT season and I will be looking into ALTs for my last gains this cycle. Check my other posts to see which ALTS I am considering. I will also be posting some other ALTs in coming days/weeks, so subscribe to stay notified.
Good luck to everyone.
Crucial area for BTC dominance ! Altcoins prediction ?We are in a very important zone in terms of BTC dominance. A retest with an extension of the downtrend would be a new boost for Altcoins. However, an upward break of this zone would be a bad sign for Altcoins in the short term.
Bitcoin Dominance to fall & the 10K Eth run to commence CRYPTOCAP:ETH is set to have a fantastic year this year with SIX:BTCD set to to start slowing down & eventually fall letting the long awaited CRYPTOCAP:ETH run to 10K start
ALTSEASON within Q1 of 2025?Many of us have been anticipating an altseason, especially considering it's been about 3 years since the bull run began, yet we still haven't experienced a significant one. Several factors seem to be holding it back, including high Bitcoin dominance, delayed institutional interest in altcoins, weak altcoin fundamentals, and challenging economic and macro conditions, such as elevated interest rates and recession fears, which limit speculative investments in riskier assets.
However, my analysis suggests that an altseason may emerge within the 𝐖 wave and this phase could provide a glimpse of an altseason, potentially lasting around 90 days, or within 𝐐𝟏. Following this, we may enter a larger corrective phase during the 𝐗 wave, presenting a generational buying opportunity. This setup could pave the way for another altseason during the next leg down in the 𝐘 wave.
𝐃𝐢𝐬𝐜𝐥𝐚𝐢𝐦𝐞𝐫 : The information provided here is for educational purposes only and should not be considered as financial or investment advice.

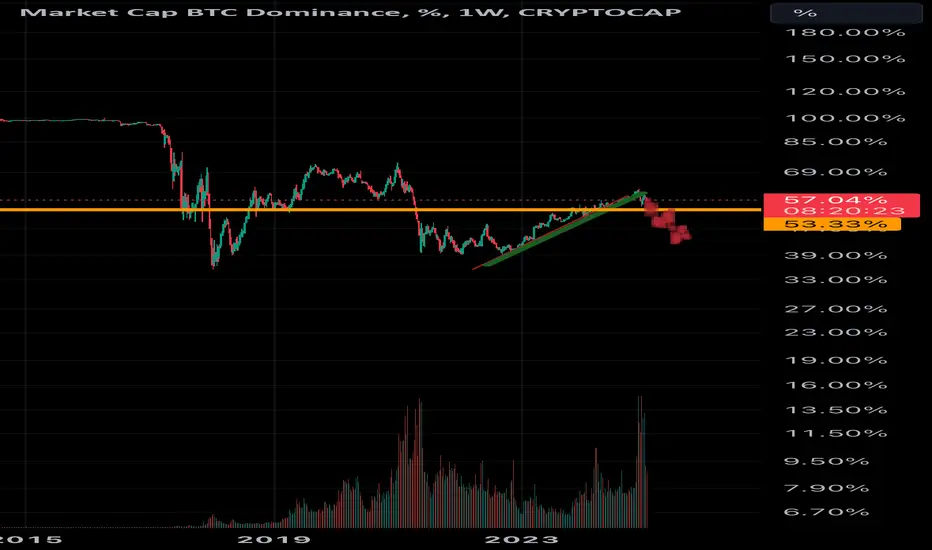
BTC.D Clear Downside - Alt Season is here.Here you can see the rejection. Its monthly time frame. It Means 4-6 months will be good for alt coins. DYOR. Not a financial advice.

BTC Dominance vs USDT Dominance on breakoutBullish cup and handle pattern on BTD Dominance / USDT Dominance ratio chart on a daily basis.

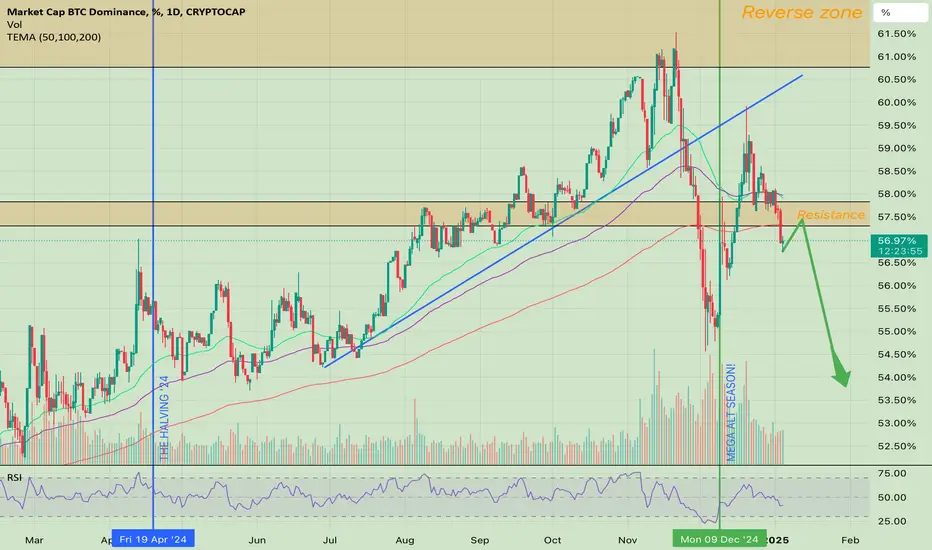
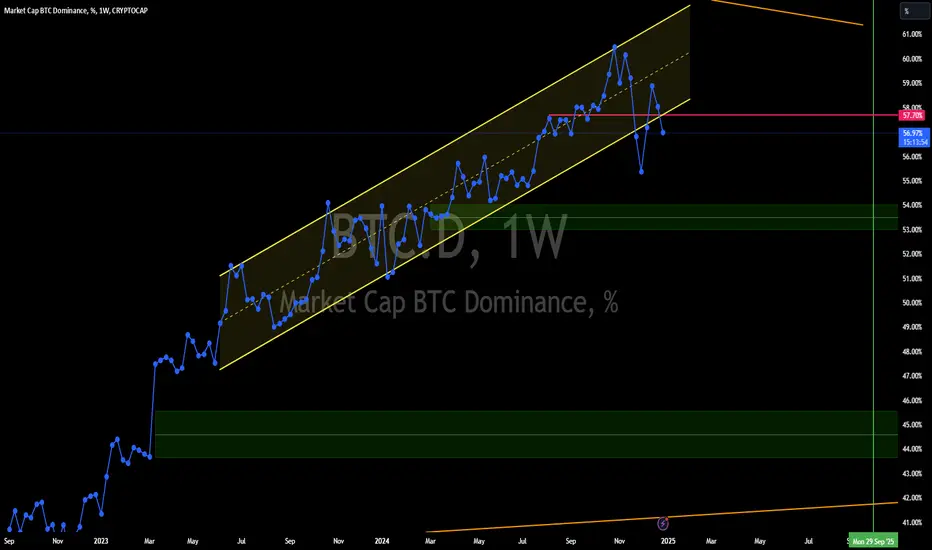
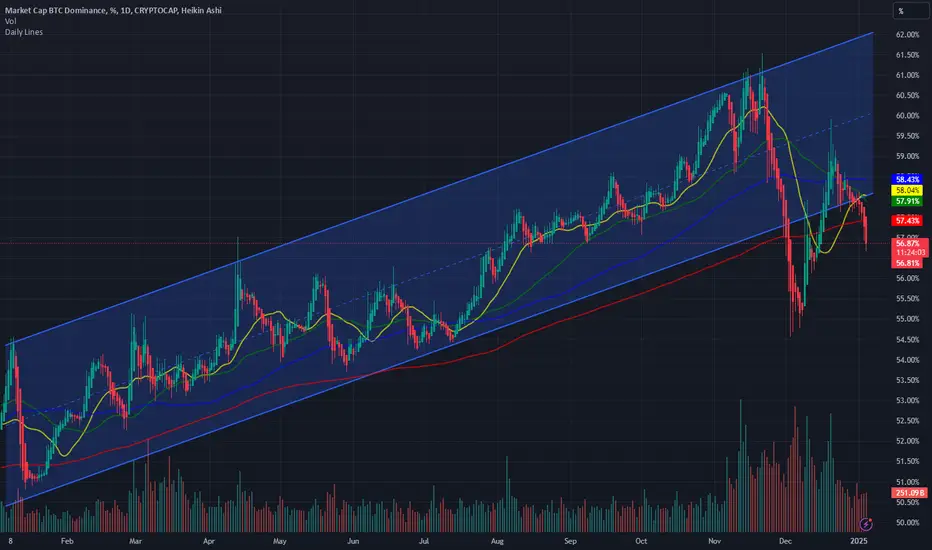
BTC Dominance: Breaking the Channel or Staying Strong?Bitcoin's dominance continues to climb within a well-defined ascending channel. However, recent volatility has brought it close to critical resistance levels around 57.7%. A breakout above this could signal continued BTC strength, but a rejection might lead to a pullback towards the green support zones at 54% or even 50%. Is this dominance trend sustainable, or are we due for an altcoin season? Share your analysis and insights below!
BTC.D down 38%The bullish trend of Bitcoin dominance has been broken and successfully tested on a weekly basis. It is expected to reach 38-40% by April, which will cause the price of altcoins to rise.
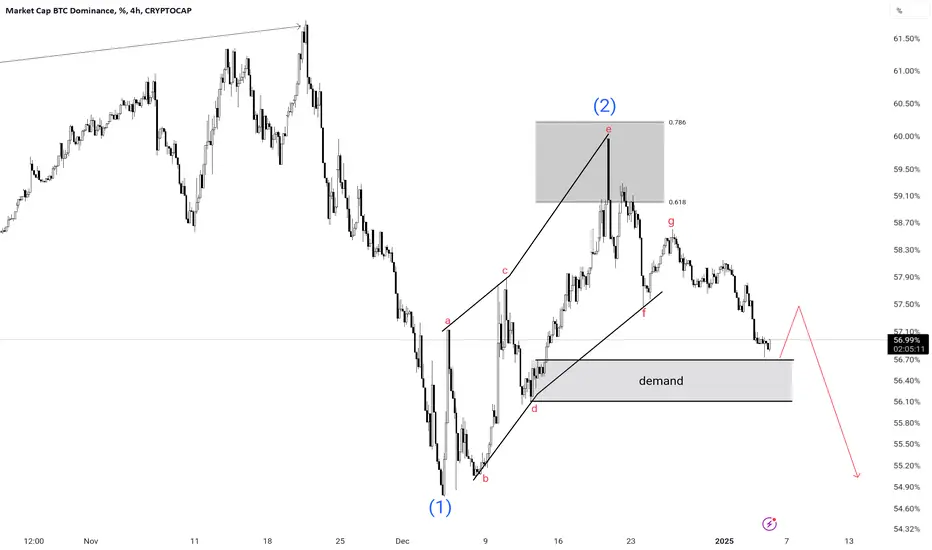
BTC.D update #BTC.D has completed a nice Elliott waves pattern named ABCDEFG this correction ended and now we are going to pass the demand zone and be ready for the next drop !
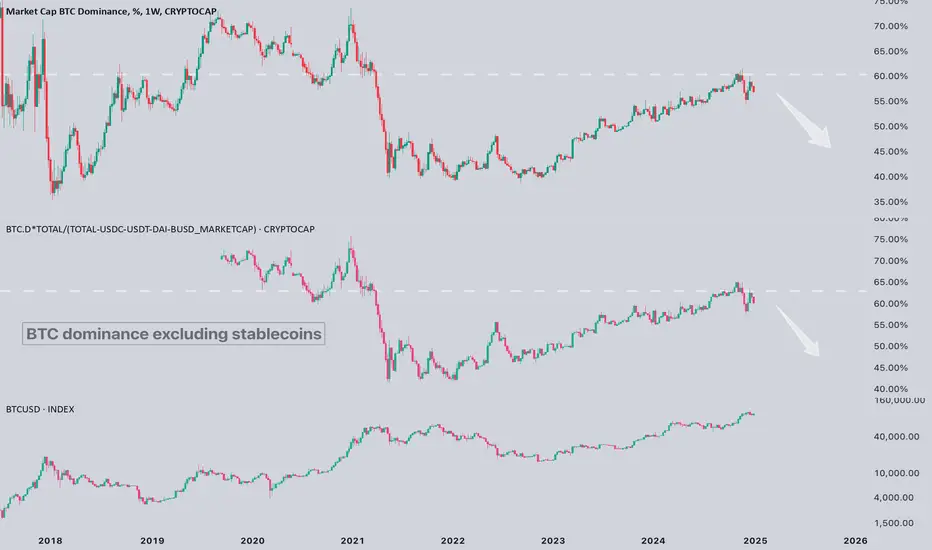
Bitcoin Dominance vs. AltcoinsBitcoin dominance is an extremely important parameter for traders and investors.
It marks the beginning or end of altcoins season!
CRYPTOCAP:BTC.D
Bitcoin dominance is an important metric for understanding the overall health of the cryptocurrency market. As the most dominant cryptocurrency, it's an indication of the strength and popularity of the asset, and can be used as an indicator of the overall market sentiment. Therefore, investors need to monitor Bitcoin dominance to gain insights into the current state of the market.

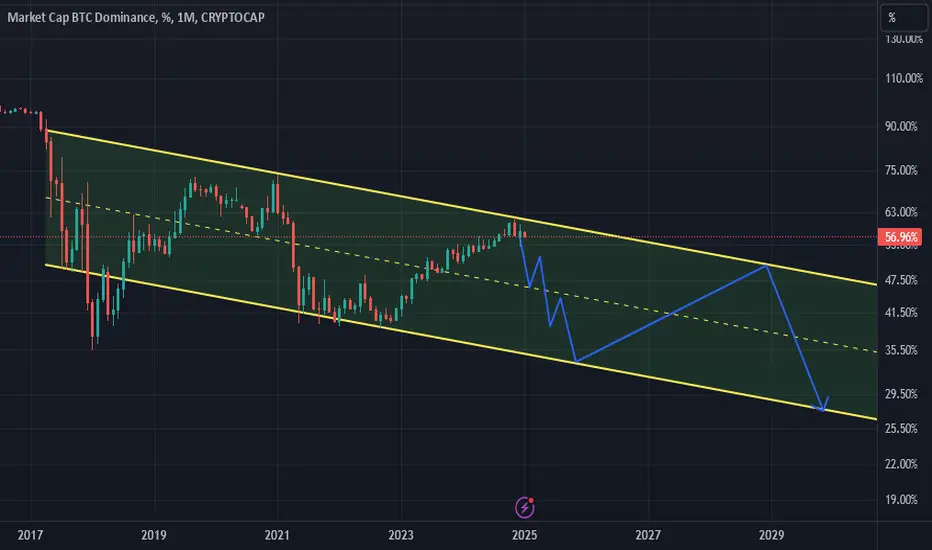
The Altcoins party is getting started!I believe that we'll be having one of the strongest alt seasons in the upcoming months, maybe similar to 2017.
I expect a drop to the Jan 2018 low or even lower before rising to 50% by 2028. I'll try to update this idea all the way to the next cycle.
Bitcoin Dominance#Bitcoin Dominance or When Will Altcoins Grow?📈
As I said before, the 65% mark is very likely the peak of Bitcoin dominance.
📝If we look at where we can expect the bottom of dominance, I would say something around 45%, a little higher than in the last cycle.
💡This is a good time to pour some liquidity into fundamentally strong alts. If you lack quality tools, welcome to Feels Strategy.
BTC DOMINANCE (4H) UpdateThis analysis is an update of the analysis you see in the "Related publications" section
From the point where we placed the red arrow on the chart, Bitcoin dominance correction has started.
After completing wave A, the price entered wave B.
Wave B appears to be a diametric, and we are currently in wave f of this diametric.
It seems that one wave g of this diametric remains, which could extend until December 31, 2024. From January 1, 2025, this index may experience a decline. This date aligns with when Trump takes office, bringing various plans for the crypto market.
If a weekly candle closes below the green zone, this scenario will be invalidated, and Bitcoin dominance will likely experience a more significant drop.
For now, this is our perspective on Bitcoin dominance.
For risk management, please don't forget stop loss and capital management
Comment if you have any questions
Thank You

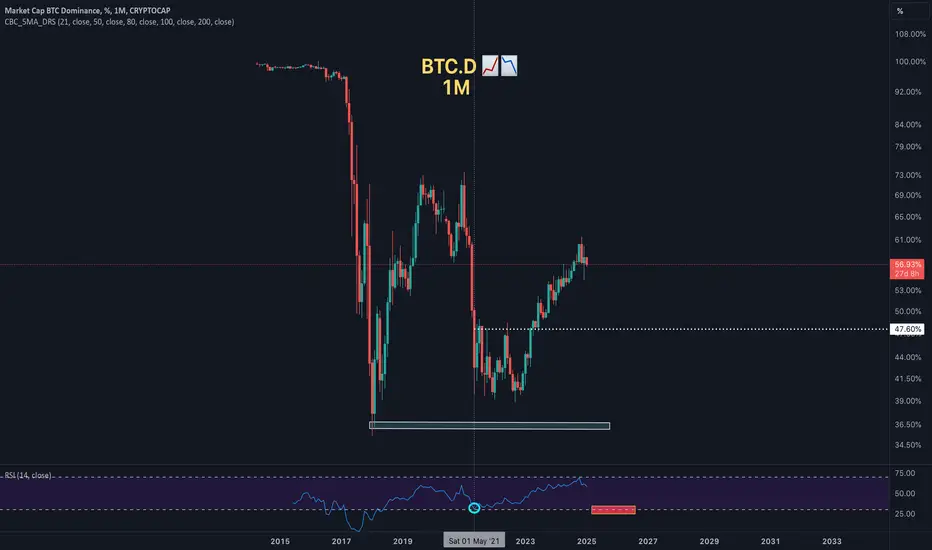
Bitcoin Dominance Monthly ChartBitcoin Dominance is primed for a decline, RSI is overbought already, Confirmation of the beginning of a decline if we close this month bearish
If we do get an alt season, an oversold RSI on the Monthly will be a good place to start taking profit and even closing all your altcoin position has an oversold RSI has signaled the end of alt season in the past
BTC Dominance chart broken pattern. BTC Dominance chart on a daily basis was on a upward sloping channel with higher highs and higher lows. But the chart has now broken down out of the pattern to the downside. May be 61% was peak for this cycle. What do you think ?
GLORIOUS Altseason in upon us?The #BTCdominance broke the resistance but couldn’t break the trendline to resume the uptrend.
Instead #Bitcoindominance created a lower high and it broke the support band. Reject again and we could see a GLORIOUS #Altseason.