BTC DOM wants to grab liquidity before fallBTC DOM wants to grab liquidity before fall. This means Dump for Alt coins is coming
BTC.D trade ideas
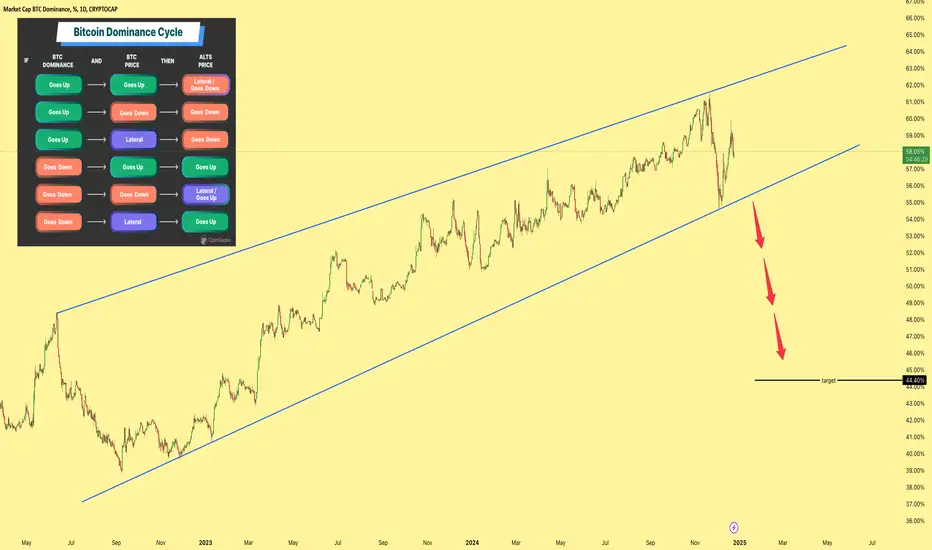
BTC.DI’ve attached a graph from coingecko, offering insights into when liquidity could shift into altcoins. The current bearish pattern suggests a decline in Bitcoin dominance, signaling an impending flow of capital into the altcoin market CRYPTOCAP:BTC.D
BTC dominance activity and is Altseason coming!?Happy new year from now🥳
First of all i wish you best in 2025 and hope this year become cryptocurrencies golden time🎆
.
.
At this moment we can see swing in the markets and its normal do not afraid i suggest you if you buy Alt's and you hold it close your screen take vacation do not look market let it go chill with your family or by yourself✨
.
.
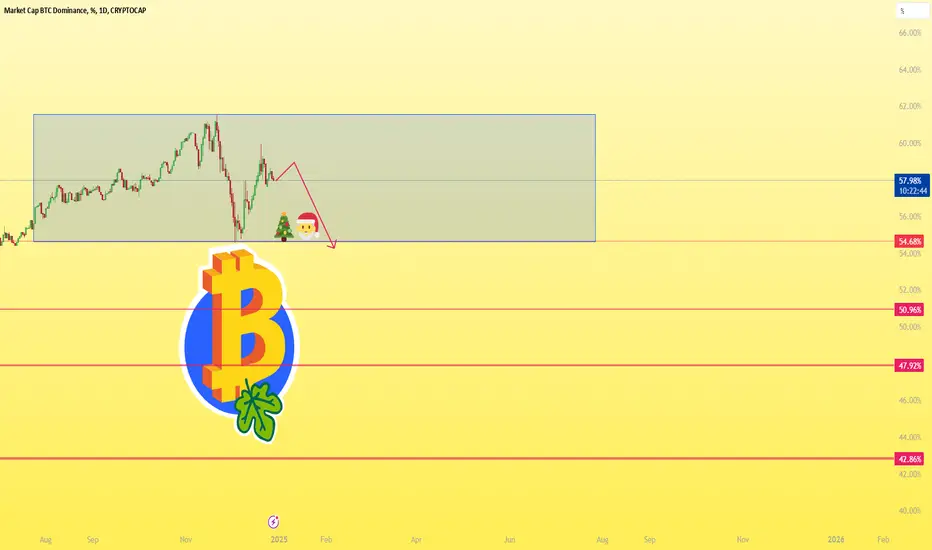
Market dosen't enough power(liquidity) to move upside or downside just range 'till vacations finish so i think ALtseason will happen but you shouldn't rush or FOMO buy step by step as i said 😉
.
🔻Red lines : support 1,sup 2 ,sup 3
🟦Blue box: ranging area
💎Hope you all the bests💝
It's almost 259 days from Bitcoin halving dateHistorically, the restart of QE is very near to post halving years on the 4th year of the cycle.
So is another Alt season coming? 3rd time's a charm.
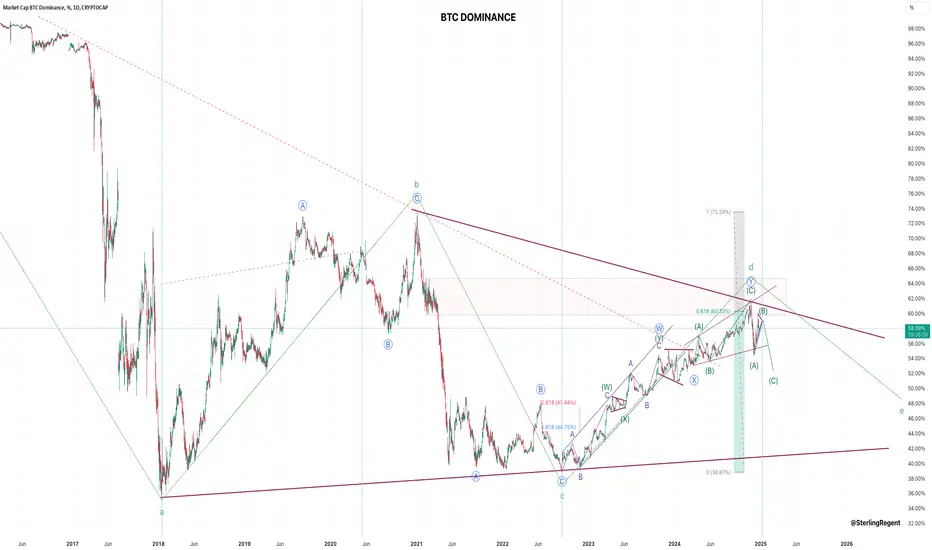
BTC.D Elliott Waves AnalysisHello friends.
Please support my work by clicking the LIKE button👍(If you liked).
Everything on the chart.
Waiting for decreasing in 48-50% zone
Cancellation of setup - 62%
ALWAYS follow ur RM
risk is justified
It's not financial advice.
DYOR!

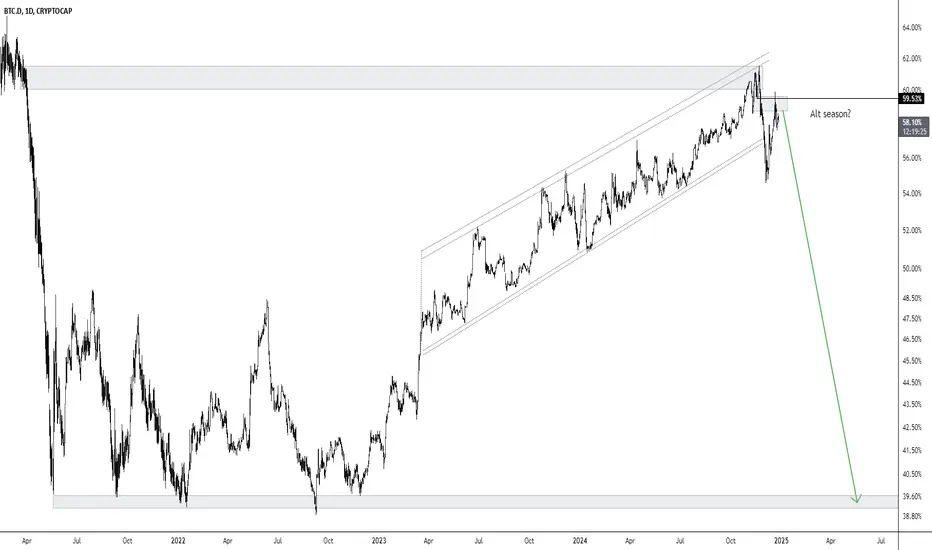
Alt season?BTC.D looking ready to roll to the downside after breaking structure out of the channel and completing a re-test. Hopefully alts will get their turn in this bull run now.
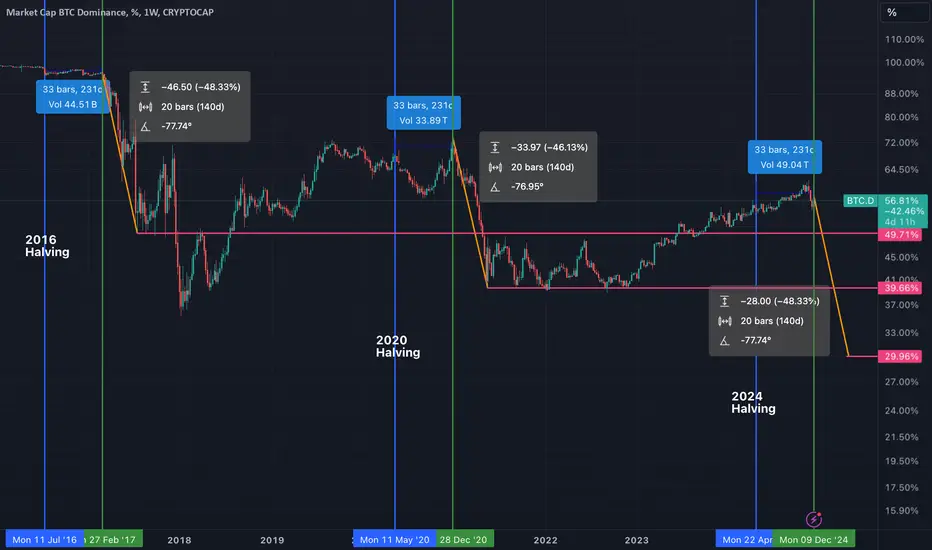
20 WEEK ALT SEASON IS STARTING!!After every halving there was 33 week consolidation area and after that 20 week altcoin season with nearly %46-48 drop rate. Target is %30
SOON btc.d diedwhat u think ?> for this btc.d analyst
🎯
Market seasonality during holiday period
Potential alt-season impact on BTC dominance
Macro events affecting crypto market structure
💡 Trading Recommendation:
Monitor price reaction at 55% support - crucial level for maintaining bearish thesis. Consider risk management strategies around projected volatile moves.
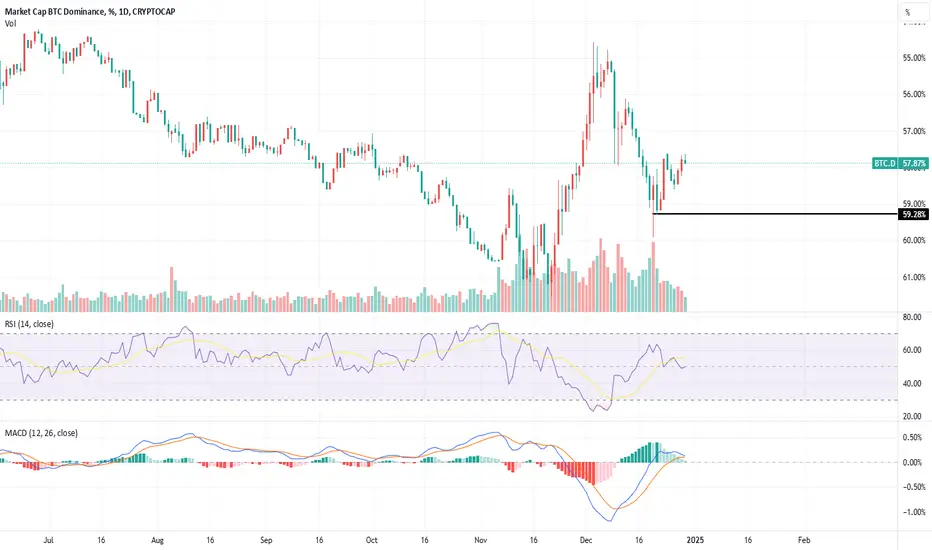
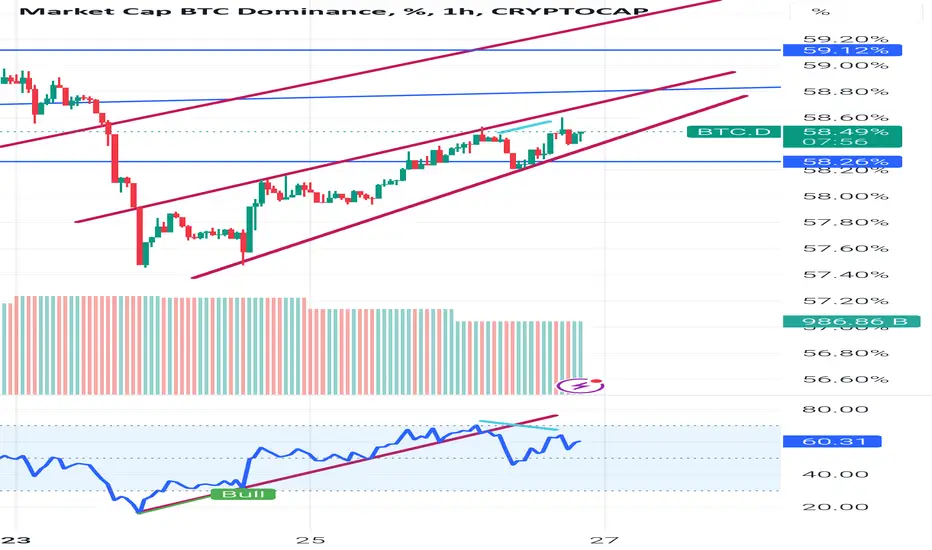
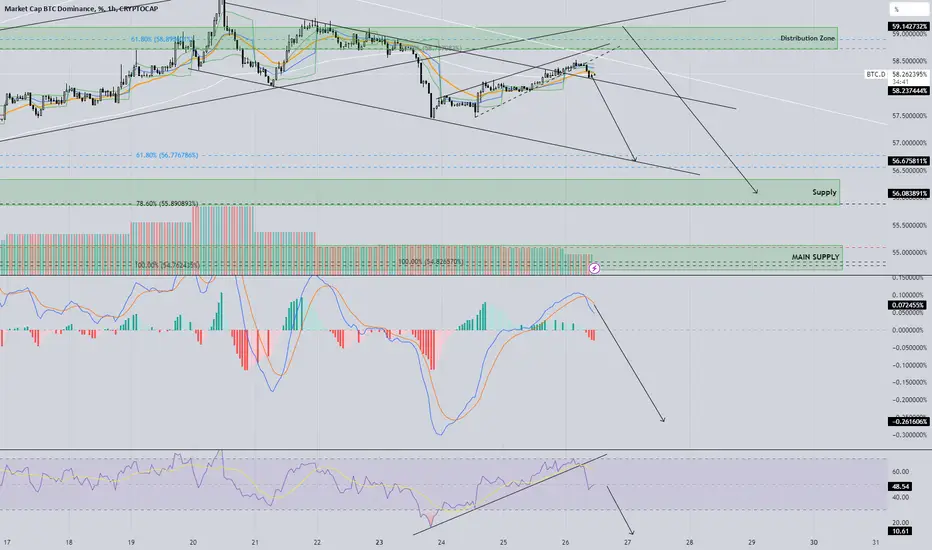
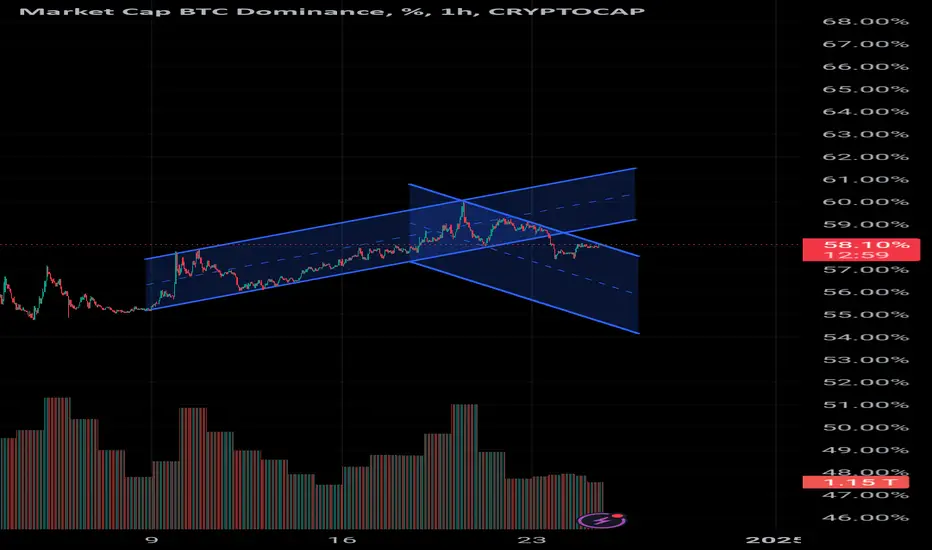
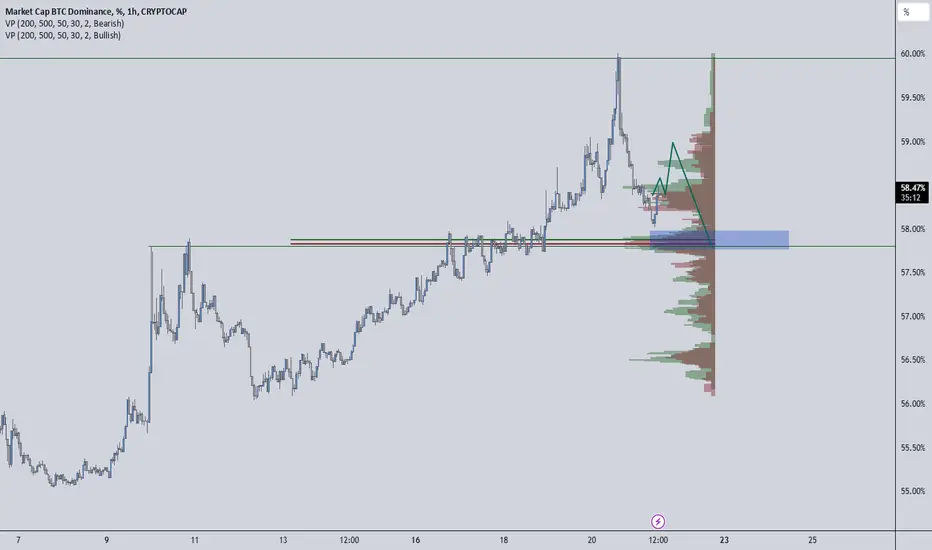
BTC.D Bearish chanelBTC Dominance is moving upwards in bearish chanel with a bearish divergence in 1h time also RSI break through trendline and retesting volume is not seen much if breaks above can test 59.12 is fib 0.61 level or if break this bearish chanel can drop from here from 58.30.
ALT season LOADING.........Since we see the BTC.D retested the rising wedge after a break out, and a regular bearish divergence in the daily time frame, we might see a serious bearishness of up to 20%. For that, the ALTS will be PUMPED.

Dominance decline - Is it a beginning of the alt season yet ?Dominance is falling, but is this really the beginning of the altcoin season?
Or maybe reaching the bottom on BTC at around $89,000 and only then it will officially begin?!
Leave your thoughts !
BITCOIN DOMINANCE - Clear chart , Clear dataYour trading struggles are summarized in this chart
weekly chart displays breakout a massive rising wedge pattern and now retesting...
Everything is fine as long as you’ve bought your coins at good prices.
All this struggle is simply summarized in this retest.
What’s expected is strong price fluctuation until mid-January, after which things should settle down.
If you’re out of the market and looking to enter, try to do so during the next correction

WTF is this? BTC.D can anyone explain about this ????? this movement killed all traders . really wtf is this ?????

Start of the alt season ? With the fall of the dominance of Bit from the desired point, we have the beginning of the second wave of growth of altcoins
and this point could be the beginning of the alt season
Example of Interpretation of USDT, USDC, BTC.D, USDT.D
Hello, traders.
If you "Follow", you can always get new information quickly.
Please also click "Boost".
Have a nice day today.
Trading Strategy
-------------------------------------
(USDT 1D chart)
USDT is a stable coin that has a great influence on the coin market.
Therefore, the gap decline of USDT is likely to have a negative impact on the coin market.
Since the gap decline means that funds have flowed out of the coin market, it can be interpreted that funds have currently flowed out through USDT.
(USDC 1D chart)
USDC cannot help but have a lower influence on the coin market than USDT.
The reason is that USDC markets are not operated in all exchanges around the world.
In other words, USDC can be seen as having limitations compared to USDT as an American investment capital.
Therefore, the gap increase of USDT is likely to have a short-term impact on the coin market.
----------------------------------
(BTC.D 1D chart)
You can refer to BTC dominance to choose which side (BTC, Alts) to trade in the coin market.
Since the rise in BTC dominance means that funds are concentrated on BTC, it can be interpreted that Alts are likely to gradually move sideways or show a downward trend.
For this interpretation to be meaningful, USDT dominance must show a downward trend.
(USDT.D 1D chart)
Because the decline in USDT dominance is likely to result in a rise in the coin market.
Therefore, if USDT dominance rises, it may be a good idea to pause all trading and take a look at the situation.
-
You can roughly figure out whether funds are flowing into or out of the coin market with USDT and USDC.
You can roughly figure out which direction the funds in the actual coin market are moving with BTC dominance and USDT dominance.
As I am writing this, BTC dominance is rising and USDT dominance is falling, so it is better to trade BTC rather than Alts.
-
Thank you for reading to the end.
I hope you have a successful trade.
--------------------------------------------------
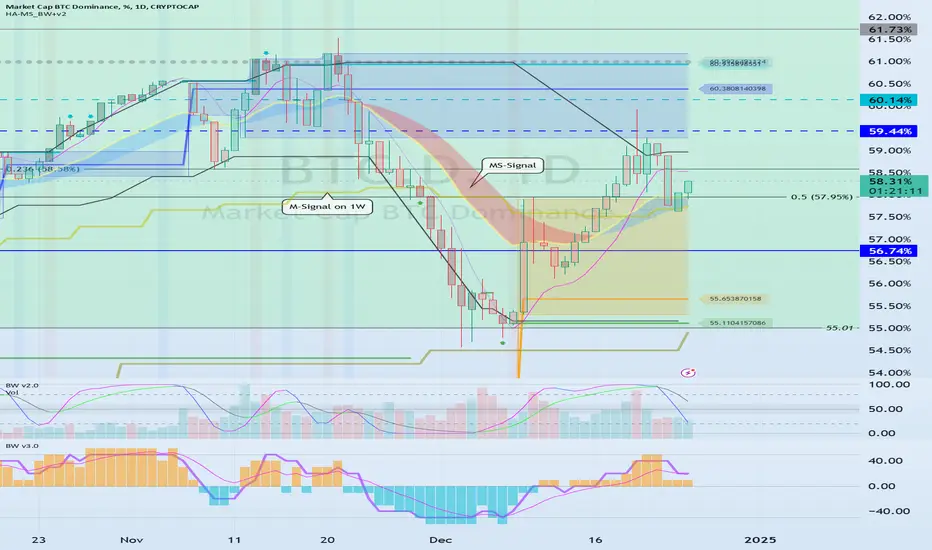
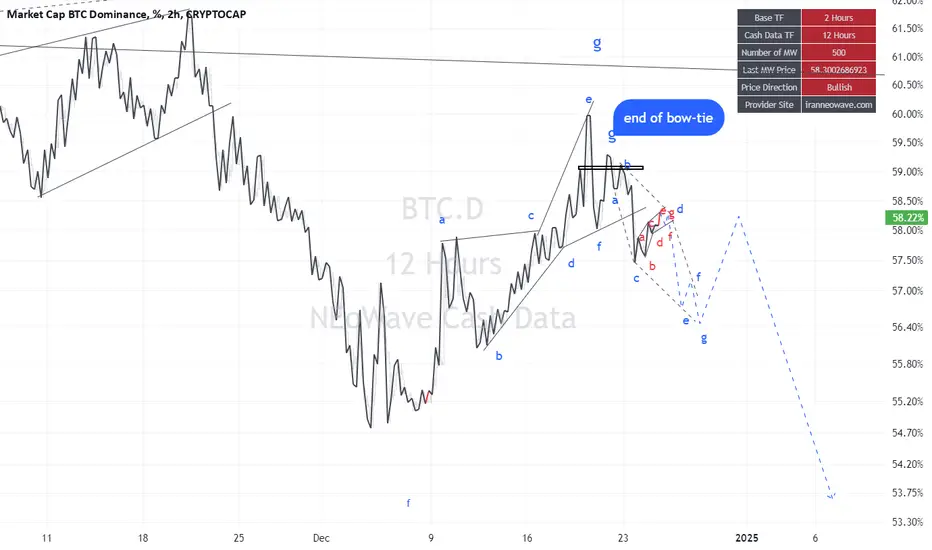
BTC.D(based on NEowave)there is a way for short term of bitcoin dominance that it needs time to show himself.
I think diamond diametrical is fine for now.
I will uptade it.
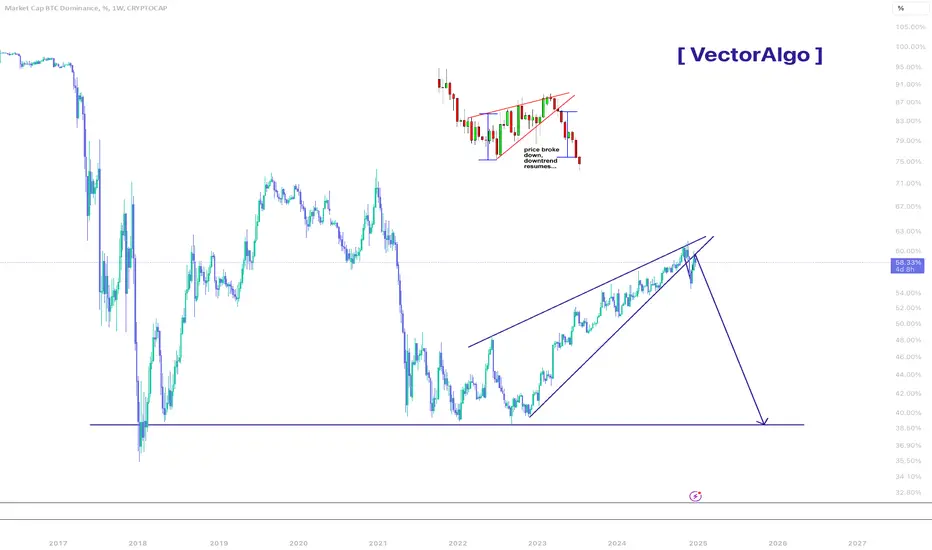
Bitcoin Dominance - Falling Wedge Broken - Altseason is here #BTC.D (Bitcoin Dominance) #Analysis
Description
---------------------------------------------------------------
+ Bitcoin dominance has formed a nice falling wedge pattern and support is broken successfully.
+ This was the moment that everyone was waiting for, in 2025 we are gonna see a huge bull run, greater than last bull run.
+ Falling wedge is a bearish pattern and the dominance has successfully broken down from the wedge and heading towards the next support at around 39% (This is gonna be a the peak of the alt season)
+ 2025 jan will be huge for altcoins.
---------------------------------------------------------------
Enhance, Trade, Grow
---------------------------------------------------------------
Feel free to share your thoughts and insights. Don't forget to like and follow us for more trading ideas and discussions.
Best Regards,
VectorAlgo
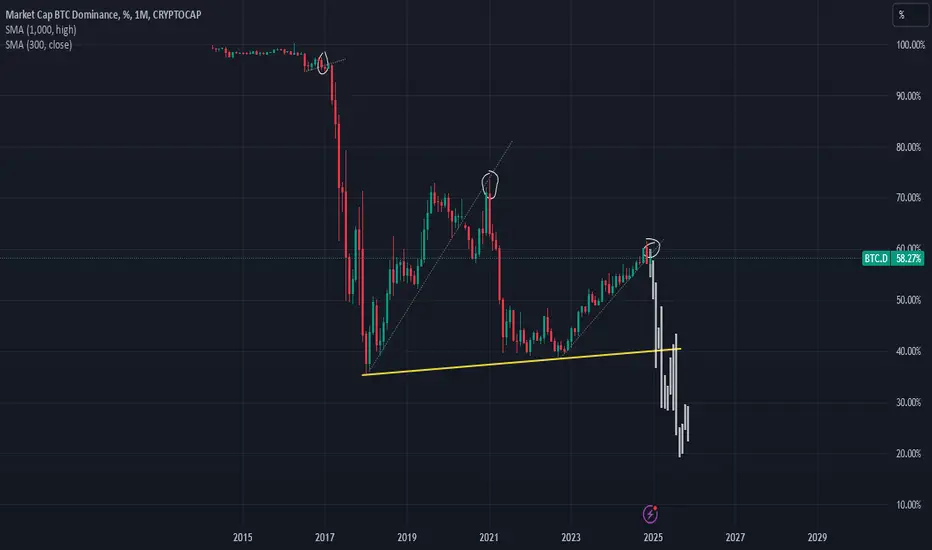
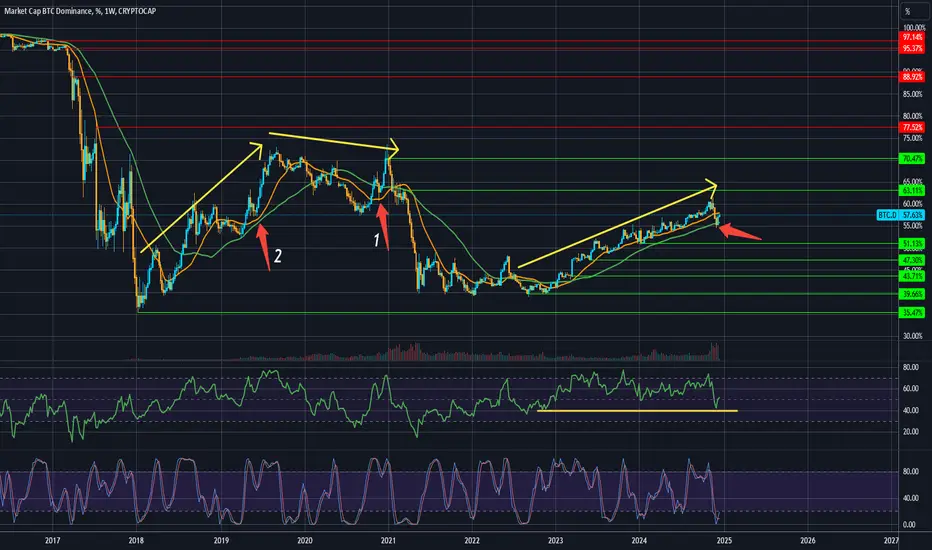
BTC.D has not topped out yet!Everybody is convinced that BTC.D has topped comparing it to arrow number 1.
What if we should compare it to number 2?
Overall movement direction is UP, not DOWN as it was in 2020.
BTC.D found support on 50MA and formed hidden bullish divergence on RSI.
63-70% dominance is levels to watch
Alt season is just around the corner#BTC.D #Analysis
Description
---------------------------------------------------------------
+ Bitcoin dominance had an unsuccessfull breakout from the resistance line.
+ dominance is around the resistance zone and now it is headed in the right direction
+ a drop in the bitcoin dominance will push the altcoin prices higher
+ if the dominance is headed in the right direction we can expect a altseason soon.
---------------------------------------------------------------
Enhance, Trade, Grow
---------------------------------------------------------------
Feel free to share your thoughts and insights.
Don't forget to like and follow us for more trading ideas and discussions.
Best Regards,
VectorAlgo

bitcoin dominance updated chart New chart updated by me
New parallel channel is shown
this candle is so important
if breaking up the channel so bitcoin grows up and if can't breaks channel and comes down to the midline then Altcoins grows up.
BTC Dominance is shifting in its cycle.
BTC apparently is going to lose some, or maybe even more, of the demand preference soon. There is a hope for Apr21 repetition with crazy pumps across the whole alts board.
BTC.D Analysis: Retest of Key Area Highly LikelyBitcoin Dominance Looking
Bitcoin dominance looks very strong but BTC has entered the range. So I think dominance may follow a calmer course for a while, a few coins that have separated from the herd may make good moves in these few days, but it is too early to claim that the general atmosphere is completely bullish, because SP500 seems to be making a deep correction and is giving signals of this. I do not buy anything during the New Year, and I will not buy, but then I will spend all of these corrections with buying because I believe that 2025 will be good.
A retest of this area in BTC.D (Bitcoin Dominance) seems very possible based on current market behavior. This level holds significance as a potential reaction zone for further movements.
Also, I see no point in saying that this view of dominance supports the blue box analysis I shared here:
Because when BTC goes down to blue box we will see an upside move on dominance then we blue box of dominance chart will support the price, we will see an upmove on both.
Key Points:
Current Setup: BTC.D is approaching a critical area of interest.
Retest Likelihood: Market dynamics suggest a probable revisit to this zone.
Focus: Monitoring the reaction at this level for future directional clarity.
If you think this analysis helps you, please don't forget to boost and comment on this. These motivate me to share more insights with you!
I keep my charts clean and simple because I believe clarity leads to better decisions.
My approach is built on years of experience and a solid track record. I don’t claim to know it all, but I’m confident in my ability to spot high-probability setups.
If you would like to learn how to use the heatmap, cumulative volume delta and volume footprint techniques that I use below to determine very accurate demand regions, you can send me a private message.
My Previous Analysis
🐶 DOGEUSDT.P: Next Move
🎨 RENDERUSDT.P: Opportunity of the Month
💎 ETHUSDT.P: Where to Retrace
🟢 BNBUSDT.P: Potential Surge
📊 BTC Dominance: Reaction Zone
🌊 WAVESUSDT.P: Demand Zone Potential
🟣 UNIUSDT.P: Long-Term Trade
🔵 XRPUSDT.P: Entry Zones
🔗 LINKUSDT.P: Follow The River
📈 BTCUSDT.P: Two Key Demand Zones
🟩 POLUSDT: Bullish Momentum
🌟 PENDLEUSDT.P: Where Opportunity Meets Precision
🔥 BTCUSDT.P: Liquidation of Highly Leveraged Longs
🌊 SOLUSDT.P: SOL's Dip - Your Opportunity
🐸 1000PEPEUSDT.P: Prime Bounce Zone Unlocked
🚀 ETHUSDT.P: Set to Explode - Don't Miss This Game Changer
🤖 IQUSDT: Smart Plan
⚡️ PONDUSDT: A Trade Not Taken Is Better Than a Losing One
💼 STMXUSDT: 2 Buying Areas
🐢 TURBOUSDT: Buy Zones and Buyer Presence
🌍 ICPUSDT.P: Massive Upside Potential | Check the Trade Update For Seeing Results
🟠 IDEXUSDT: Spot Buy Area | %26 Profit if You Trade with MSB
📌 USUALUSDT: Buyers Are Active + %70 Profit in Total
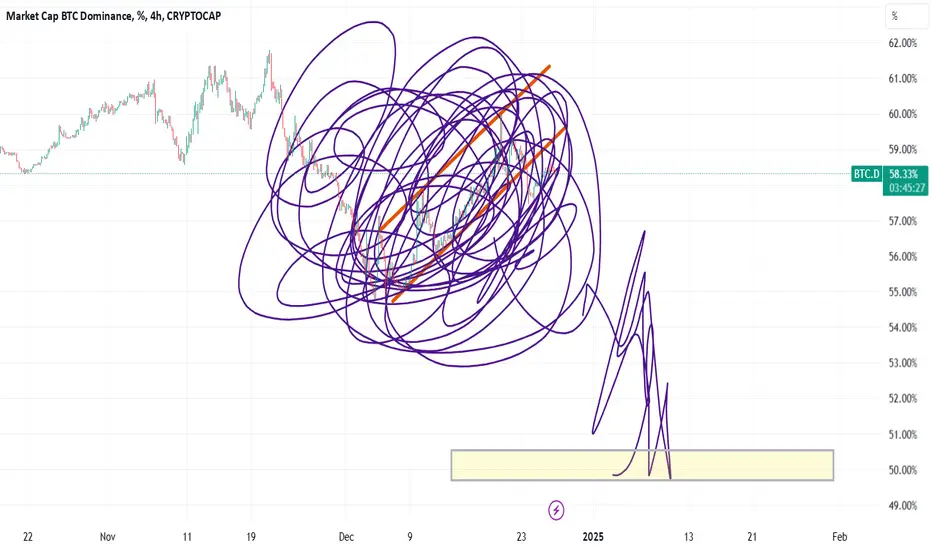
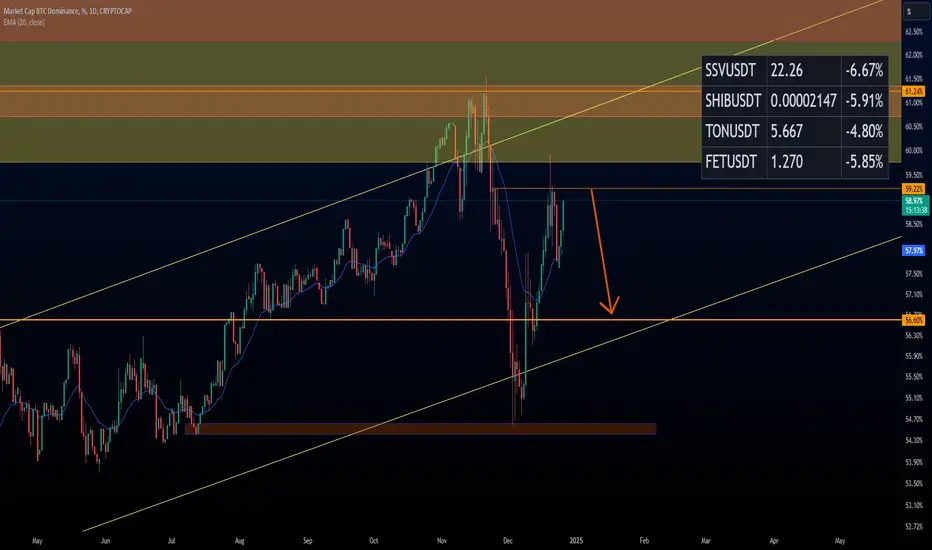
Let me analyze BTC.D FOR Q1 2025 TO YOUChart showing Bitcoin market cap dominance:
Key Technical Observations:
1. Current Trend Structure:
- The chart shows BTC dominance was in an upward channel (marked by yellow parallel lines)
- Recently broke down from this channel, suggesting a potential trend reversal
- Current dominance level is around 58.04%
2. Price Pattern Formation:
- The chart forecasts a potential declining pattern ahead marked by white curves
- Labeled as "LAST RE-TEST BEFORE ATLS" suggesting this could be the final retest before a significant move
3. Support Levels:
- There appears to be a key support zone around 55% (marked by purple horizontal boxes)
- The projection suggests a possible drop toward 50% level
4. Future Projection:
- The white wavy line suggests increasing volatility with lower highs and lower lows
- Final projection points to a sharp downturn (purple curved line) heading into January 2025
Trading Implications:
- The breakdown from the upward channel could signal weakness in Bitcoin's market dominance
- Traders might want to watch the 55% support level carefully
- The analysis suggests preparation for increased volatility and possible further decline in BTC dominance
Keep in mind that this is technical analysis and projections may not play out exactly as charted. Always use proper risk management in trading decisions.
💡 Trading Recommendation:
Monitor price reaction at 55% support - crucial level for maintaining bearish thesis. Consider risk management strategies around projected volatile moves.
