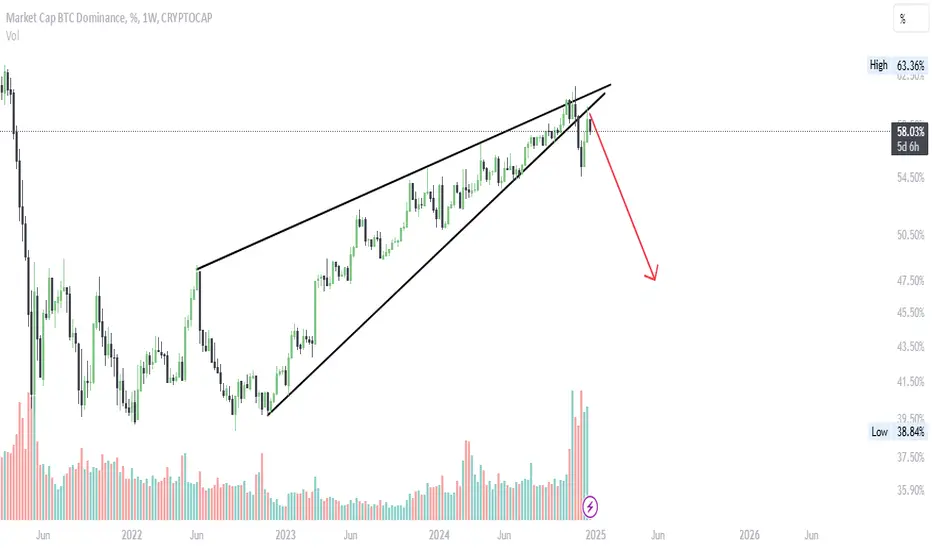
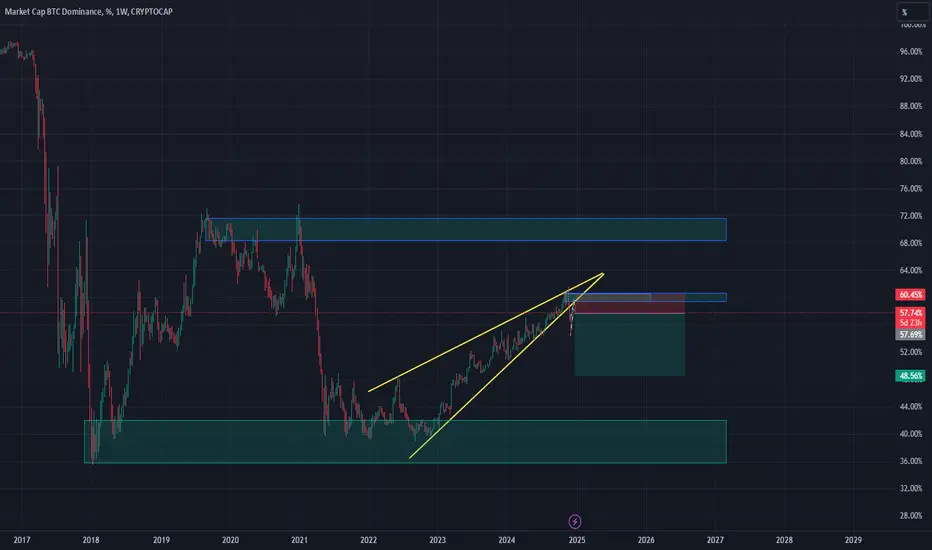
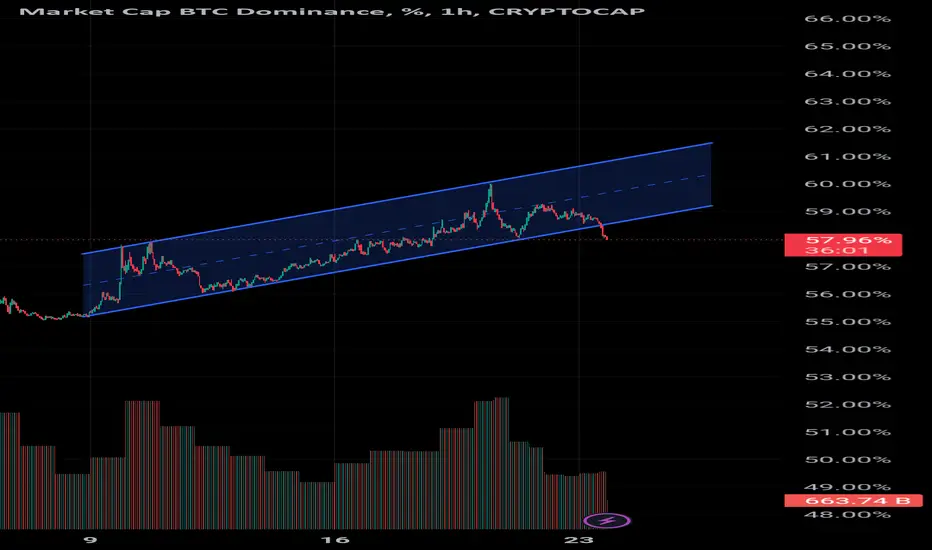
BTC.D Chart: A Bullish Signal for Altcoin HoldersRight now, I can't find a better example of a rising wedge breakdown and retest on the weekly timeframe than on the BTC dominance chart. This is incredibly promising for anyone holding altcoins
Six months to glory for our alts !!
ETHBTC to the moon in Q1
BTC.D trade ideas
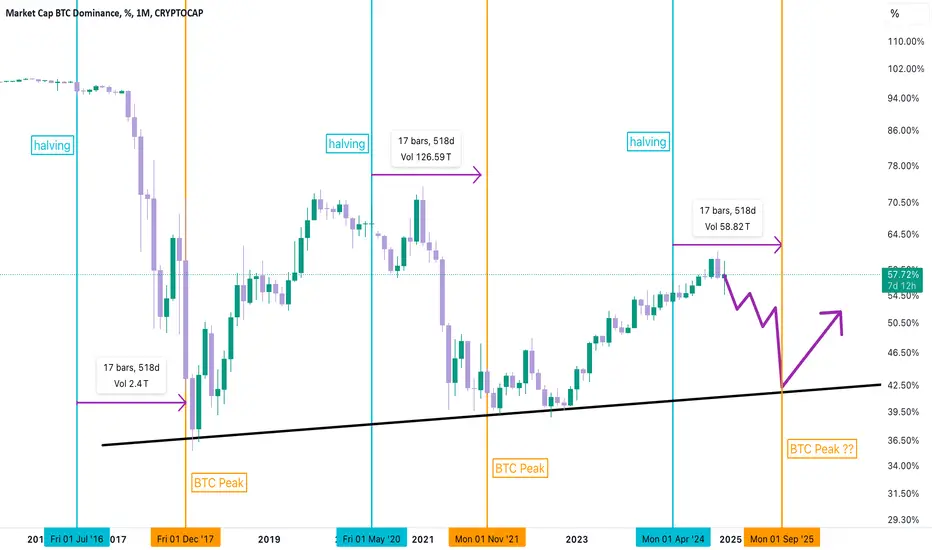
Bitcoin Dominance: Cycles and Post-Halving 2024 ForecastAn analysis of BTC Dominance in the context of market cycles and halving events. The chart highlights historical patterns of dominance decline following Bitcoin price peaks, which occurred 17 months after each halving. The outlined scenario suggests a potential return to key support (~41%) before a rebound.
Will history repeat itself? Let’s watch how upcoming market events shape BTC Dominance dynamics heading into 2025.
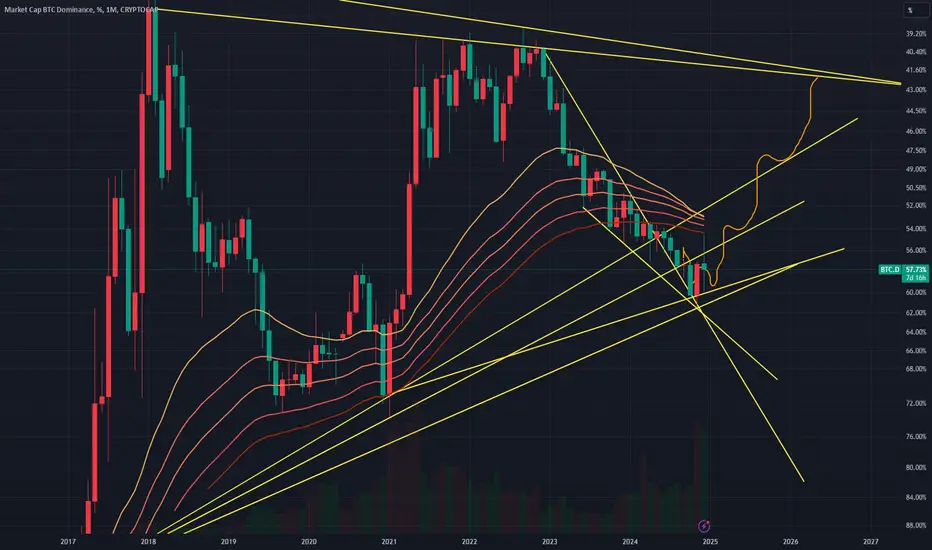
Confluence of supports to warrant drop in BTC.DBTC.D chart is very complex, but overall, poised for dropping (it's an inverted chart; hence drop looks like pump)

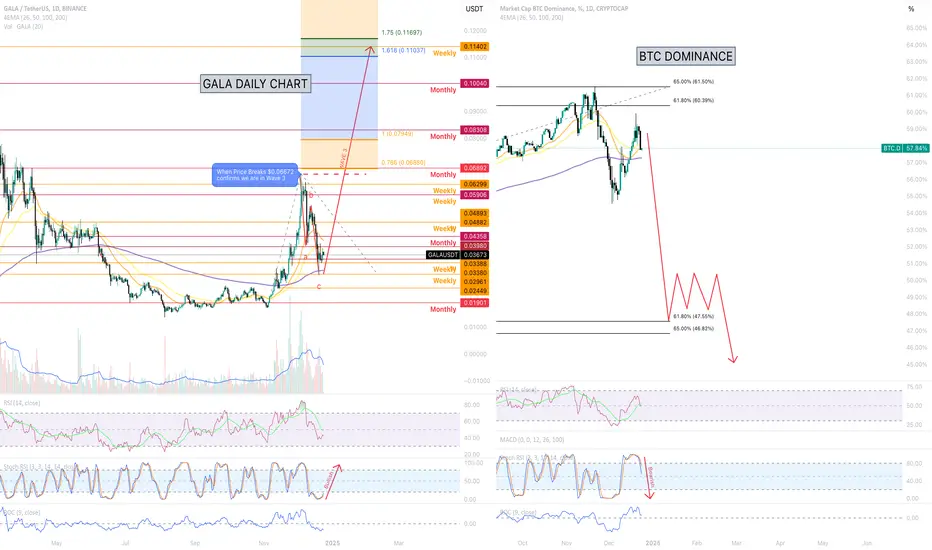
Bullish on Gala: My Updated PerspectiveWhen it comes to trading, my priority is always to protect my capital. If I have doubts, I don’t hesitate to step out of the market. As anyone in crypto knows, this space is notorious for wiping out gains quickly, and my focus is on preserving mine.
That said, today’s price action gave me the confirmation I needed to re-enter Gala and turn bullish on the altcoin market. Before diving into the factors that shifted my outlook, let’s revisit the concerns that initially kept me out:
Bitcoin’s bearish outlook: I feared it could drag down Gala and other altcoins.
Bitcoin dominance potentially invalidating my 0.618 Fibonacci theory.
High stochastic RSI on the weekly chart with a bearish crossover.
Now, let’s break down how today’s developments allowed me to rationalize these concerns and form a bullish bias for Gala and altcoins. I’ll also share additional confluence factors at the end.
1. Bitcoin’s Bearish Outlook: Will It Drag Down Gala and Alts?
Today I posted a detailed analysis on 'BTC Dominance' (please check it out for more context), but here’s a summary: In 2021, Bitcoin experienced a similar scenario, leading to a 31% correction. My outlook on Bitcoin remains bearish in the short term, but today’s price action made me consider a key question: How did altcoins react when Bitcoin dropped 31% in 2021?
Interestingly, during that period, the total market cap of altcoins expanded. This makes sense because funds tend to flow out of Bitcoin into altcoins, explaining why alts can rally even as Bitcoin corrects. We saw a similar dynamic today when Bitcoin dropped to GETTEX:92K with almost no impact on altcoins. This suggests a potential decoupling between BTC and ALTS, which reduces my concerns about Bitcoin dragging down the market.
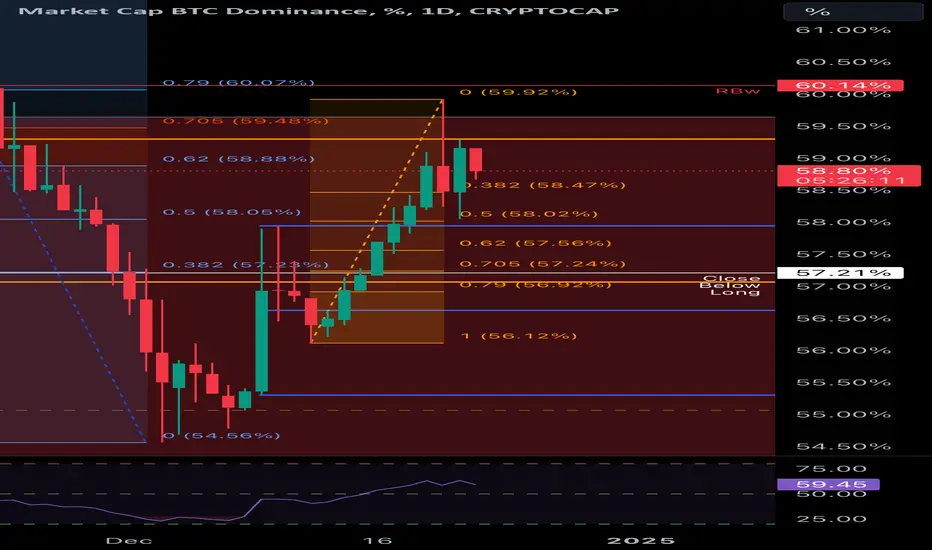
2. Bitcoin Dominance: Does It Invalidate the 0.618 Fib Theory?
In November, Bitcoin dominance rejected at the 0.618 Fibonacci level, much like it did in 2021, signaling the start of an alt season. Recently, however, dominance surged upward, leading to a temporary altcoin pullback. My concern was that if dominance surpassed 0.618, it would invalidate the theory.
Today, dominance took a sharp dive, which has significantly strengthened my confidence in the bullish case for altcoins. This price action supports the idea that we are indeed on the verge of an alt season.
3. High Stochastic RSI on the Weekly Chart: A Lingering Concern
To be fair, the stochastic RSI on the weekly chart remains elevated for most altcoins, with a bearish crossover. However, recent market movements have caused it to come down slightly. While this isn’t ideal this is my only lingering point. The monthly and daily charts show a bullish stochastic RSI, which offsets some of my concerns. Admittedly, this is the one area where I wish conditions were slightly more favorable, but it doesn’t outweigh the stronger bullish signals elsewhere.
For example, the Stochastic RSI is bearish on BTC Dominance which supports a Bullish Stochastic RSI on Gala.
Final Thoughts
With these concerns addressed—or at least rationalized—I feel more confident about re-entering the market. While no setup is ever perfect, today’s developments have reduced my hesitation and strengthened my bullish case for Gala and altcoins. Let’s see where this market takes us! 🚀
What Next
I will hold my trade for the entirety of Wave 3, for those that are not aware each wave consists of 5 impulses I won't be trading the swings. I will be however looking for the top of Wave 3 to exit but I can't imaging that will be for a few weeks yet.
Instead, I will monitor prices at key level's which are as follows -
1. Confirmation of Wave 3 when price breaks 0.066%
2. My first price target is between $0.11402 - $0.13126.
I will provide price updates at those points.
ALTSEASON?Altseason is nearly here, and you can get rich!
You’ll succeed if you do these 5 things:
1. Believe in something
2. HODL through -30% and BUY THE DIP
3. Pay attention to CRYPTOCAP:BTC Dominance
4. Pay attention to the US Macro data
5. Pay attention to Trump policies
The only way to lose is to be indecisive 👇

Good sign for alt coinsALT SEASON IS ABOUT TO BEGIN. BTC.D is retesting rising wedge pattern. It is falling sign for btc.d. Target 48-50%
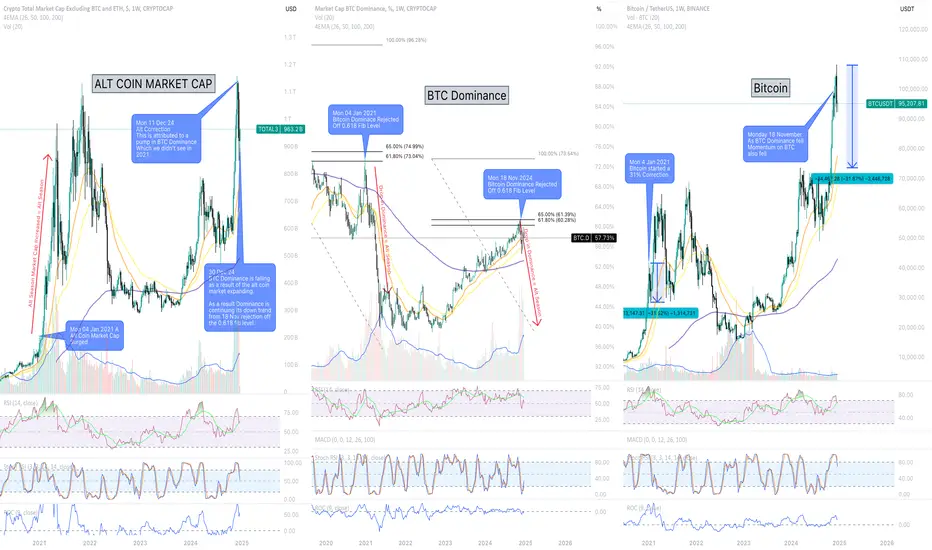
Bitcoin Domiance Confirms Alt Season is Upon UsI’ve recently been cautious about entering the market due to concerns that Bitcoin’s bearish outlook might drag altcoins down further. My worry was that there could be more downside for alts. However, today’s price action has provided some much-needed clarity—and it’s looking positive.
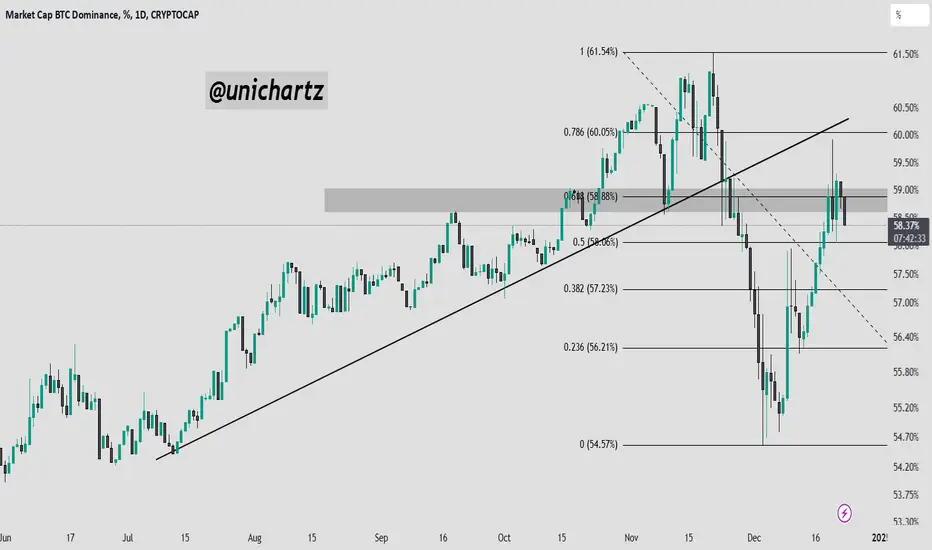
I shared an idea about Bitcoin dominance bouncing off the 0.618 Fibonacci level back in 2021, which marked the start of altcoin season. Interestingly, we saw a similar setup this November. Bitcoin dominance reached 59.96%, rejected the 0.618 Fib level, and started declining—a promising signal for the start of another alt season. Altcoins initially rallied as dominance fell to 58.03%, but then dominance bounced back up, causing alts to pull back.
What caught my attention, though, was how dominance behaved more recently. On December 22, dominance attempted to climb but topped out at 59.27%—lower than the November high of 59.96%—before posting a notable drop today and setting a lower low today. This is a very positive development for altcoins.
There’s still a lingering concern about Bitcoin’s bearish potential. I’m worried that BTC could revisit its previous all-time high, experiencing a 31% correction down to $73,000. This aligns with historical data from 2021, when Bitcoin saw a 31% drop after dominance hit the 0.618 Fib level. This scenario remains on the table.
However, what I hadn’t fully considered until now is how the altcoin market behaved during Bitcoin’s correction in January 2021. When BTC dropped 31%, the altcoin market surged as illustrated above. This indicates a decoupling effect, where money flows out of BTC and into alts, fueling an altcoin rally even as Bitcoin corrects.
We saw a similar dynamic today. When BTC dropped to $92,000, it had little to no impact on the altcoin market. This decoupling reinforces the idea that altcoins can thrive even during Bitcoin’s downturns.
With these patterns playing out, I’m now confident that we are on the verge of—or already entering—altcoin season. 🚀
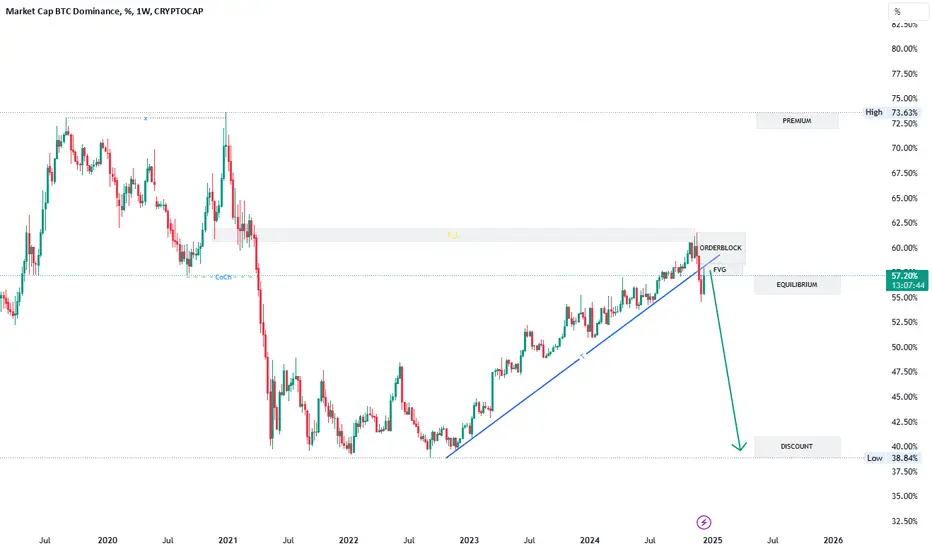
Possible drop in BTC dominanceA dropped in BTC dominance will cause Alt coins to appreciate in price,
we have key level tested, also breakout of trend and resting,
is also tapping into fair value gap with unmitigated orderblock.
BTC dominance currently at Equilibrium.
Let prepare our altcoins
Altseason coming.Btc.d is currently forming a ascending wedge after a huge drop. This is a bearish trading pattern. If btc.d will drop there will be an altseason. I think the lowest btc.d will go is ~47%.
Time will tell.

bitcoin dominance updated Breaking down Happens
see my previous ideas
bitcoin comes down and altcoins grows up
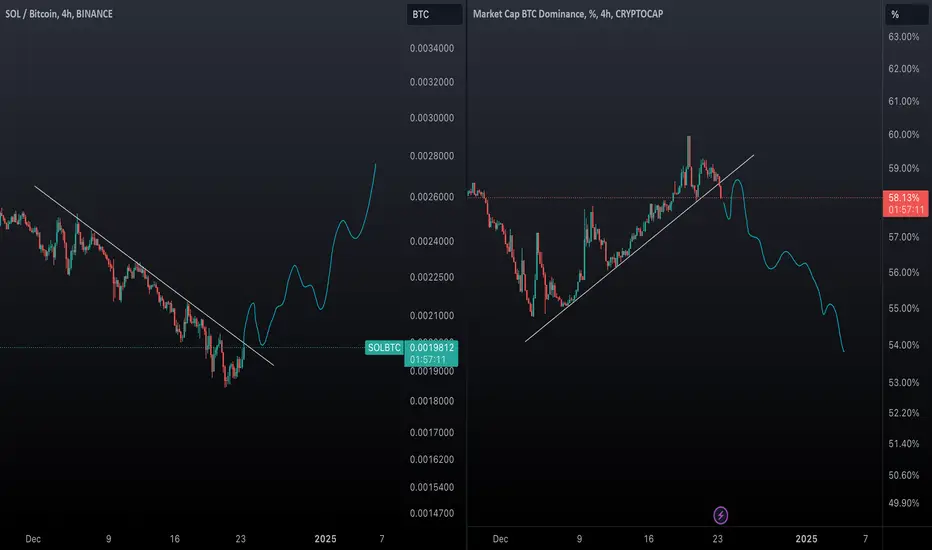
SOLBTC is key for reversal of BTC.DI'm interested in SOL's behavior against BTC. ETH will follow in suit. I think we're going to see a breakout in SOLBTC, corresponding with a sharp decline in BTC.D.
This shows that alt coins are gaining strength as we prepare for a potentially bullish Q1.
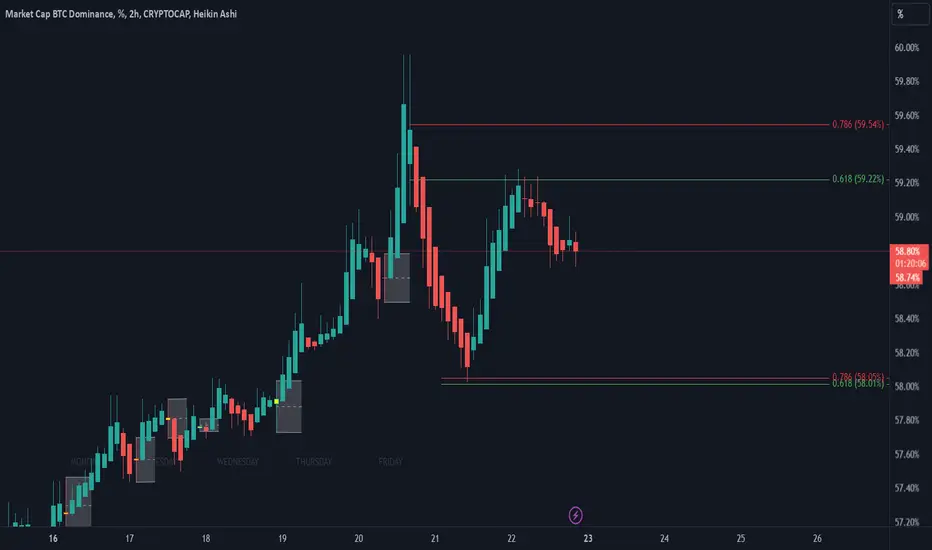
Golden Fib Level Rejection in BTC.D: What’s Next for Altcoins?After a sharp gain, BTC.D is facing strong rejection around the golden Fibonacci level of 0.618. We anticipate a sharp decline from the current levels, which could pave the way for another leg up in altcoins

btc.d analysisWill the trading line be successfully broken?
The answer to whether altcoins will rise or fall depends on this

Bitcoin dominanceI currently have this analysis in mind: if the market moves downward according to the analysis, we might see green candles across all altcoins.

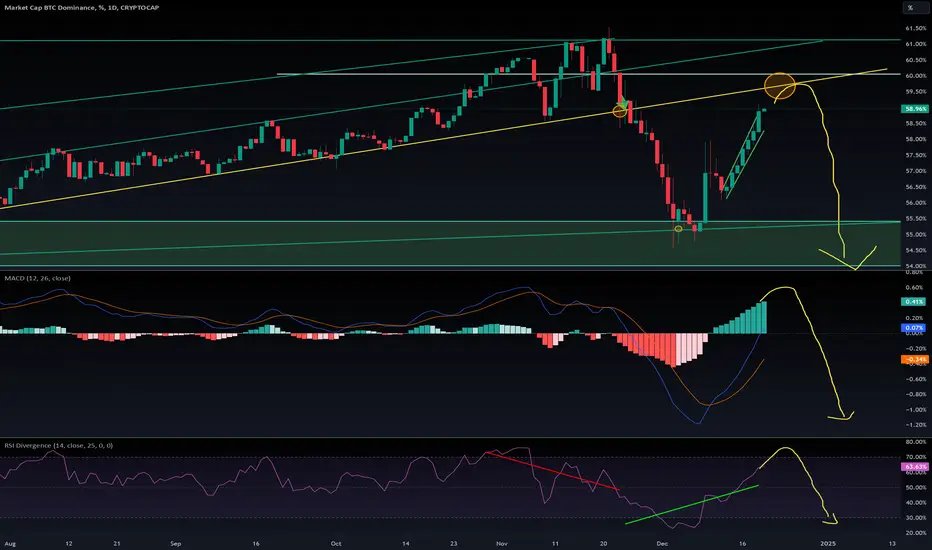
$BTC.D prediction based on the current situation.CRYPTOCAP:BTC.D has been climbing steadily since the start of this bull run.
It’s often said that an altseason begins when BTC dominance drops below 55%. However, the 54% level appears to be a strong support zone, with the MACD showing a low point and the RSI entering oversold territory.
My analysis suggests that BTC dominance has established a range between 59% and 55%. It’s likely to bounce off the top resistance, pushing dominance back toward the support.
If the next drop breaks through this support, it could finally trigger a true altseason.
BTC.D ChartAs i mentioned in my previous analysis i expected BTC.D to have it's pull back to the inverse cup & handle pattern and midline of it's channel and we got a beautiful red inverse hammer from the resistance zone. Im expecting BTC.D to continue it's path to the lower numbers which will give alt coins some room to grow and a future alt season.
Market might give a bit more correction due to other charts which you can read on my profile, but don't get shaken out and buy the dips and you'll thank me later.
The Giga cycle is upon us.
DYOR
Goodluck

Good week ahead for alts IF BTC.DSeems dominance must retest 57%; this gives a good push for quick scalps this week. Stay safe; use 4H confirmations. US gov shutdown news are done. Always take profits; i uncertain about the first 10 days of 2025. I am sure i will not miss the best opportunity to ape in. You may with to look OTHERS.D; it is rebouncing which is another confluence for the coming week positive for alts.
The Fibonacci golden ratio (commonly 0.618 or 61.8%) Always PlayThe Fibonacci golden ratio (commonly 0.618 or 61.8%) is a powerful concept in trading and is often used for identifying potential reversal or continuation zones. However, while it is highly effective, it doesn’t always work, as no tool or concept in trading guarantees 100% accuracy. Here's why:
Why Fibonacci Golden Ratio Works:
Natural Patterns: The Fibonacci ratio is rooted in nature and psychology. It reflects patterns that occur in financial markets as traders’ behavior often aligns with these ratios.
Support and Resistance: The 61.8% retracement level frequently acts as a strong support or resistance zone where price reacts.
Widely Used: Many traders use Fibonacci levels, which makes them self-fulfilling to some extent.
Why It Doesn't Always Work:
Market Conditions: Fibonacci levels may fail in choppy or sideways markets where clear trends or retracements don’t exist.
Lack of Confluence: A single Fibonacci level without other confirmations (like trendlines, candlestick patterns, or volume) might not hold.
External Factors: Sudden news, macroeconomic events, or unexpected volatility can overpower technical analysis.
How to Make It More Effective:
Combine with Confluences: Use Fibonacci retracements with trendlines, candlestick patterns, moving averages, or RSI divergence for higher accuracy.
Check Market Context: Apply Fibonacci in trending markets where retracements are more predictable.
Backtest and Refine: Analyze past data to see how well Fibonacci levels align with price action in the assets you trade.
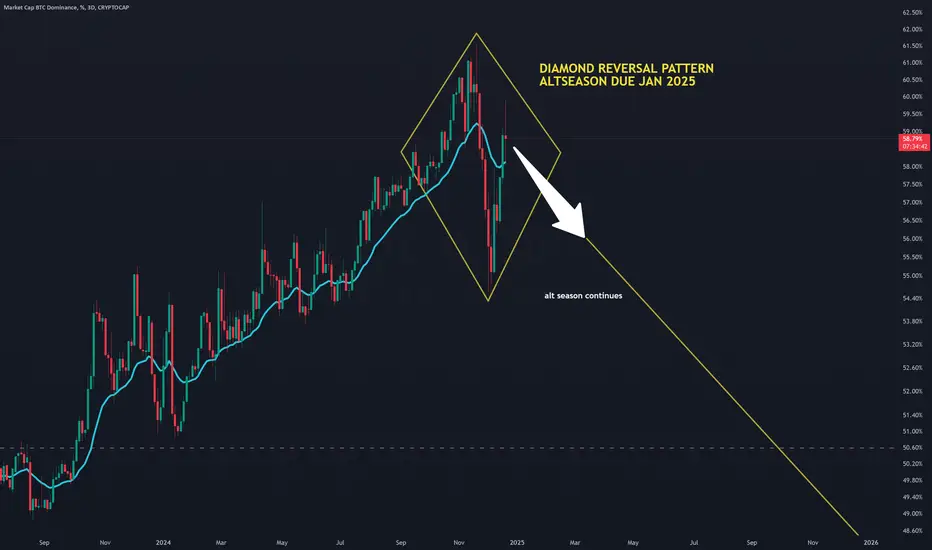
BTC.D DIAMOND REVERSAL PATTERNLooks like the dominance run is over, and the alt-season beginning to start.
Once BTC stabilises, ALTS will shine.
BTC.D(based on NEowave)2 ways for bitcoin dominance. I prefer the red one and I think soon we will see ALTcoin season which is available on both ways.
share and support to publish more ideas.
