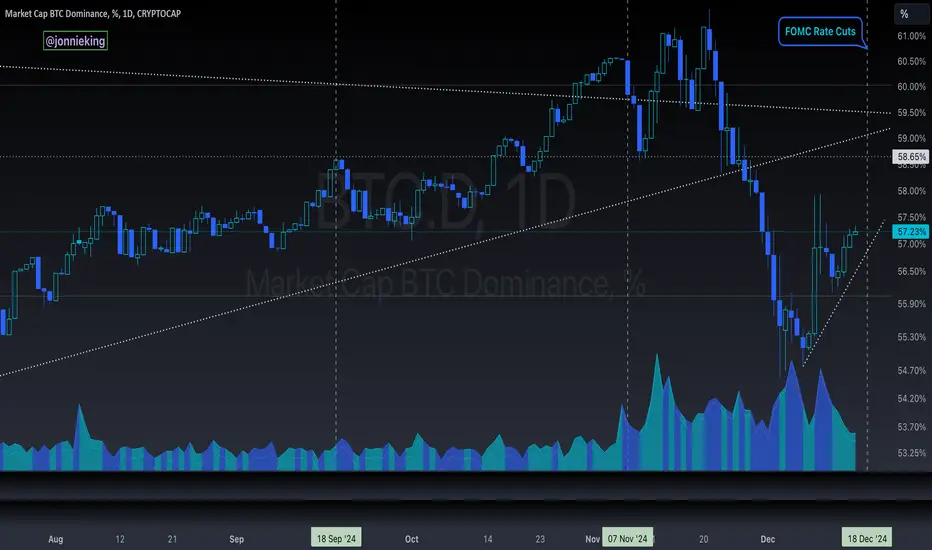
Possible Cliffhanger?Bitcoin dominance made a triple tap triple top around 61% and then dropped below the 50 and 200 daily EMAs and MAs.
It is presently testing old support as resistance and has reclaimed the 200 daily EMA and MA, but has failed to reclaim the 50 day EMA and get back above 58.25%.
It is still possible it reclaims the 50 EMA and MA and breaks through resistance, but if we see another daily close below the 200 EMA / MA or if it fails to get above the 50, it is going to drop hard.
BTC.D trade ideas

Bitcoin in Command?I'm honestly torn on what Bitcoin's dominance will be in the future. Just want to note this major inflection point we're at. I think an alt season could be close, but crypto always keeps us guessing.
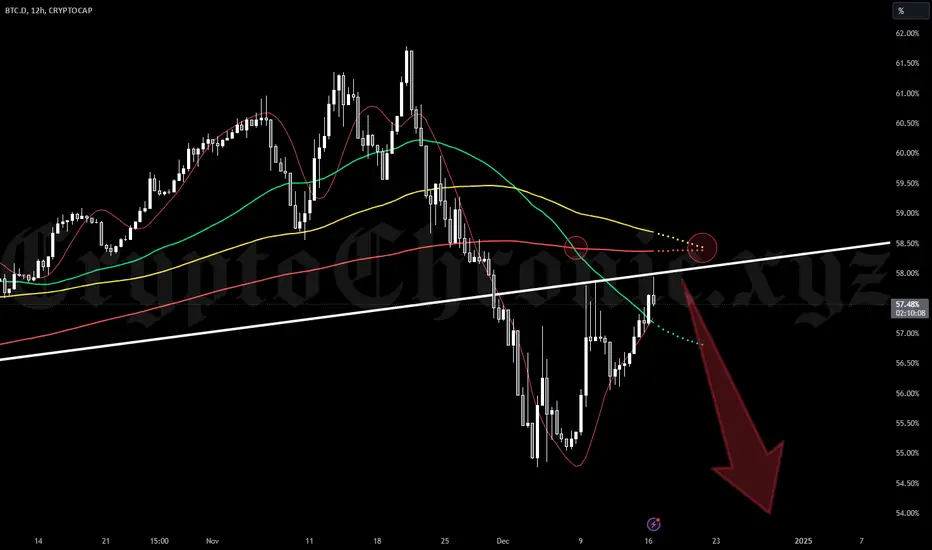
BTC.D: A Critical Turning PointThe current zone is pivotal for confirming the bearish scenario on BTC.D.
Key Points:
- Death Cross on the 12h chart confirmed last week.
- PA is retesting EMAs after the cross, increasing the likelihood of further downside.
- This is a zone to add positions if weakness confirms.
Main Scenario:
1. Retest completion → continued downtrend.
2. Major support lies around 53%, with potential for deeper declines.
Risks:
A sustained move above the current MAs could invalidate the bearish outlook.
BTC.D_Kiss of Death or whatIs this a bearish bounce (kiss of death) and then will start a downtrend ?
What do you think ?
NFA
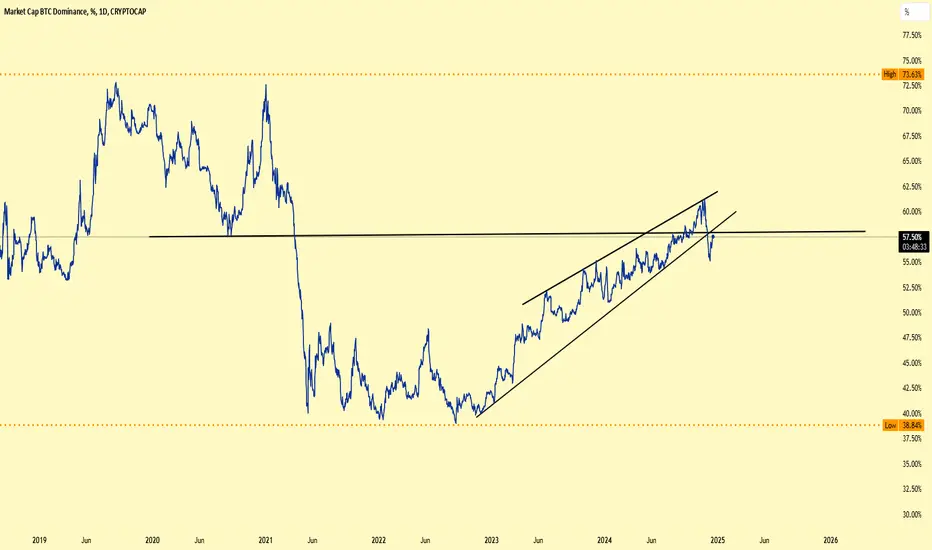
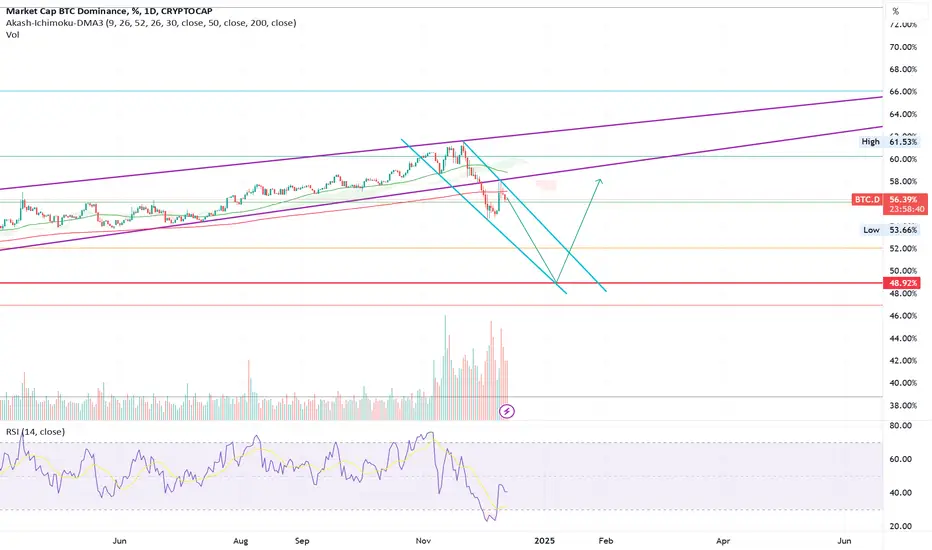
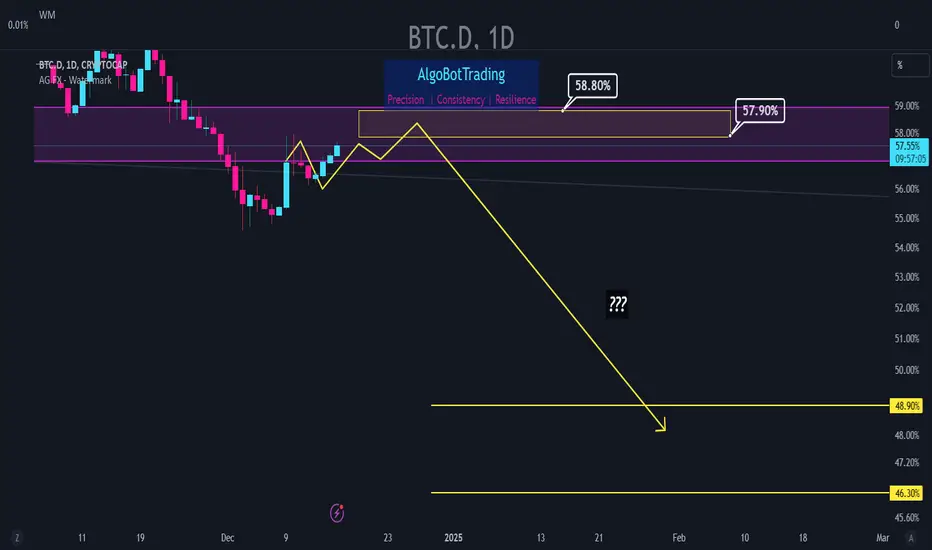
BTC Dominance Update - Dec 16 2024After reaching about 62% level, BTC dominance started a heavy drop in Nov possibly hinting that the altseason has started.
The index has recently broken its long term trendline that originated in Sep 2022.
The current upward move in BTC dominance is probably the retest move of the broken trendline. This retest will probably end somewhere in the 58% zone and then we can expect the dominance to fall towards 46.3% - 48.9% zone within the next few months.
$BTC.dHola ,
approaching last weeks spike up
maybe deviate above that and get knocked back down
7 ema is the white squiggly and a close above that would mean the King is back in control and we get to bid alts lower
Look at the brightside the higher btc dominance goes that much more money should flow into alts on the way down
lets see at NY if we get a quick spike down on alts and reverse?

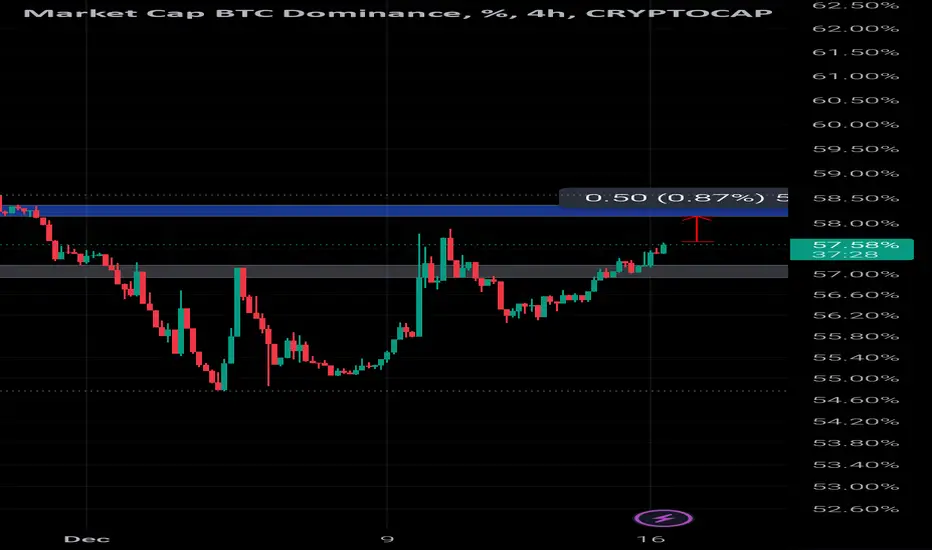
BTC Dominance (BTC.D) Chart Overview and DescriptionBITSTAMP:BTCUSD target is set at 58.13% BTC Dominance.
The chart shows BTC.D currently at 57.63%, approaching a key resistance zone (marked in blue) near 58%.
A breakout above this level could lead to a further rise in BTC.D, signaling continued Bitcoin dominance.
The area just below 58% has acted as resistance in the past, as seen on the chart.
If BTC.D hits 58.13% and rejects:
This could signal a shift of dominance back into altcoins, leading to a short-term altcoin rally.
Monitor key support zones for BTC.D (e.g., around 57%) for confirmation of a reversal.
If BTC.D breaks and holds above 58.13%:
Bitcoin may continue to dominate, and altcoins could face further corrections or stagnation.
Consider monitoring Bitcoin price for strength while keeping an eye on major altcoin support levels.
BTC.D Rising to 58.13%: Positive for Bitcoin, bearish for altcoins.
BTC.D Dumping After Hitting Resistance: Bullish for altcoins, indicating potential altcoin rotation or season.
Track BTC.D closely along with Bitcoin price movement to make informed decisions.
Bitcoin Dominace at resistance. Drop soon?The CRYPTOCAP:BTC dominance is at the moment at the resistance.
If Bitcoin dominance reject there we could see the next leg for a MEGA Altseason.
BTC.D update#BTC.D is making another rise and then make a fall to the demand zone i think that this fall can make the altcoin market rie

Bitcoin Dominance Analysis Update (12H)This analysis is an update of the analysis you see in the "Related publications" section
The price reached the green zone and is now pumping. We anticipate the start of a drop and an alt-season from the upper red zone.
Note that, in terms of price, we consider this area to be the peak of Bitcoin dominance. However, in terms of timing and the number of times this level is tested, there is no certainty. This means that when Bitcoin dominance reaches the upper red level, you can enter altcoins. However, altcoin fluctuations might increase, and it could take some time, as the market maker might cause some turbulence before the main move.
For risk management, please don't forget stop loss and capital management
Comment if you have any questions
Thank You

$BTC God Candle / Santa Rally Setup What if CRYPTOCAP:BTC ripped a $10k GOD CANDLE to $115k going into the FOMC meeting on the 17/18th when they cut interest rates 🤯
₿itcoin Dominance rallies back to 58% nuking Alts 📉
Then Alts rubber-banded back into the Santa Rally 🎅
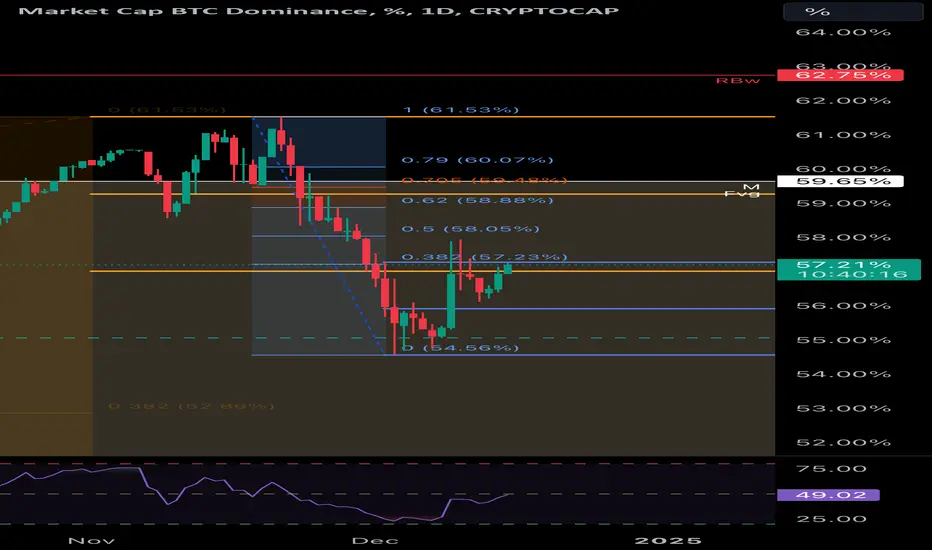
ALTS discounts ahead Orange lines are hi/mid/low of Nov2024. We swept the low of Nov, now back to the range; price tends to test mid of Nov. I will monitor the fib levels; any aggressive move above 0.72-0.79; confirms a move to 62% dominance that matches a weekly rejection block (check the weekly chart to confirm). From 62% a free fall would start declaring parabolic move to altcoins. This all plays well with OTHER.D daily chart which confirmed change of character as market direction.
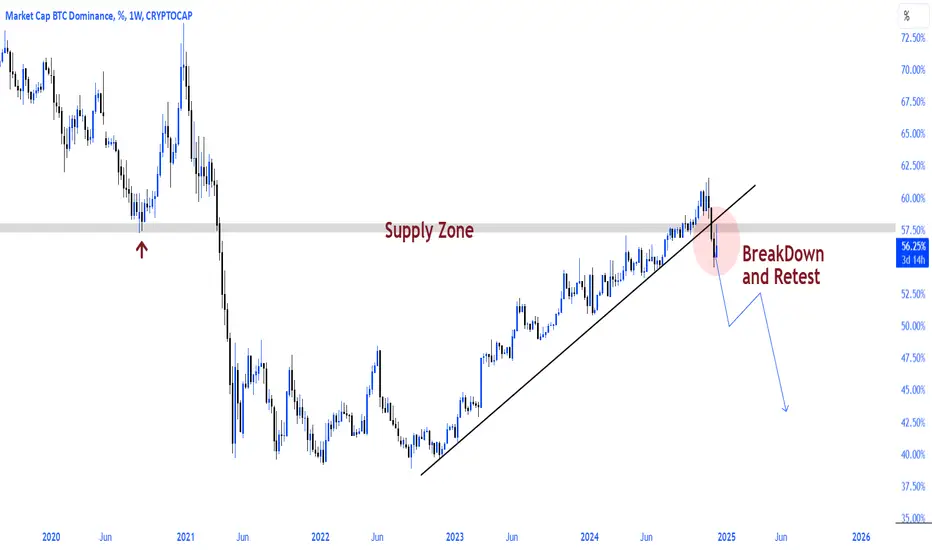
Bitcoin DominanceCRYPTOCAP:BTC.D has lost the supply zone after a long time and the weekly bearish breakout and retest is completed, as well as the two-year uptrend downtrend breakout and retest is completed.
We're moving towards a long-term recovery for #Alts
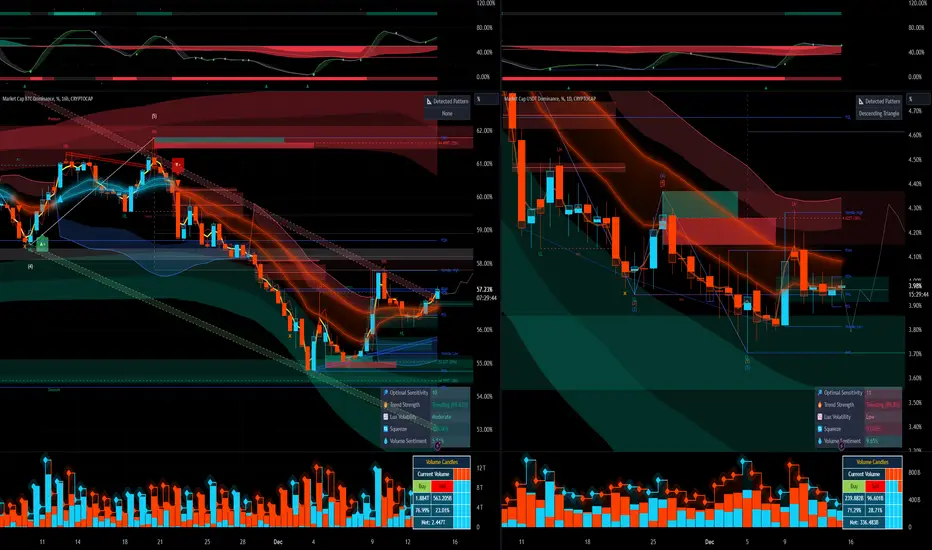
Warning to Alt coin holders!BTC.D broke the downtrend line on the 16-hour chart. Alt holder confidence may start plummeting, potentially triggering a massive sell-off unless we deviate back to invalidate the significant correction ahead1. USDT.D has formed a double bottom on the monthly chart with bullish volume sentiment, suggesting a massive correction might be around the corner
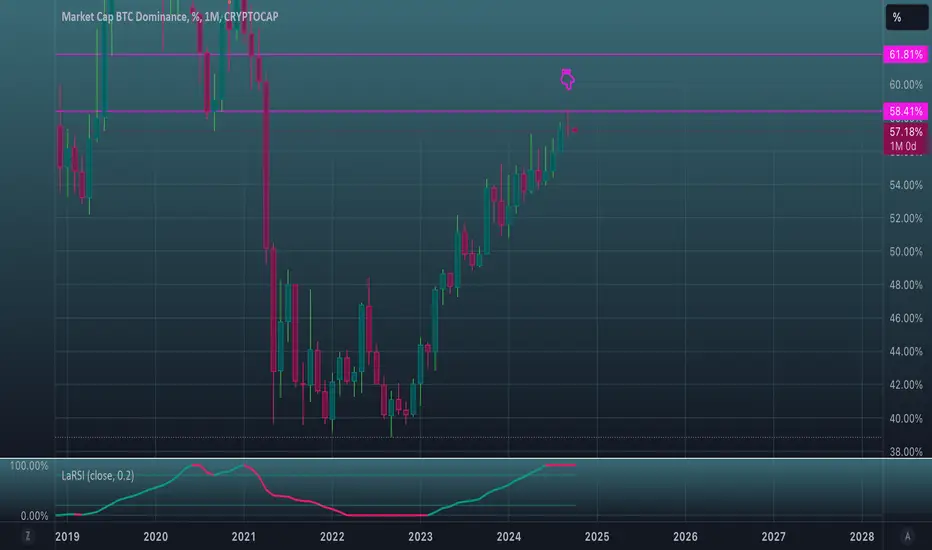
Laconic sign.Hi!
Most ideas about the behaviour of BTC. D that have been published
all this year have not worked. Until those who said every week since
winter that dominance was about to fall have been non confirm their rightness.
And just as wrong are those who talked about figures of 70-80-90 (!!!) %.
I analysed the chart carefully in the first half of the year and decided that
there are 2 levels of the most probable reversal.
They are 58.4% and 61.8% . And I could not make any additional
predictions as to which of them would turn out to be that level. Any of them.
Now it is the 1st of October (congratulations to everyone on the beginning
of the real autumn, if you love it as I do) and we can see that the
September monthly candle closed with a real shooting star .
And new October candle opened as it should with a decline below
the body of the previous star.
That's pretty promising.
The most key thing to say is that the market is in no hurry at all.
4 hour charts are completely useless this year.
Processes are defined on much larger timeframes.
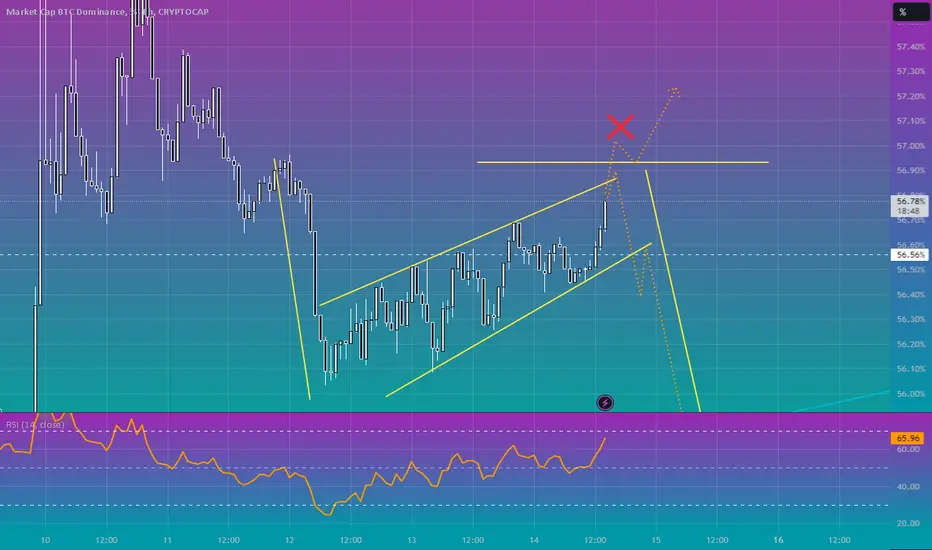
BTC Dominance at a decision point..Does it rally back to the 59-60% mark for a double top? Does it continue to break down and cascade another leg to the downside. I think whatever happens will happen soon so buckle up!! I do think it has a higher chance of going down personally. NFA!

BTC Dominance can break down after the increasing.BINANCE:BTCUSDT CRYPTOCAP:BTC.D BTC Dominance can break down. There is a bearish wedge pattern looking possible for the 1H time period. If break up over the %56.90 pattern won't be work. If break up altcoins can down %10 (more).
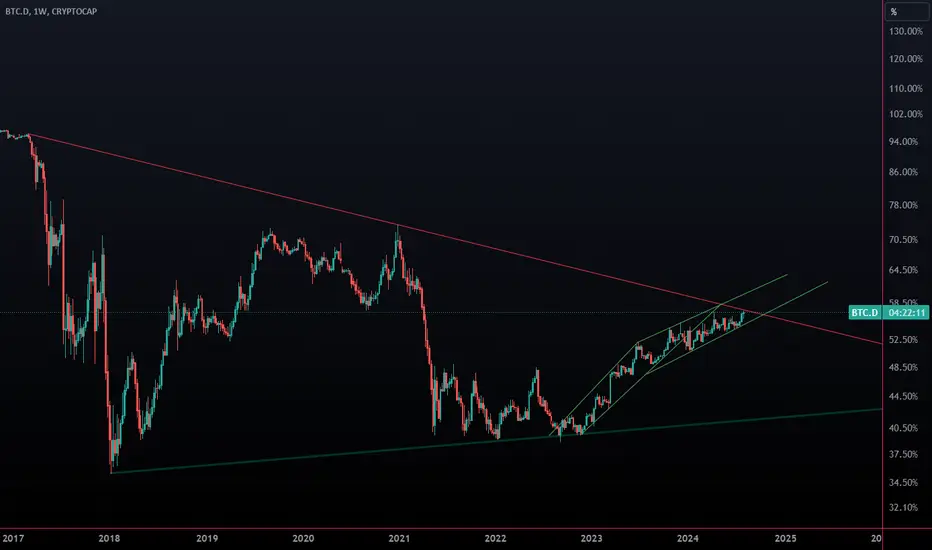
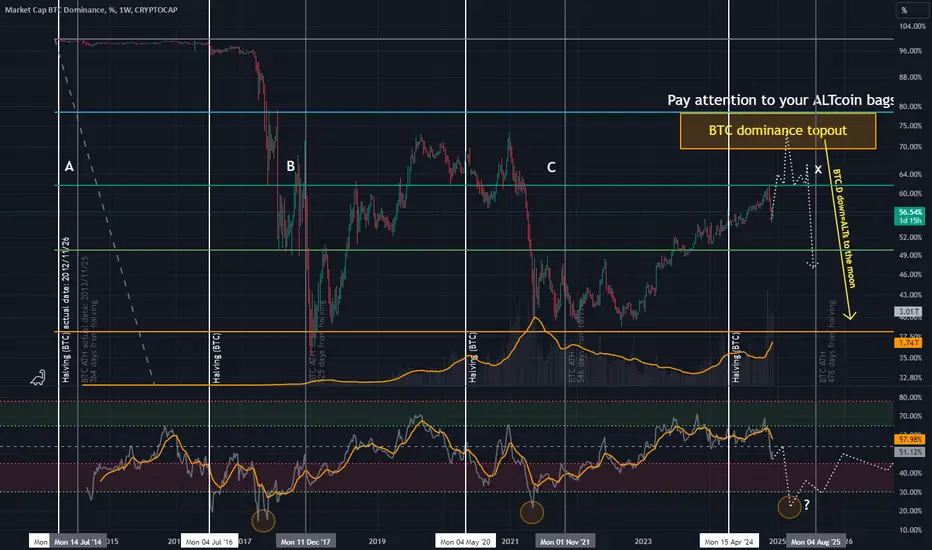
BTC.D Top outHistory never repeats but it tends to rime quite well.
If we use that saying as the base for this thesis then we should see BTC.D top out at between 69-78% dominance using the horizontal resistance at the previous dominance top (2021).
To estimate this in a timely manner we plot the dates of the halvings and the date of BTC price ATH. To extrapolate the future cycle top we take the number of days from the halvings to the BTC price ATH and add them together and divide them by the number of cycle tops.
x=(a+b+c)/3
Historically we find confluence in the RSI momentum oscillator were the strength of the BTC.D is weakening hence gaining momentum to the downside. If history rimes we are entering that part of the cycle within the next 3-6 months.
Market Dominance Analysis–Bullish for Altcoins, Caution AdvisedKey Observations:
Dominance Rejection: The market dominance faced a strong rejection after reaching the 58% level, aligning with key resistance at the 7 and 21-day EMAs. This suggests a bullish signal for altcoins, as the dominance pullback indicates a potential shift in momentum away from Bitcoin.
Bullish Shift for Altcoins: Altcoins are positioned to benefit from this shift, especially if dominance continues to weaken. The key support for dominance lies around the 200-day EMA, and if dominance closes this week below this level, further bullish potential for altcoins could unfold.
Key Levels to Monitor:
Resistance for Dominance: Should dominance attempt to rise again, watch for potential resistance at 54.5% and 53% levels. These could act as key turning points, marking possible take-profit (TP) zones for altcoins as dominance struggles to break higher.
Strategy for Altcoins:
Cautious Optimism: While the rejection of dominance is a bullish signal, altcoins should remain cautious of dips into the danger zones around 54.5% and 53% dominance, which could pose resistance.
Target Zones: The shift in momentum suggests potential for continued altcoin strength, with dominance weakening if the candle close remains under the 200-day EMA.
Conclusion: The recent rejection of dominance is a strong bullish sign for altcoins, but traders should keep a close eye on the danger zones around the 54.5% and 53% dominance levels. If dominance fails to reclaim these areas, altcoins could continue to see further gains.

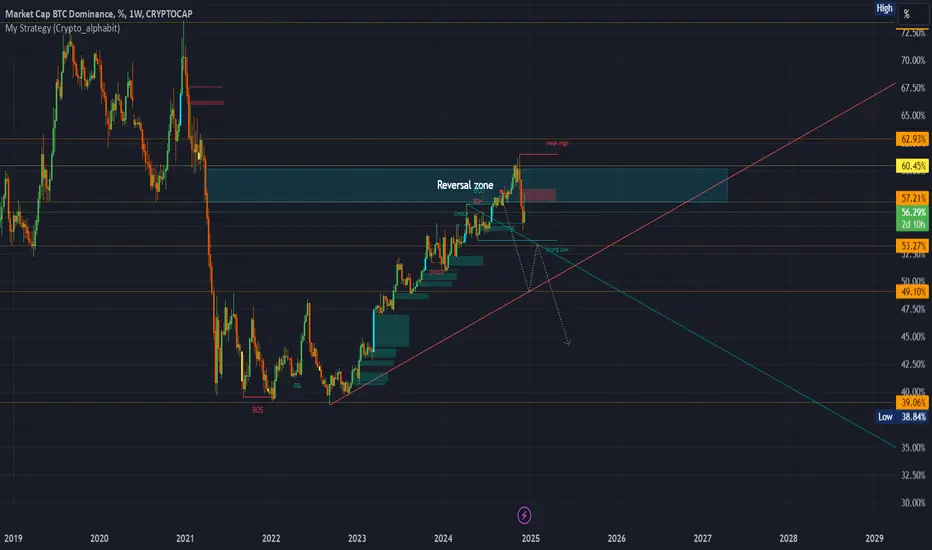
ALTCOINS to the moonCRYPTOCAP:BTC.D
* Since 9 September 2024 and the chart still following the pig picture & the big plan as well .( please check the post below here).
* It was so nice entries & it was altcoins bottoms.
* Retest for the reversal range breakout is already done and you could see that in the altcoins chart.
* Now the BTC. Dominance need to break 53.71% and close 1W Candle below.
* Then re-test to continue dumping.
* I think the next wave for the altcoin is so huge , if you missed the bottoms you still have another opportunity with this correction.
* May be some coins will give you nice entry by the end of this month.
* This plan may take long weeks to be done.
* I was expecting BTC price is going to dump before going to 100K but it worked against my plan but in the end BTC price broke the high so ( BTC price now is in the market maker hands & under their control).
*I did mistake because the chart was showing that BTC is going up but i thought it is a trap because i was emotionally controlled by the media & i did not believe the chart.
*To review the previous post for BTC. Dominance check it below...............
______________________________________________________________
Golden Advices.
********************
* This is my expectation for next weeks & may be i am completely wrong, Please do your own plan.
* Please calculate your losses before entering any trade.
* Do not enter any trade you find it not suitable for you.
* No FOMO - No Rush , it is a long journey.
Useful Tags.
****************
My total posts
tradingview.sweetlogin.com
1Million Journey
tradingview.sweetlogin.com
tradingview.sweetlogin.com
@Crypto_alphabit
________________
BTC.D in CorrectionBTC domminance can do correction it broke long term trendline and pullback to this
i think its good time to save you profit and stay away for new entry
plz manage your risk

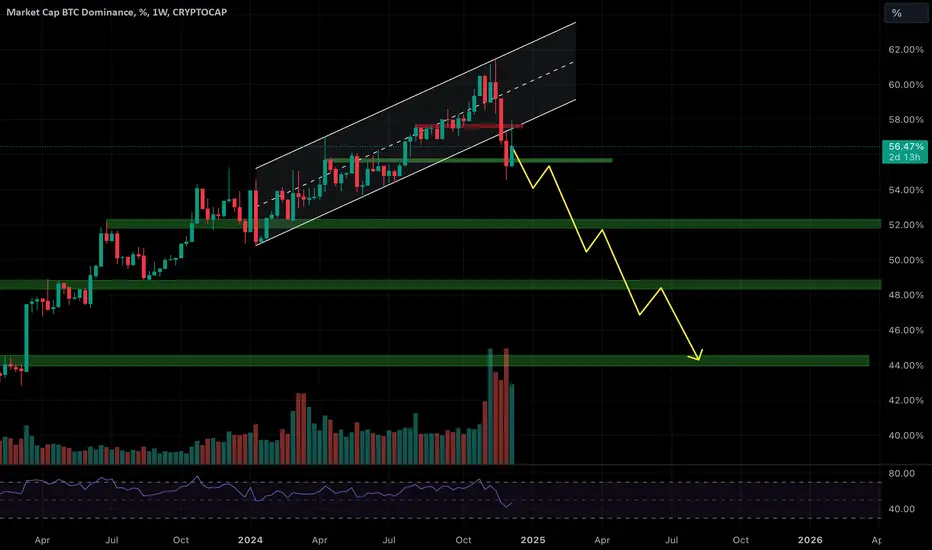
BTC.D ChartBTC.D broken down its ascending channel and is currently having a pullback to the previous support acting as a resistance now. 2Days and 13hrs remaining till we get the candle closed and if it stays like this I think it will continue the path shown in the chart in the following weeks and months which will lead to a huge alt season. So pack your bags and load your alt coins if we get any correction from BTC and the market. It can be out very last chances on buying low before we fly high with this mega cycle. Buy the dips and thank me later.
DYOR
Goodluck