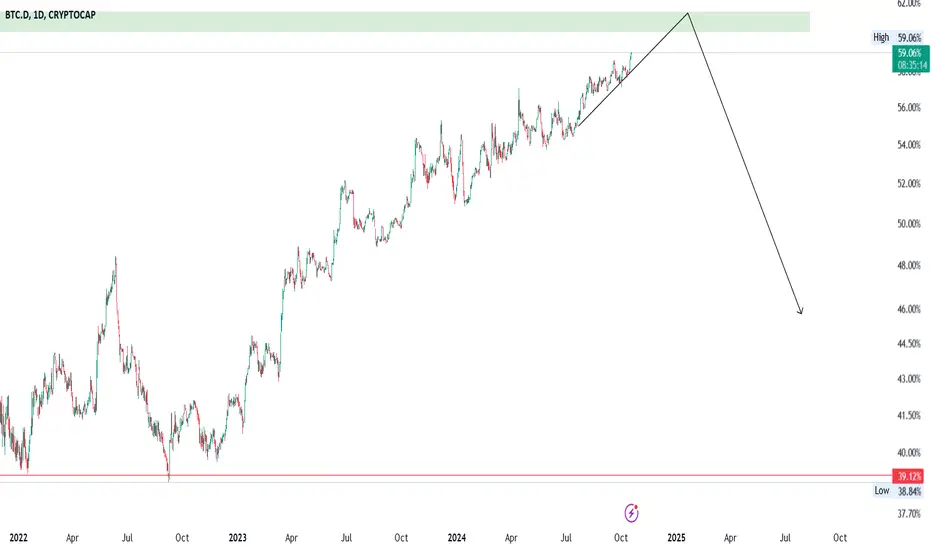
BITCOIN DOMINANCE altcoin recovery?I anticipate Bitcoin dominance will hover around 57%–58%, forming wave 2 of the micro degree. Following this consolidation, we can expect a massive altcoin rally as Bitcoin dominance transitions into wave 3. Patience will be key during this phase.
BTC.D trade ideas

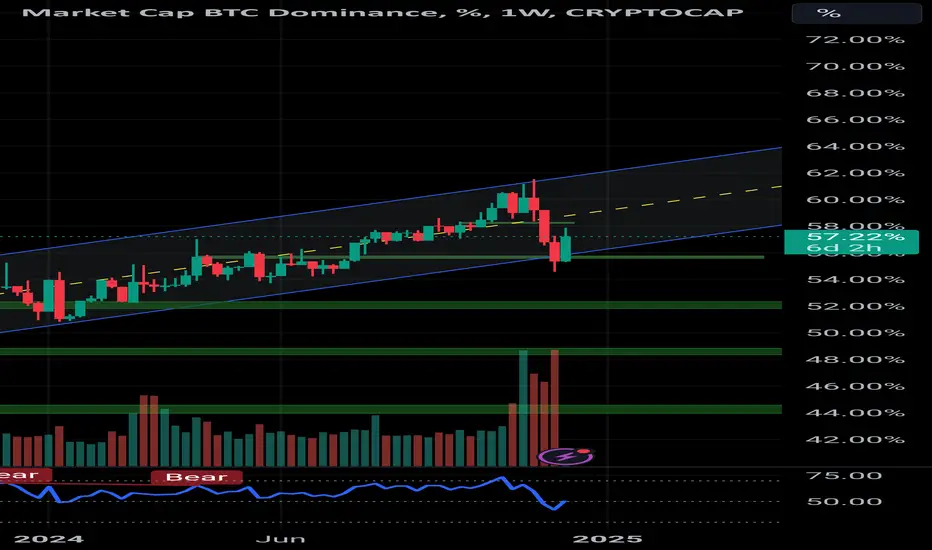
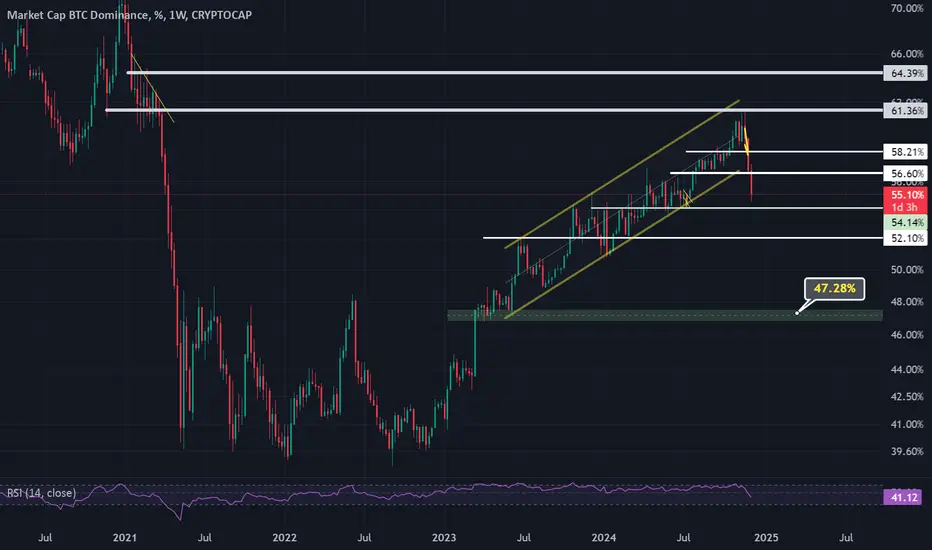
BTC.D chart updateBTC.D reached the bottom of it's weekly rising channel and midline of the channel can be it's first target which means even if BTC goes for a range and goes sideways and doesn't make a further correction alt coins will continue to bleed. Top of the channel can be reached but the probability is low in my opinion. In any case, alt coins will be on a huge discount in the coming days.
Trend is bullish so consider every dip an opportunity for adding more alt coins into your bags. But be patient and enter the market in the right time.
Look at my profile for more analysis of the other charts.
DYOR
Goodluck

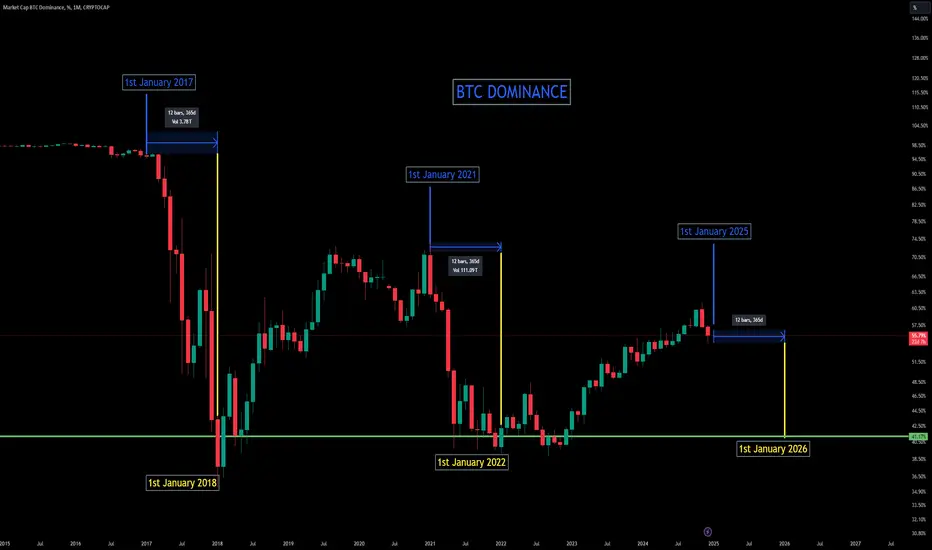
BTC.D JANUARY BOTTOM?I've deep dived into ETH, BTC, BTC DOMINANCE and TOTAL 3 (EXCLUDING BTC & ETH) to try and find this cycle peak. All of which follow a specific pattern and trend, and it all seems to be pointing to a December 2025 peak or a January 2026 peak, depending how you draw it.
I will post all 4
BTC dominanceCorrelating with news and data around..
Bull run AKA BTC dominance will drop around sept-oct 2025..just coincide with BTC halving projection period.
So meaning more funds will flow to altcoins?
Monthly view BTC dominance......BTCdom has been making compression/accumulation towards the resistance/bearish area.
Time for BTC to make way for his Queen ETH and the altcoins army.

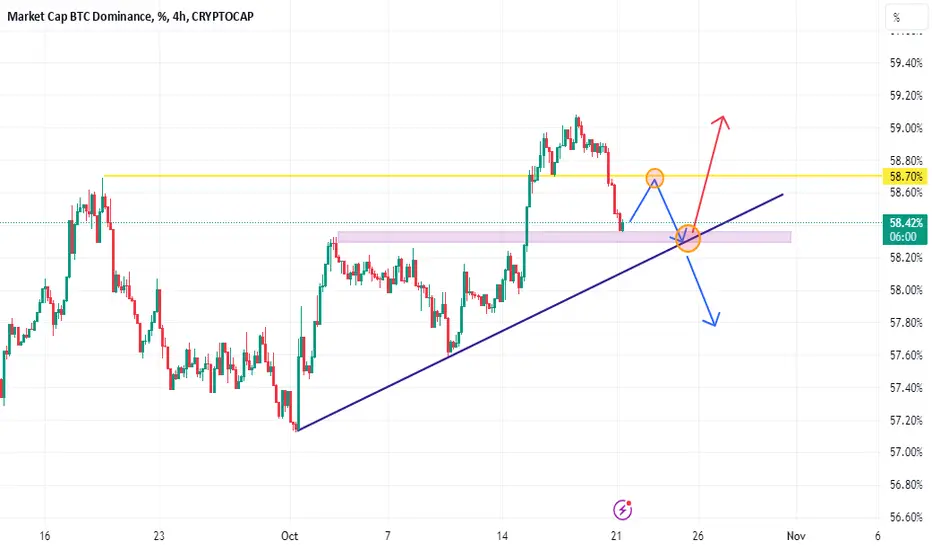
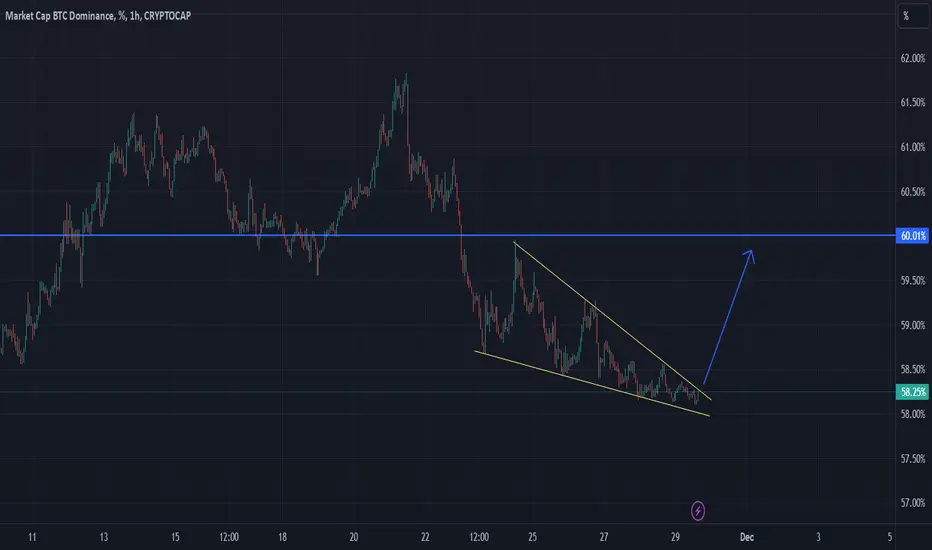
BTC.D NEXT MOVE It is expected that Bitcoin dominance will move in this path, with the next action being a retest of the 58.70% area. After this retest, it is projected to drop to the key level of 58.30%, where Bitcoin dominance encounters both dynamic and static resistance. From this area, a decision will be made whether to continue with a significant drop or rise. As you know, an increase in Bitcoin dominance usually indicates a dump in altcoins, while a drop in dominance signals a pump in altcoins. However, other factors, such as Tether dominance, also need to be considered.
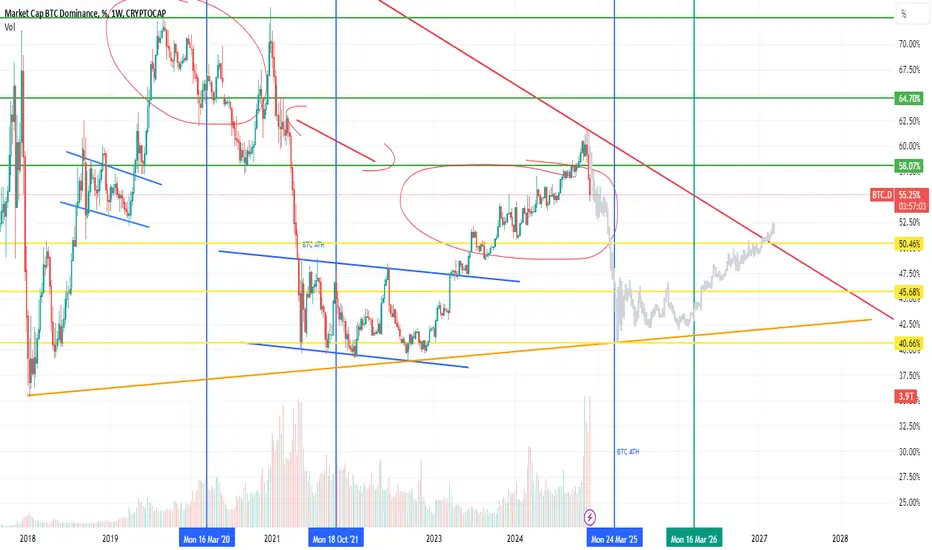
Time for a BTCd SpeculationAfter drawings some lines, pulling some bars patterns from the past and having a glass of wine I have determined that BTCD will bottom around 40%. The BTC cycle top will be Monday 24 March 2025. Which will trigger a 2 weeks long crazy blow-off top alt season, followed by 24-32 months of down only. So, make sure to come back in March 2027 and consider to dca in for 9 months
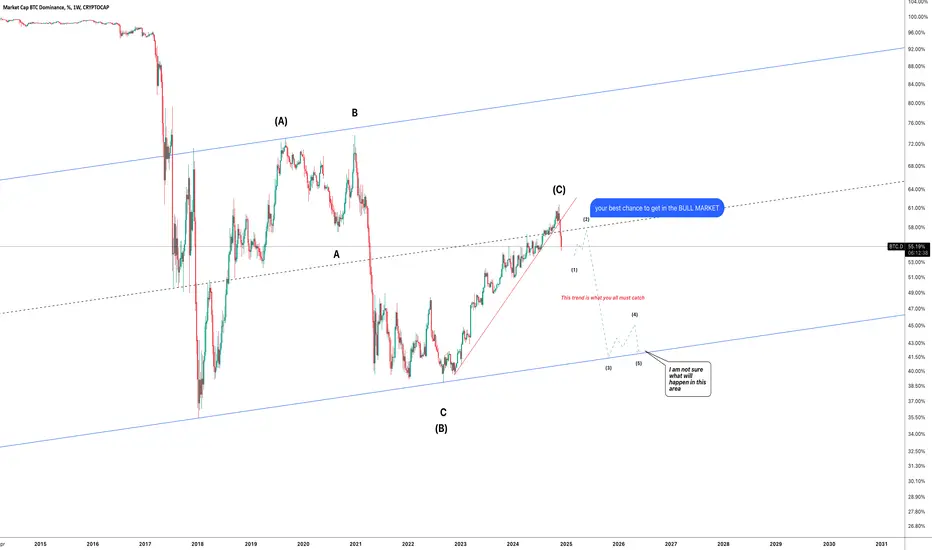
BTC Dominance I am not sure about this chart but as an Elliottician, I like counting all charts but if it happens, which I think so, it would be the start of a long time Rally and it shows us how Altcoin market can occupy the future of this digital revolution.
thanks
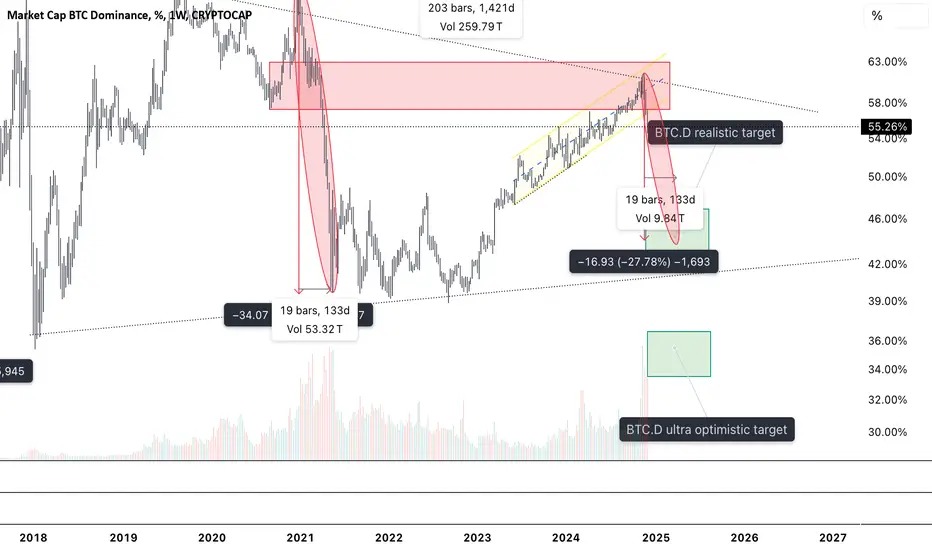
BTC.D prediction for 2025The BTC domination's fall takes just a short period of time. Usually up to 3-4 months of the altcoins euphoria. So taking into account previous cycles I'm going to HODL my alts till spring 2025 in a realistic scenario till BTC.D reaches ~44%
In case I see a free-fall dynamics of BTC.D during December 2024 and January 2025, I may expect for more optimistic scenario (BTC.D ~35%)
BTC.D could break to the upsideBTC.D could break out to the upside. If this happens altcoins could see a short term pull back. Let's keep our eyes on it and see where it goes. Trade Safe :)
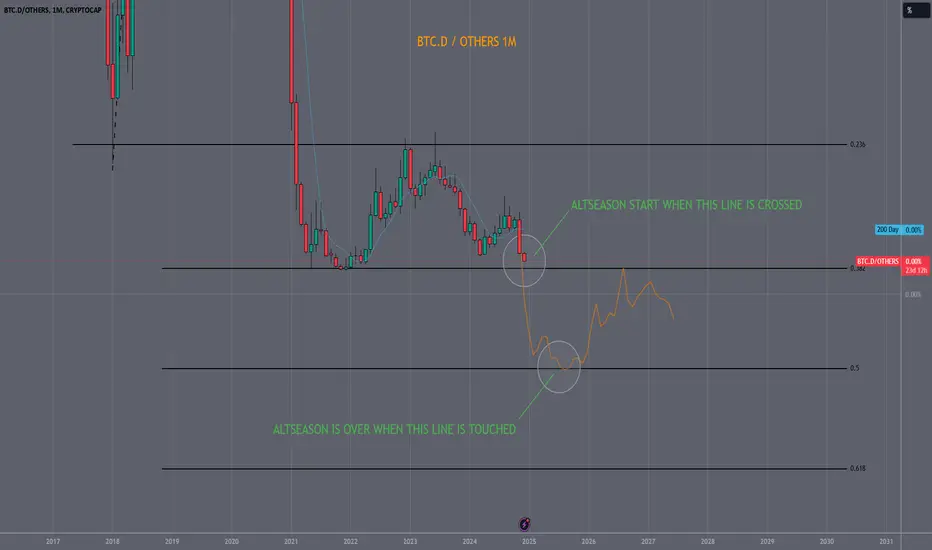
BTC.D/Others.D: Tracking Altseason on the 1M TimeframeThis year, I am focused on developing as many metrics as possible to track the altcoin market. In that regard, I’d like to share my latest chart: "BTC.D/Others.D on the 1M timeframe."
The idea is that BTC.D will drop below the Fibonacci 0.382 level and eventually reach 0.5 FIB. Each Fib-line on the chart represents the beginning and end of what is often referred to as an "altseason."
My timing expectations for this scenario range from February to October, and I’m hopeful for an early development in the market.
Bitcoin DOMINANCE trendHello my fllwers. Good morning
It's bit.D chart. I draw path for you for better trade
As you see we are in overall uptrend STILL , so be caution about your positionss
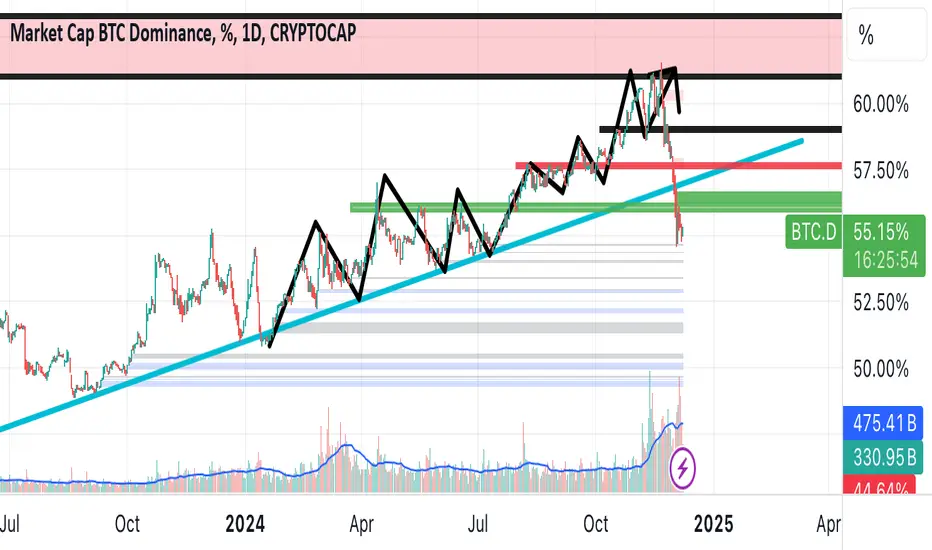
$BTC.D 51.87% thoughts ..dominance one more leg down imo before we see some relief on it and get pullbacks on btc pairs
as mentioned above max bid on alts and hold them for a while likely till May then sell and go away for a while
shall update in a bit depending on where we go from here
need the market to take back some gains before we resume up only imo
BTC.DBased on the weekly/daily Bitcoin dominance channel, there is a possibility that we may drop to the specified range. Considering the ratio of this leg’s decline and the rise of altcoins, it can be estimated that during this bull run, altcoins with large market caps may increase by 200% to 300%, while altcoins with small market caps may rise by 500% to 700%
Feisal Baloch
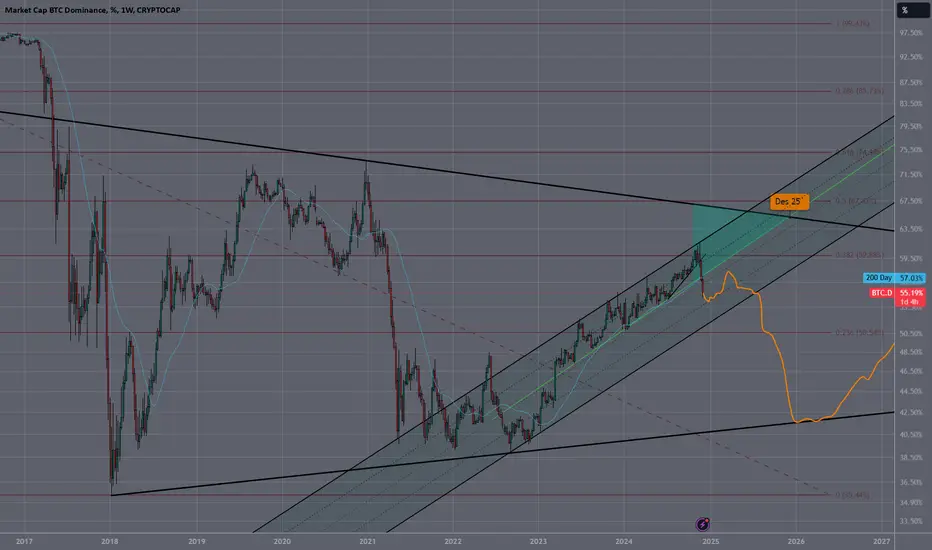
BTC.D Outlook UpdateI received a request to update my BTC.D outlook, so here it is:
We crossed my green support line much sooner than expected, prompting me to update the simple line into a more detailed channel. While this might suggest we’ve broken the support, I still believe we’re in an uptrend overall.
I’m watching for a bounce off the 25% dotted line within the channel, which sits around 54% BTC dominance. From there, I anticipate a new push higher as BTC targets $150K or more in Q1. However, BTC.D going down doesn’t necessarily mean bad news. It simply reflects more liquidity moving into altcoins rather than BTC. Theoretically, BTC’s price could rise even as BTC.D declines. Looking at pairs like Others/BTC or charts like Total10, it’s clear that altcoins are poised to outperform BTC for now, which would naturally cause BTC.D to drop.
That said, let’s not get ahead of ourselves. As long as we see a reaction at 54% BTC.D and remain within this channel, we can stay confident in the market’s structure. It’s important to remain calm and avoid becoming so heavily invested that it clouds your judgment.
This cycle’s sentiment has been quite unusual. Many expected a left-translated cycle, with a BTC cycle top before November 2024. As we’ve seen, this wasn’t the case, and BTC continues to climb. Similarly, many now anticipate a top in January, February, or March. In my view, it’s unproductive to speculate too heavily or to cling too tightly to specific narratives.
Keep in mind that many influencers earn their living through social media, and bold predictions often gain traction. However, markets and history tend to rhyme, which is why the phrase “this time is different” is often a meme in trading circles.
Best regards,
God bless

BTCD looks like to bounce more#btcd #bitcoin dominance will likely bounce again in short term, the chart says.

Bitcoin Dominance and Altcoin Season: A Cycle AnalysisThis chart represents Bitcoin (BTC) dominance, illustrating the historical and potential future market trends where altcoins experience a notable surge, commonly referred to as "alt season." This phenomenon occurs when Bitcoin's dominance wanes, leading investors to explore new projects and allocate funds into altcoins and memecoins. Historically, after significant rallies, investors often look for higher-risk, higher-reward opportunities, typically turning to altcoins once Bitcoin has peaked.
Speculative Scenarios for BTC Dominance:
The chart speculates on three different scenarios for when Bitcoin might reach its peak, subsequently leading to a drop in BTC dominance and potentially initiating a rally in smaller cryptocurrencies. These scenarios are:
Failed Cycle:
-Suggests that the top for Bitcoin is already in, indicating a potential downward trend from the current levels.
-This would lead to an immediate decline in BTC dominance, possibly accelerating the start of an altcoin rally.
Left-Translated Cycle:
-Predicts that Bitcoin will reach its peak by November 2024.
-Following this peak, BTC dominance is expected to fall, marking the beginning of an altcoin season.
-This cycle anticipates a shorter rally for Bitcoin but a quicker transition to gains in altcoins.
Normal (Right-Translated) Cycle:
-Forecasts a continued rally for Bitcoin into 2025, with a potential top around March 2025.
-BTC dominance will gradually decrease, allowing for a more extended period of gains for altcoin investors.
-This scenario aligns with expectations of rate cuts and a possible recession by winter, suggesting that Bitcoin might lag slightly compared to the S&P 500.
Personal Strategy and Market Outlook:
I personally favor the right-translated cycle theory. There is substantial evidence supporting this scenario, particularly with the anticipation of rate cuts and an economic downturn by winter. My expectation is for Bitcoin to peak around March 2025, slightly trailing the S&P 500.
However, my strategy involves monitoring BTC dominance closely. Once it breaks the green trendline and begins to fall, I will start selling my altcoins when BTC dominance has declined by approximately 15%. This approach ensures that I capture gains from the altcoin market without missing out on the selling opportunity due to an early or delayed reaction.
Balancing Certainty and Risk:
While the right-translated cycle might offer more significant gains for altcoin investors, adhering strictly to this belief without considering the left-translated cycle could result in missed opportunities. For me, securing certain gains outweighs the risk of holding out for potentially higher but uncertain returns. Therefore, I plan to act decisively when key indicators, such as the decline in BTC dominance, signal a shift in the market dynamics.
In conclusion, the BTC dominance chart provides valuable insights into the potential timing and impact of Bitcoin's market cycles on altcoins. By understanding and anticipating these cycles, investors can strategically position themselves to maximize their returns in the ever-evolving cryptocurrency landscape.

It's the king's turn, and it wants market cap dominance. Bitcoin is poised to regain market capitalization dominance. This usually means that (the majority of) altcoins will initially start losing in their sats value.
It is now a well-known phenomenon that venture capital will first pour into Bitcoin. Once people start skimming their profits, it often flows to the other top 10 coins, then the midcap coins and finally the low caps after this. That is, until the cycle is complete again and people move their capital from the low caps back to Bitcoin or eventually to fiat.
I have unfolded the Tom DeMark Sequential on this, and it flashes a 9 and even a 13, which usually means there will be a course change.

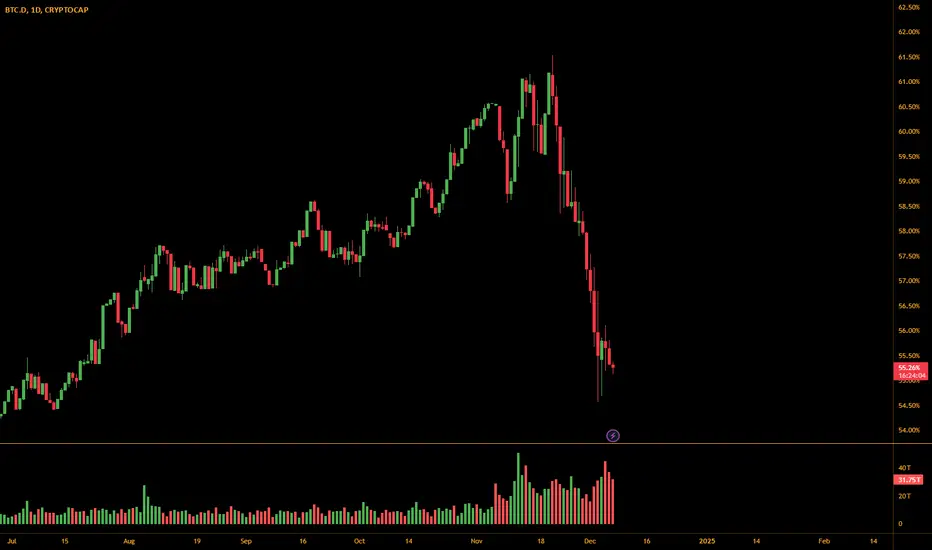
What does BTC Dominance tell?Hello, fellow traders!
This post is about the current crypto market sentiment.
As you can see from the chart, BTC Dominance has been in an aggressive decline for the last 2 weeks. It reached 61% on November 21st and is now in 55%.
While 55% Dominance is still considered moderately high, its sudden decline shows that people are gaining interest in altcoins. BTC Dominance in an uptrend suggests people are preferring BTC over altcoins due to uncertainity, fear and correction of the market. This is because BTC is safer than other cryptocurrencies. Downtrend, on the other hand, suggests people are actively seeking more adventurous opportunities.
Many of the cryptos I’ve posted last month are also showing unusual uptrends – breaking their ATH (All Time High) or suprassing MDZ (Major Demand Zone).
Crypto Fear and Greed index also reflects ‘Greed’ with the score of 75. Last week was ‘Extreme Greed’ with 84 – although it has declined slightly, 75 is still a very high score.
These indexes suggest that we are currently facing an ‘Altcoin season’.
It is very important to be extra cautious in this market condition since major demand zones and resistance levels tend to get ignored and we do not know when the correction will take place.
My advice would be to check the BTC chart regularly and trade along with the market movements. It’s probably better to diversify portfolios to include multiple altcoins rather than sticking to a few. Although I am not a big advocate for such aggressive movements, there are still opportunities in such times of uncertainties.
React, don't predict! Stay disciplined and patient. Don't get greedy and be thankful.
God bless :)
Matthew 7 21-23
Bitcoin DominanceAccording to the Bitcoin dominance chart, it seems that the Alt-Season has begun and will continue until 2026
