Alt Season is Right Around the CornerBitcoin dominance has been growing in the past few days as it outperforms the rest of the cryptocurrency market after the sharp drop last week. Many things are pointing towards Bitcoin continuing to outperform in the short term as we gear up for the next parabolic bull market.
However, alt season is very close and, once BTC confirms it's breakout towards 100k, a lot of the large caps like Ethereum and Solana will begin to go up very quickly. This is based on my cyclical analysis of alt seasons. To get a better idea of the cyclicality of cryptocurrency, Bitcoin, and alt seasons, check out my previous post which predicts the next parabolic rise in November:
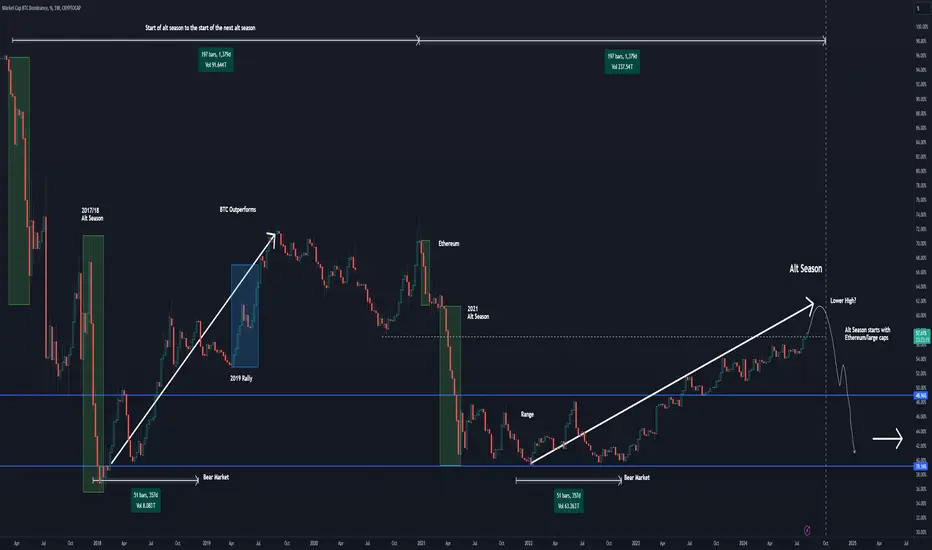
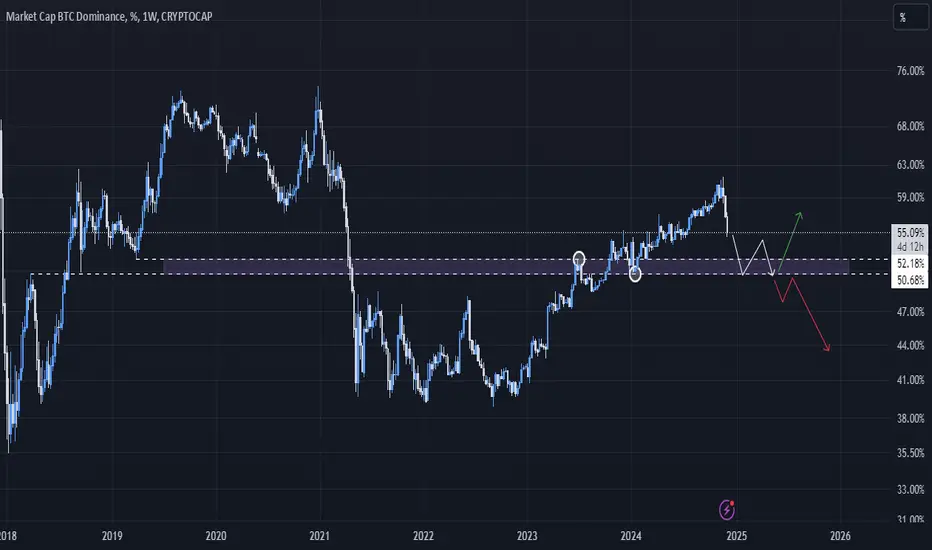
An important thing to note when referring to alt seasons is that they don't last long (only a few months). So understand your timeframe when investing over the coming weeks. Another important idea is how money tends to flow during this period. It historically starts with Bitcoin breaking its all time high and beginning to rise. During this time, altcoins tend to underperform. But once BTC consolidates and begins to go sideways, that's when the rest of the market has time to catch up. In the chart I show 4 key points:
Bitcoin
This is when BTC makes a significant breakout whether that's from a significant resistance level or its ATH. This is where BTC is outperforming 99% of the market.
Ethereum & Large Caps
BTC will begin to slow down and a lot of the major altcoins will see a big increase. This is where you can find great trade setups on the BTC pairs like ETHBTC, SOLBTC, etc.
BTC Consolidates
BTC will start to go sideways, cooling off and preparing for its next rise. From here you might see some pumps in mid-low caps. These tend to be volatile and hard to predict.
Small caps - Quick and fast
As BTC continues to go sideways, some small caps might experience quick pumps in price. Similarly, these tend to be even more volatile and hard to predict.
After this, the pattern repeats back up to Bitcoin until we reach a peak and begin a new bear market.
The cryptocurrency bull market is brewing up and alt season can offer some incredibly profitable opportunities. Plan ahead, and don't overtrade.
BTC.D trade ideas
$OTHERS Mid Cap Breakout! Alt Season!Bitcoin Dominance continues to tumble.
CRYPTOCAP:OTHERS smashes through Local Top.
Alt Season is well underway!

previous cycle - ETH vs BTC.D vs BTCBitcoin has just done the biggest dump today! from 104k to 96k. I just went through the past..
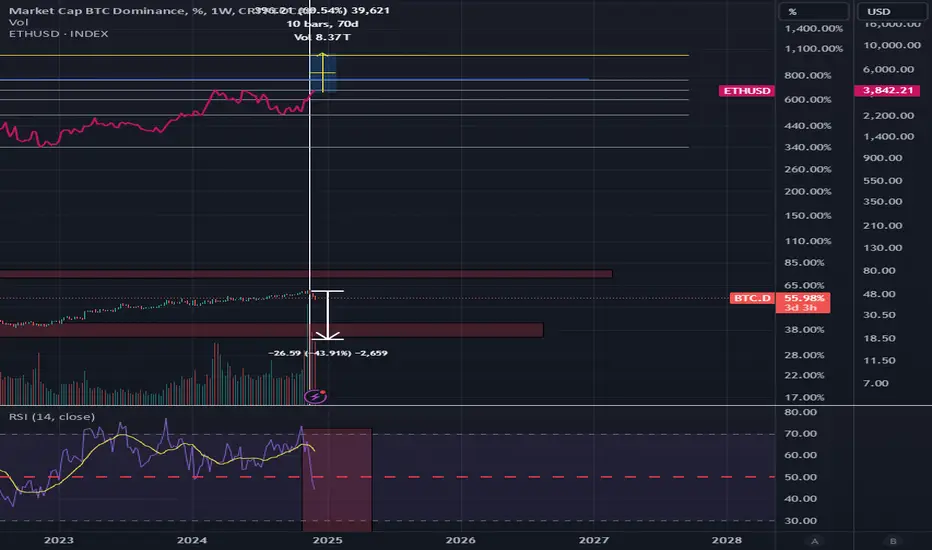
Left: ETH
Center: BTC.D (dominance)
Right: BTC
Here we have clear visibility of the rotation of funds from BTC to ETH.
We can see that on the previous cycle, after the first temporary top of Bitcoin (65k), with a bad candle closure, the dominance continued fall in down and for 2-3 weeks after, ETH registered a +70% , despite to BTC.
Hope that this could help you to stay on your ALTS plan and to don't care about the FUD you're feeling with these movements.

BTC Dominance/ eth bull market Measurement of Eth bull rally to the peak compare to btc dominance chart; attempt to time the market.
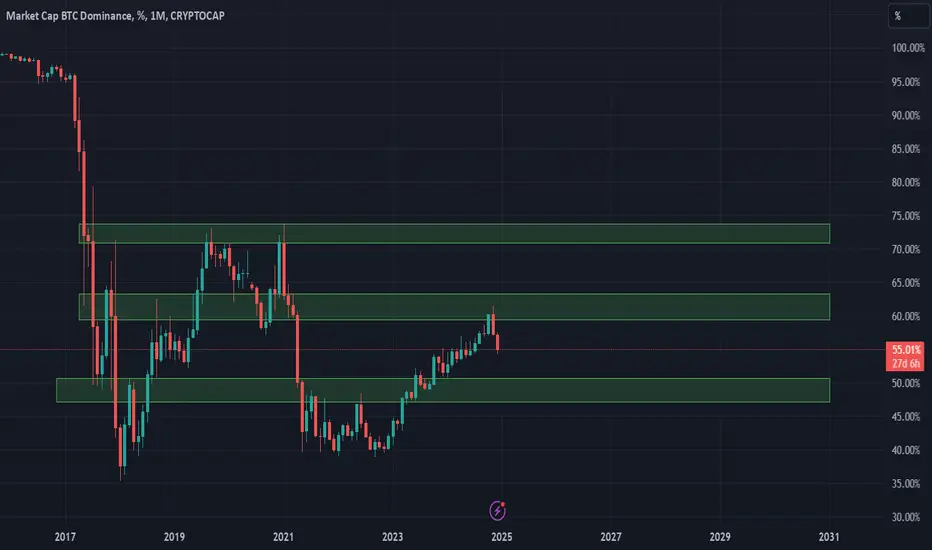
Looking at the btc D chart, trading between the 7 years zone (38% - 80% roughly). Seeing a average 44% drop in the zone can result in eth all time highs.
Looking at Eth price action, the second time btc D dropped by 44% eth rallied, eth broke last cycle ath, and made new ath. Volume did not come in until btc D rsi reach below 50 line, which are are below 50 line rn.
If we see the same move repeating, we could see a 8.5K eth confluence with 1.618 fib. I used the mean of both eth rally time range and price percentage while btc D is dropping to find a estimate of the move, which is roughly 70+ days and 60%+ in price. ( The rally can be much more significant) #ethtsunami
Keep in mind, Btc D can still move to the upside of the range before making the drop.
Please let me know what you guys think, share your thoughts with me!
Analysis btc chart
BTC Chart Analysis
In this analysis, we will delve into the current trends and key indicators for Bitcoin (BTC) to provide a comprehensive overview of its price movements.
Current Price Action
As of the latest data, Bitcoin has shown significant volatility over the past few weeks. After a recent rally that brought it to a high of , it has faced resistance at that level, prompting a pullback. Observing the daily candlestick patterns, we can identify potential support and resistance levels that are crucial for traders.
Technical Indicators
Moving Averages: The 50-day moving average has crossed above the 200-day moving average, indicating a potential bullish trend. However, if the price drops below these moving averages, it may suggest a reversal.
Relative Strength Index (RSI): Currently, the RSI is hovering around , which indicates whether BTC is overbought or oversold. A reading above 70 suggests overbought conditions, while below 30 signals oversold.
MACD (Moving Average Convergence Divergence): The MACD line has recently crossed above the signal line, which could indicate potential upward momentum in the short term.
Key Levels to Watch
Support Level: A significant support zone is observed at , where buying pressure is expected to increase.
Resistance Level: The resistance level at will be critical; a breakthrough here could open the door for further gains.
Market Sentiment
Market sentiment remains mixed, with both bullish and bearish perspectives emerging from recent news. Investors should keep an eye on global economic indicators and regulatory news that could impact Bitcoin’s price.
Conclusion
Overall, the BTC chart presents both opportunities and challenges for traders. Staying updated on key technical indicators and market sentiment will be essential for making informed trading decisions. It's crucial to employ proper risk management strategies and remain adaptable to the dynamic nature of cryptocurrency markets.
Feel free to customize specific data points or add additional insights based on your analysis!
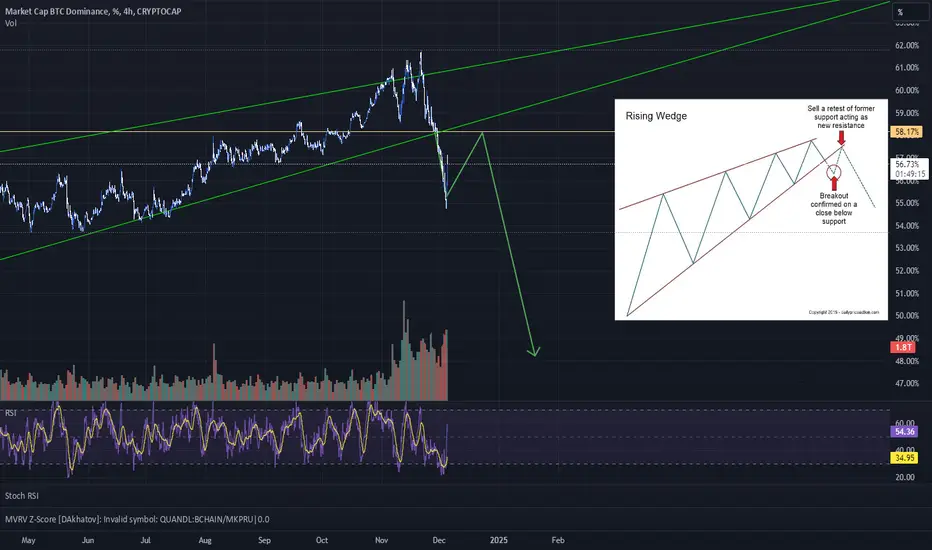
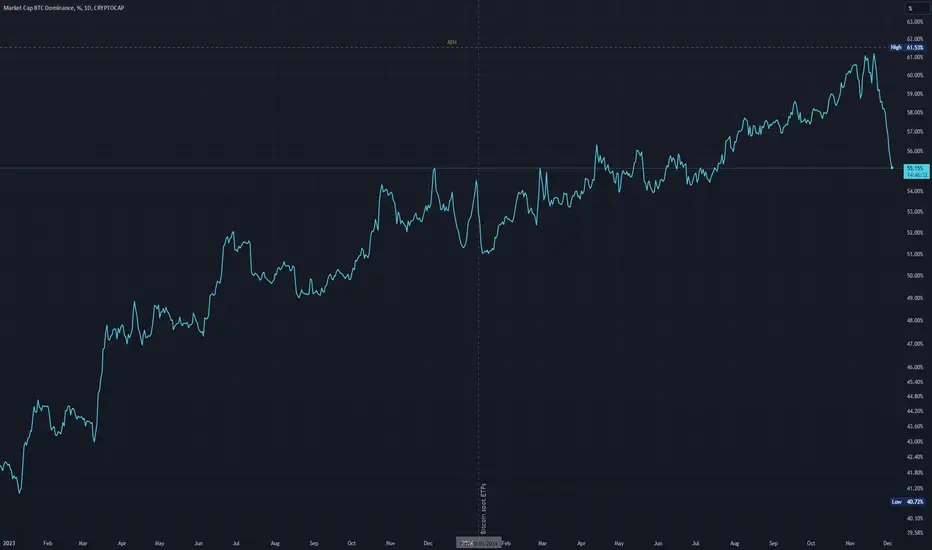
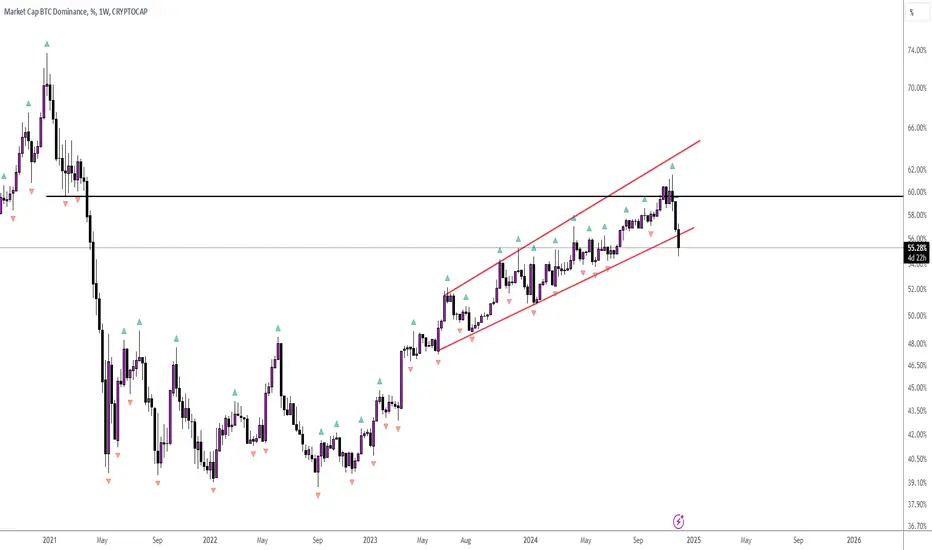
Rising wedge retestBTC.D broke down from the rising wedge, which is a bearish pattern.
A retest of the structure is likely, and can happen 2 ways.
The bad way is that the market collapses, a black swan event etc - everyone gets scared and flies to safety and sells alt coins...
OR
BTC breaks 100k, and alt coins stay stable.
This is the best possible outcome for Alt Season to start!
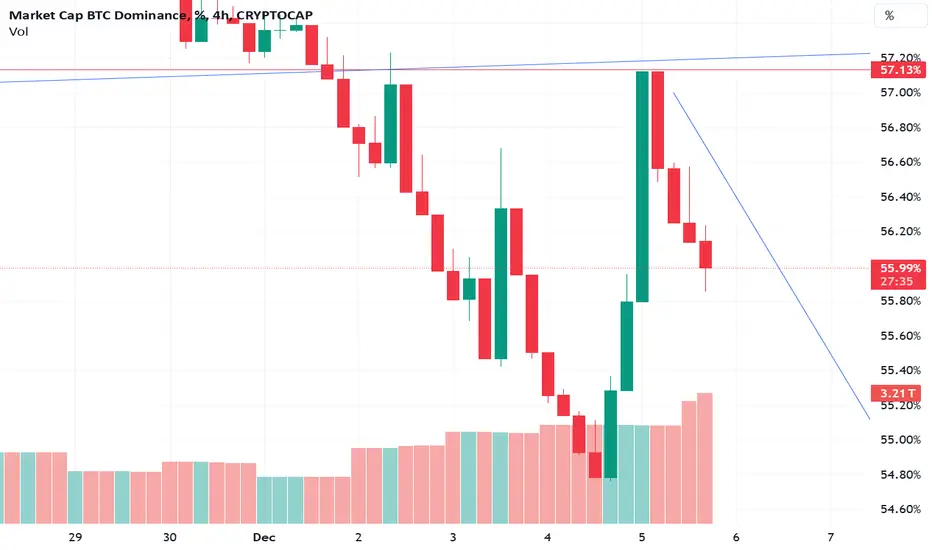
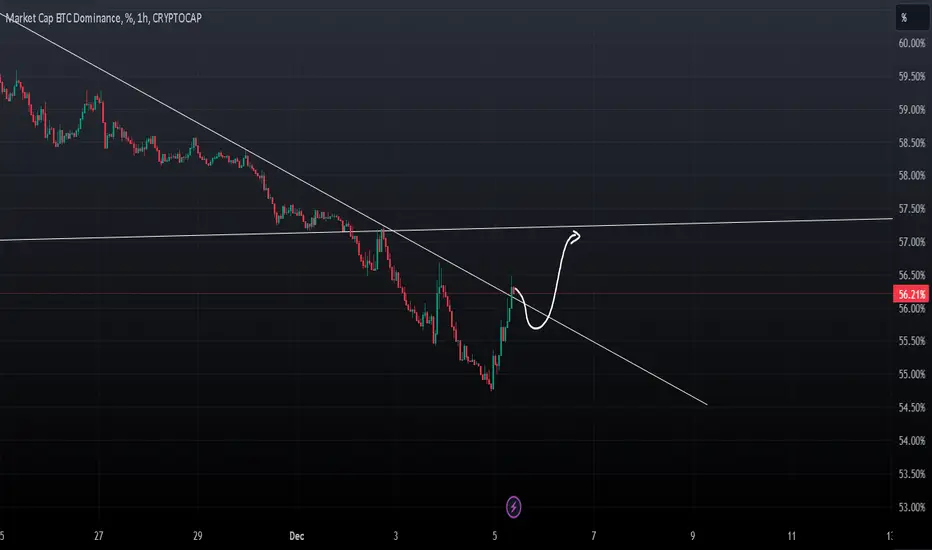
Bitcoin Dominance Will Mini PullbackDominance show strengh in H1 and H4 timeframe, after breakdown massive trendline
Maybe we can see dominance about 57.50%
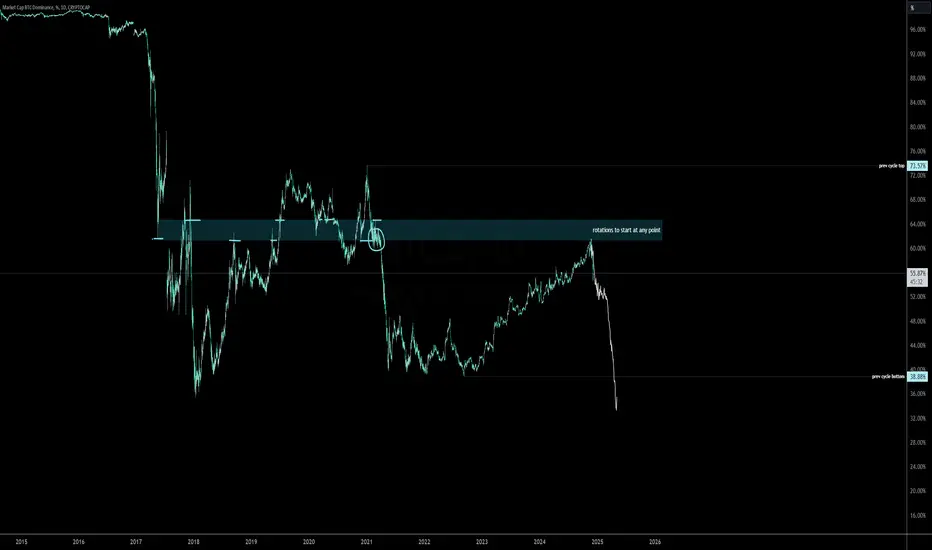
alt szn startedit is clear rotations have started and following the same pattern as 2021, same thing will happen
this time dominance will be even lower at pico alt szn, given the many different narratives and tokens that exist atm compared to last bull cycle
Btc dominance is falling This could be the sign altcoin season has started. Bitcoin is stil holding while the dominance is falling it shows whales are getting out and are looking for alt coins to invest in
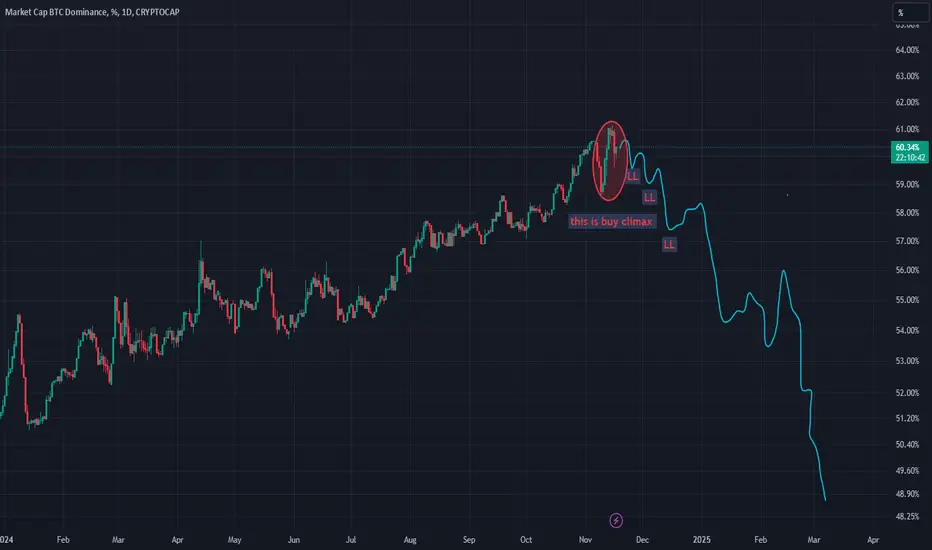
bye BTC.d welcome ALTSEASON after this buyclimax we need to see a lower low , then every up move will end with agressive movement down . this analyse will be cancled if BTC.D breaks above 61.13 % or after first higher high .
now we can say we are officially at alt seasion
this is my analyse it's not a recomandation to buy or sell !!
ENJOY
we will see a reversalonce dominance touches around that 50% area we will see a quick reversal back to the upside where the btc bull market have its final from most likely end of Q1 until mid to late 2025. Remember to take profits throughout otherwise you will be have diamond hands in this market too.
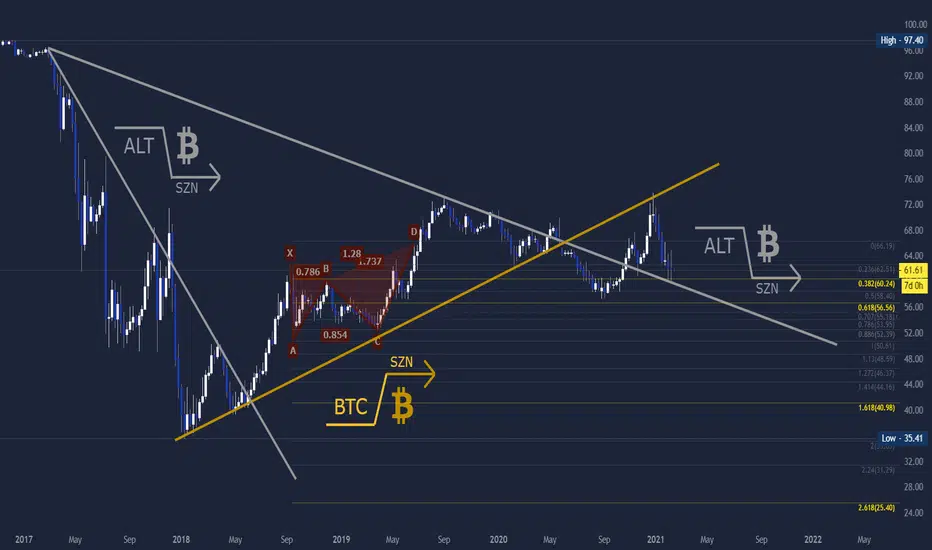
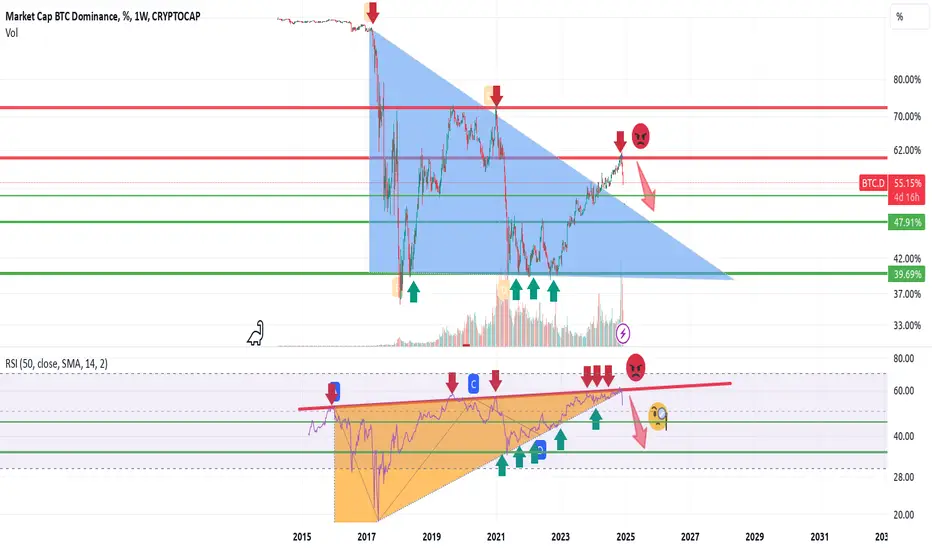
Ultimate ALT Season upon us!?This weekly BTC Dominance chart shows a clear break of uptrend and retest. The Bearish Butterfly Harmonic hit the 382 and 618 targets followed by checking back to optimal reversal zone. With where we are economically in 2021 there is something to say about this alt season that will be like no other. While the market has already been insanely bullish, over the next few weeks and months the follow thru of this pattern could cause Alt Coins to explode beyond anything anyone has ever seen. This is the most opportune tune time to get with this class of assets for ultimate profitability. The harmonicity of this market is resonating with everyone in it and will only continue to expand.
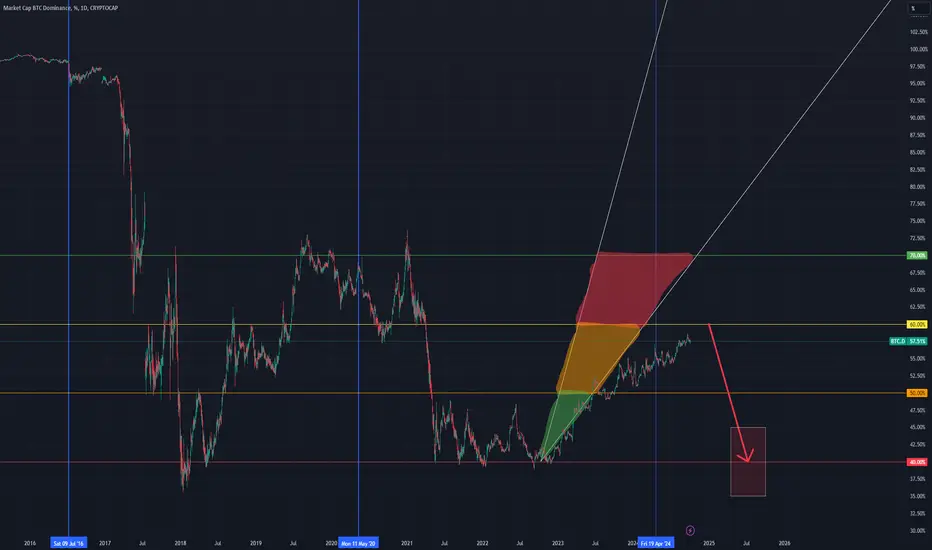
BTC dominance 2024-2025(prodolzhenie prognoza po dominacii bitkoina 2023-2024)
Proshlyj prognoz otrabotal prakticheski ideal'no, nemnogo promazal po vremeni (uskorilsya), nemnogo oshibsya s metodikoj raschyota dominacii (uchyol al'tkoiny - podrobno v obnovleniyah na proshlom prognoze po dominacii). Odnako v celom prognoz pravil'nyj!
Nakaplivat' bitkoin bylo bolee pravil'nym resheniem nezheli otkupat' al'tkoiny.
Podavlyayushchee bol'shinstvo al'tkoinov obnovilo svoi minimumy k bitkoinu.
Teper' prishla pora razvorota. Tyazhelo sprognozirovat' tochku razvorota (kak eto bylo s proshlym prognozom) kak po vremeni tak i po urovnyu, odnako ya sklonyayus' k variantu chto eto proizojdyot ot 55-65% vo vremennom promezhutke konca2024 achala2025 goda. I ustremitsya v blok 35-45% k koncu 2025 goda.
!!! Etot prognoz bolee kak prodolzhenie v popytke najti mesto razvorota, a ne kak samostoyatel'nyj predydushchij prognoz. Ya by ne stavil mnogoe na nego, odnako tendenciya dolzhna byt' yasna - gryadyot al'tsezon.
btc dominance - two senario btc.d has a strong SR . you can see on the chart . and has two senario for future . lets see next
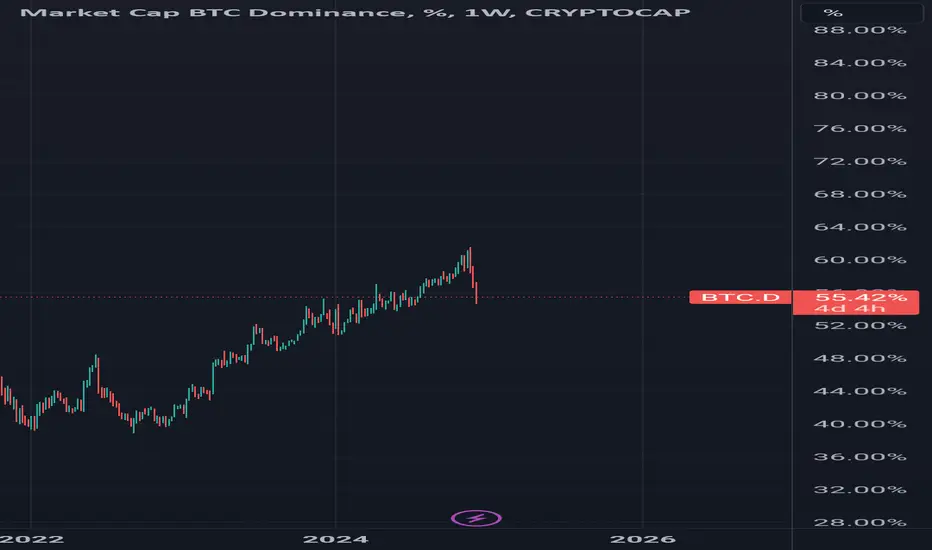
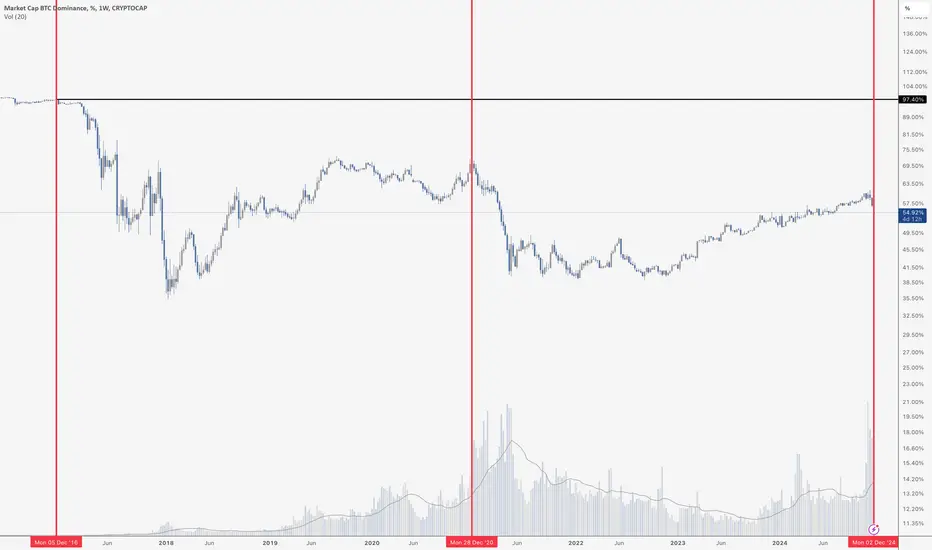
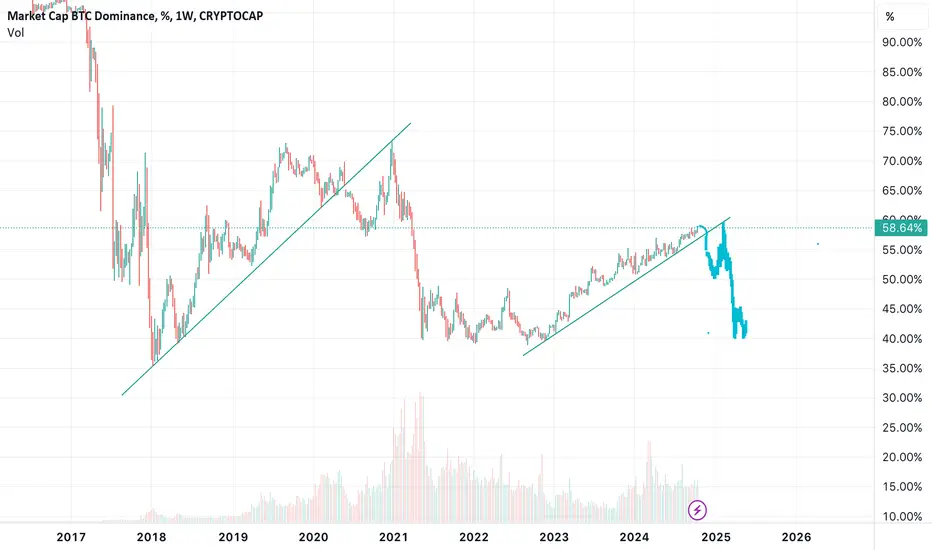
Bitcoin Dominance DivesDominance is falling off of a cliff, as expected. The 4-year cycle remains almost perfectly intact, which is quite astounding. Bitcoin makes a move 6-8 months after the halving, consolidates, and altcoins go crazy. As you can see, we are back in December… 2016, 2020 and now 2024. In these years (so far) Bitcoin Dominance has topped and fallen… hard. It seems to be happening again, with Dominance at below 55% after topping at almost 62% just a week and a half ago.
Have fun trading altcoins while it lasts!
BTC DOMBTC DOM
i gotta post this. did this months ago and its just unfolding all over again lol
the trend pivot seems kinda clear, coming up fast. hold strong, then flip at pivot.
less go

Bitcoin is taking a breathWhile the whales are pumping alts to subsequently flush out the naive fools, bitcoin is taking a breath to break $0.1M.
I believe we are nearing the bottom of bitcoin dominance among cryptocurrencies after the Wall st. takeover. All the cryptocurrencies that have managed to pump a little bit against BTC in the meantime will soon crash back down again and look for new lows in the BTC pair.
Don't worry about fiat charts, compare to BTC!
aLt SeASoN 💩? No, really don't!
There is only bitcoin season, always has been. There is no cryptocurrency over five years old that comes close to ATH against Bitcoin.
Stay humble, stack sats.
Bitcoin Dominance (BTC.D) Prediction - Time 1W (Update)Trend Prediction - BTC.D Forecasting -
Resistance and Support Lines
When the Bitcoin Dominance Chart (BTC.D) decreases, money exits Bitcoin and may move into USDT or other coins !
We should keep an eye on Bitcoin's price, as it should either consolidate or not drop significantly!
**** Yousef Sharafi ****
Follow me here for more analysis
BTC DOMINANCE IS TOPPINGIf you're an altcoin holder, this is what you want to see.
BTC D is showing signs of topping and rolling over soon. This could see an alt season from December peaking in Feb-March.
Good luck!
BTC DOMINANCE BEARISH DIVERGENCEAs discussed previously, my bias is that BTC Dominance is topping out.
You can see we have reached higher highs on the chart but the RSI and Stoch RSI are at lower highs.
This shows we are losing strength and is signalling a downtrend soon

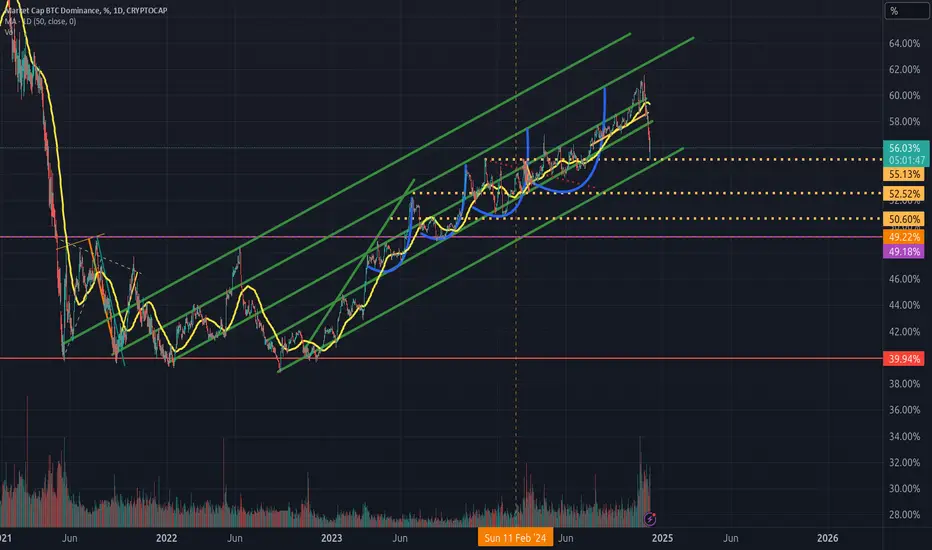
Bitcoin dominance Dominance can find support at 54% .
After that a push to the upside and hit 58% where the retest of the uptrend is located and then start crashing down towards 35-40% region.

Alt-season is about to startBitcoin's dominance has been broken, and it has moved outside of its key annual dynamic support. We would expect an ascending capital-raising trend-line for other assets in the market.