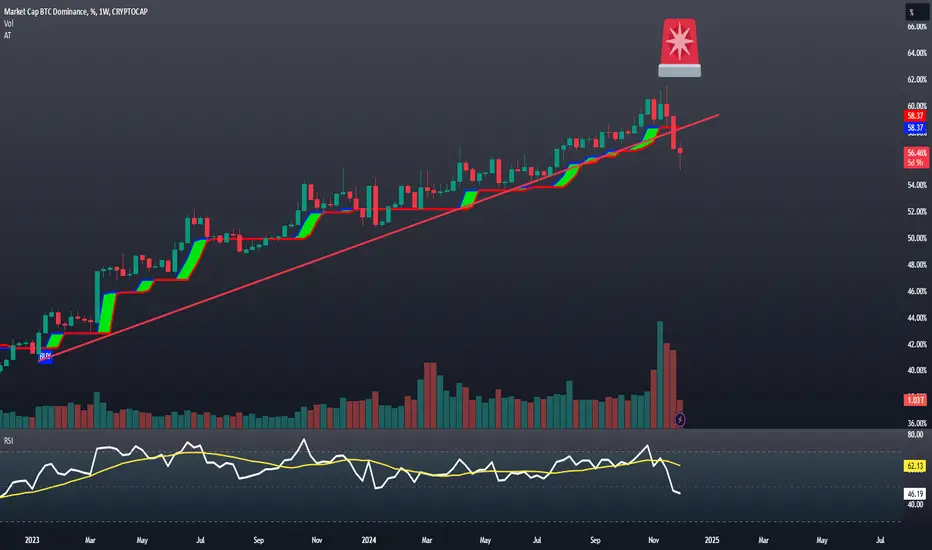
The Rising Trend in Bitcoin Dominance Has Been Broken!On the weekly chart, Bitcoin dominance has fallen below a critical support level for the first time in 693 days. Could this give altcoins some breathing room?
The answer is short: yes.
The negative divergence present in the dominance RSI has played out. Additionally, RSI has dropped below the 50-point mark on the weekly chart, which is significant for the continuation of the downtrend. When we analyze ADX DI, we see signals that support the downward trend in dominance. Furthermore, BTC.D has broken the ascending trendline (marked in red), which had persisted for 98 weeks.
As a bonus, our AlphaTrend indicator's ascending trend support is at the 58.50% level. If BTC.D closes below this level, AlphaTrend is set to generate a sell signal for the first time in approximately 123 weeks. The weakening of dominance has already started reflecting positively on altcoins. However, there’s no need to get overly excited yet; we must continue making data-driven decisions.
A decline in dominance alone does not guarantee an altcoin rally. However, the potential end of Bitcoin's market hegemony is a highly positive signal for altcoin investors.
Thank you for reading!
BTC.D trade ideas
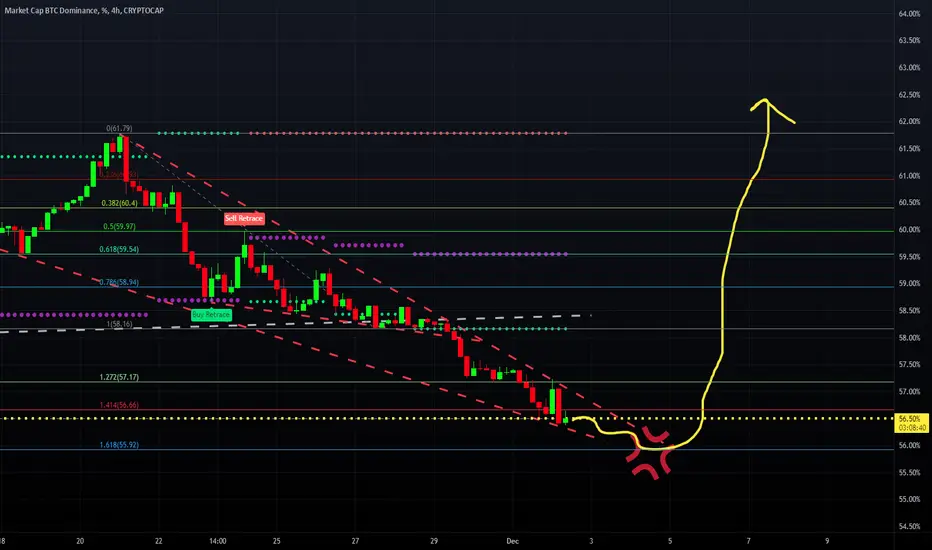
Bitcoin Dominance and Altcoin PerformanceAs anticipated in our previous analysis, Bitcoin dominance has encountered resistance at around 61%, subsequently declining to its current level of 55.6%, where it is now testing a significant support zone.
At this juncture, we may observe a potential bounce at the current support level. However, should the downward trend in dominance persist, the next critical support level to monitor is approximately 51%.
While we are witnessing substantial gains in altcoins, attributed to the recent decline in Bitcoin dominance, it is important to note that we are still in the early stages of this market shift. Current indicators suggest that a full-fledged altseason has yet to materialize, although we are moving in a positive direction.
In summary, the key support levels to watch are as follows:
55.6% (current level)
51%
The 2022 lows at 39%
We will continue to provide updates and further analysis as the market situation evolves.

Nah. Accumulation schema, right?Ok, probably standard accumulation, see schema.
Wyckoff accumulation schema. IMO I would be patient.

Bitcoin Dominance Collapsing, Altcoin Season is Comming!Bitcoin dominance (#BTC.D) has fallen off a cliff: down almost 9% in 11 days, from 61.5% to 56%. That's a seriously rapid shift given its sizeable market cap ($1.9T).
This is traditionally the point in the cycle where many altcoins go parabolic, as capital rotates into higher risk, lower cap plays.
We've definitely seen early signs of that 'banana zone' side of things -- with XRP up 115% in the last 7 days, for example.
Only this time, capital isn't rotating out of BTC in the same way -- much of it is fresh skin in the game. Total market cap of the digital asset space is up over $1.2T since the beginning of November. And on the BTC front, MSTR and ETF inflows aren't slowing down either. Indeed, there are no present signs bitcoin is anywhere near the top -- in my opinion it's just getting started.
It's going to be really interesting to see what happens this cycle -- the first cycle with institutional money and emerging regulatory frameworks.
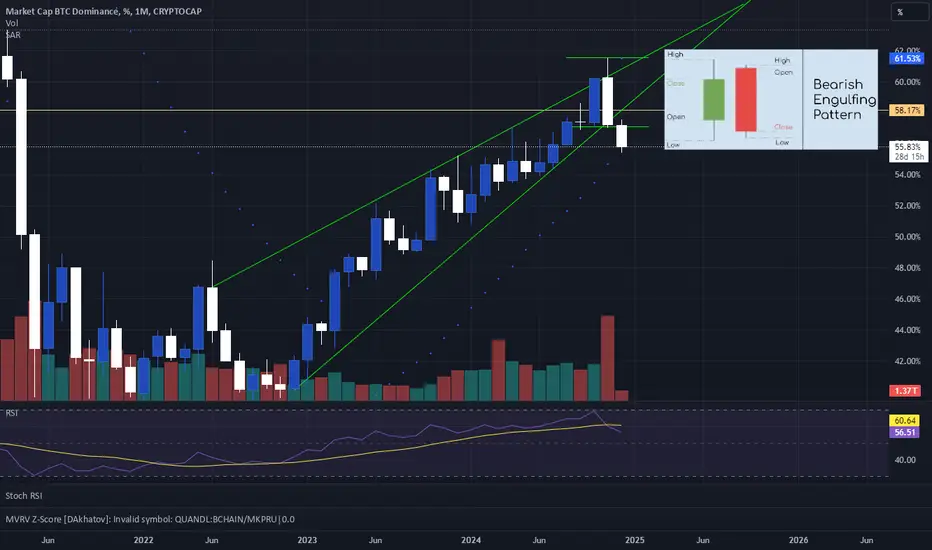
Monthly bearish engulfing candle, at the extremes Monthly bearish engulfing candle, at the extremes. Usually a trend reversal candle.
Break down of a rising wedge.
What a time to be alive
A rest of the structure will be likely - but I think its safe to say that alt season is here!
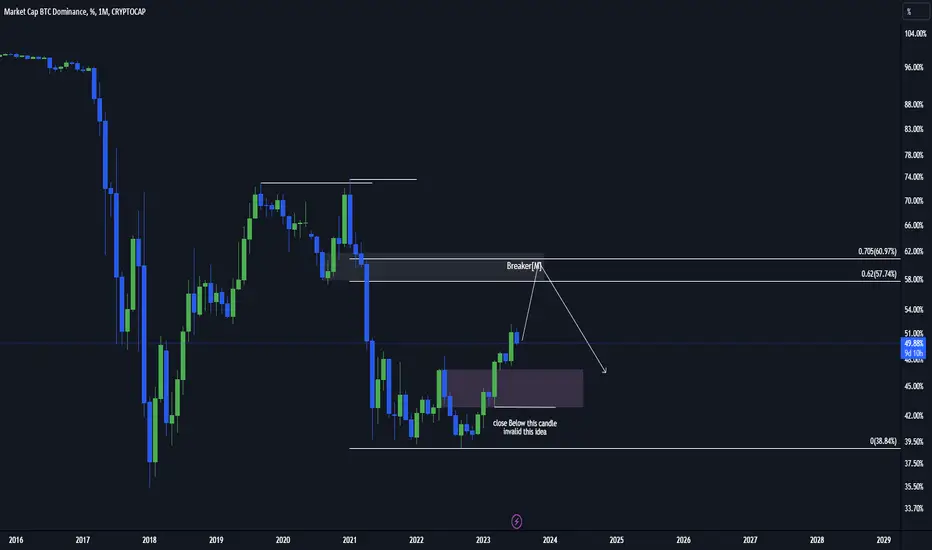
Bullish At present, the indications suggest a potential upward movement in the BTC.D. Ideally, I am aiming for a 60% Bitcoin dominance scenario, where I can confidently allocate a substantial amount of capital in alts coins, anticipating promising rewards in the coming years.
$BTC.D dominance again overheated. Time for the Alts to catch upCheck out this chart— CRYPTOCAP:BTC is on fire, but the market? Totally overheated. 🚀🔥
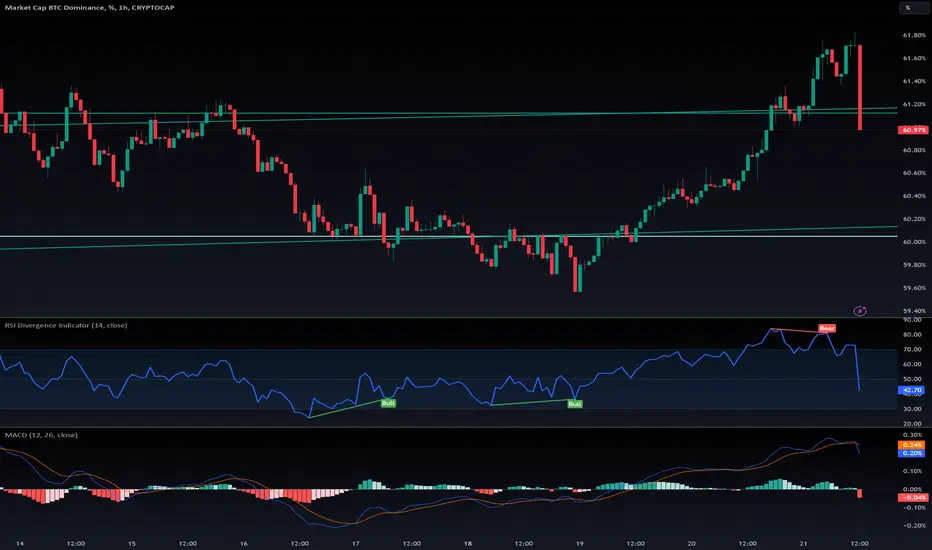
Sure, CRYPTOCAP:BTC dominance had its pump, but now all the indicators are screaming *RED ALERT*:
- **RSI** is overbought with a bearish divergence.
- **MACD** just hit a bearish crossover.
- Sitting pretty (or not) at the **61% resistance**.
Translation? We’re ripe for a (much-needed) dominance correction. Expect CRYPTOCAP:BTC to chill sideways this weekend, with a likely correction kicking off next week.
Now, about those altcoins... 🤔 The memes have already had their moment—most hitting ATHs. But hold up! There's still plenty of action brewing:
CRYPTOCAP:ETH is waiting to pump, all the DEFI ( CRYPTOCAP:RUNE , CRYPTOCAP:UNI etc..) are waiting to pump.
Some great projects are under valuated like CRYPTOCAP:INJ
Also the L2 and L1 haven't pumped yet, think about CRYPTOCAP:AVAX , SEED_DONKEYDAN_MARKET_CAP:MATIC etc...
Ket's start an altseason! Even a mini one, for Christmas!
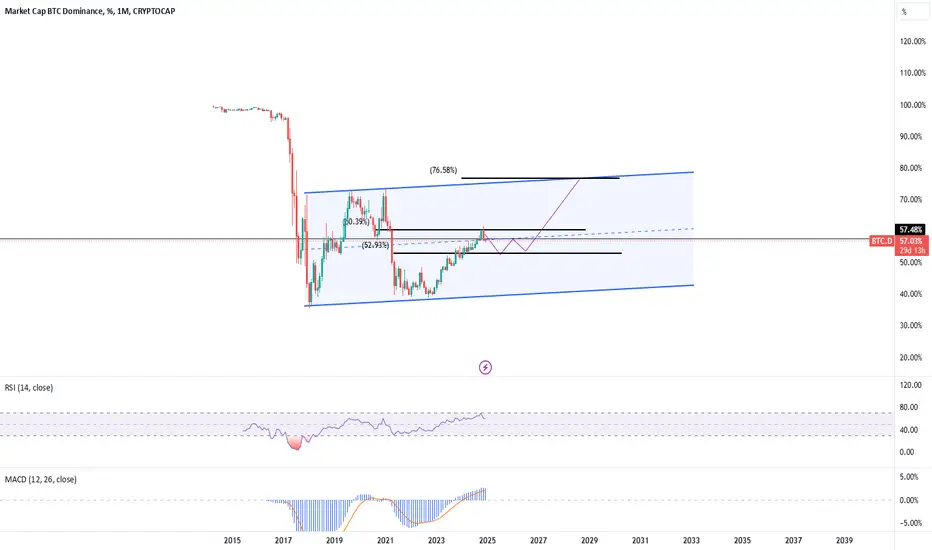
BTC Dominance Chart - BITCOIN DOMINANCEBTC Dominance is the most important chart to follow to understand whether the crypto market is in an altcoin or Bitcoin season.
Currently, Bitcoin Dominance is in a strong bullish trend and has reached the 60% level. This means that Bitcoin alone holds 60% of the total crypto market value. In other words, the entire altcoin market, including ETH and other large-cap coins, represents only 40% of the market. Considering the crypto market has over 2,500 different coins/assets, it’s notable that all of them combined only account for 40% of the total market value, while Bitcoin alone makes up the other 60%.
In previous bull market cycles, this chart typically shows initial bullishness, followed by a strong reversal to the downside after a few months, which brings the largest returns in the altcoin market.
A bullish trend in BTC Dominance indicates that Bitcoin will outperform altcoins, whereas a bearish trend suggests the opposite.
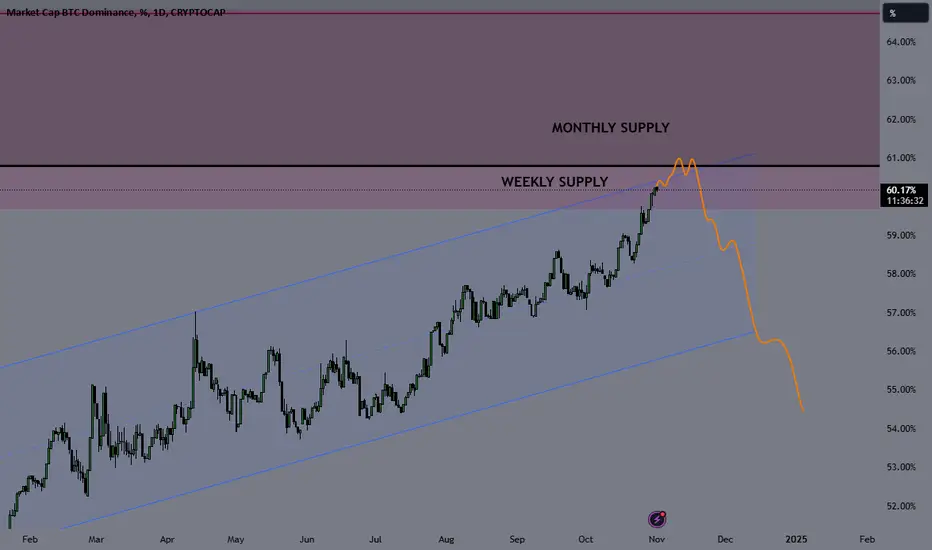
Currently, BTC Dominance is moving within a parallel channel driving its bullish movement. It has reached the weekly supply level and is now approaching the monthly supply level. I expect BTC Dominance to hit this monthly supply level at the top of the channel, experience rejection, and start moving lower. Eventually, I anticipate it will break below the entire channel, signaling a large influx of capital into altcoins. This shift has the potential to create significant returns for altcoin investors.
I believe this scenario is likely during the 2025 bull cycle, so be prepared to build generational wealth.
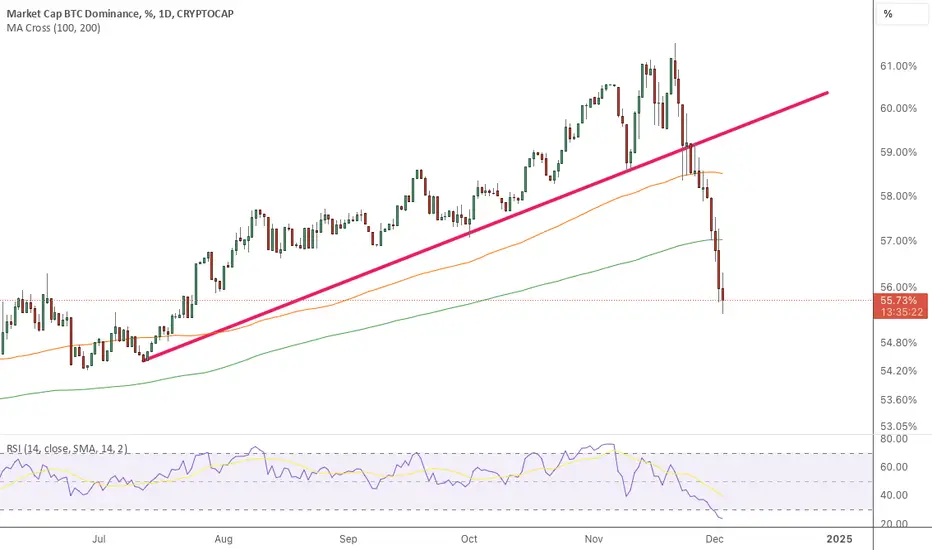
BTC Dominance Update (1D)This analysis is an update of the analysis you see in the "Related publications" section
The previous support level analysis has underperformed. It appears that Bitcoin's dominance may drop to a lower support level.
This means that altcoins could continue to pump further, and for now, no price correction is expected!
For risk management, please don't forget stop loss and capital management
Comment if you have any questions
Thank You

Is It Really Happening: When Altseason Will Begin?Hello, Skyrexians!
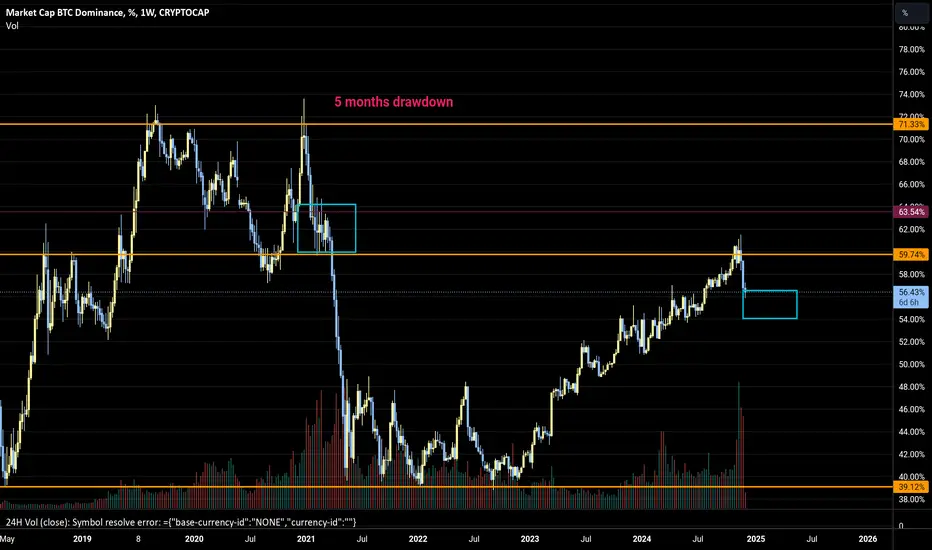
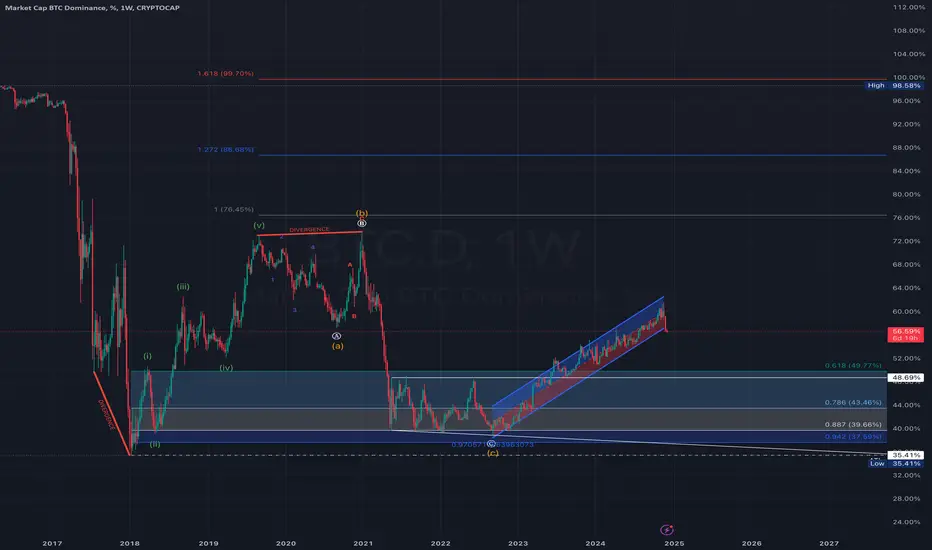
Today we will observe the CRYPTOCAP:BTC.D chart, this is the chart which shows the Bitcoin dominance on the crypto market. During last 2 years it has growing slowly, but permanently. It caused to this strange cycle where Bitcoin has broken ATH, while some altcoins set the new low every month. Is this nightmare really finished or altcoins will continue suffering? Let's discuss today.
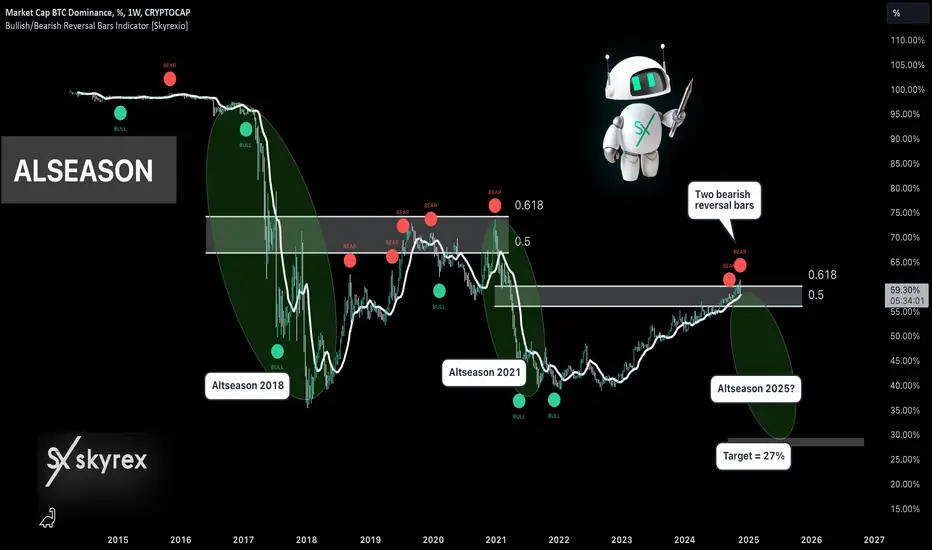
On the chart you can see weekly time frame which showed two completed altcoin seasons: in 2017 and 2021. Last altseason has started after reaching 0.618 Fibonacci level from the previous altseason. Then we saw the big drop to 40%. Let's notice that this altseason has been started after flashing the signal on Bullish/Bearish Reversal Bar Indicator . As always, alerts from this indicator are automatically replicated on my accounts. You can find the information in our article on TradingView .
Currently this indicator has been flashed 2 bearish reversal bars in the 0.61 Fibonacci retracement zone. If today weekly candle closes with this signal and next week there will be the confirmation - 58% breakdown, there is a high chance that real altseason come the market.
Best regards,
Skyrexio Team
___________________________________________________________
Please, boost this article and subscribe our page if you like analysis!
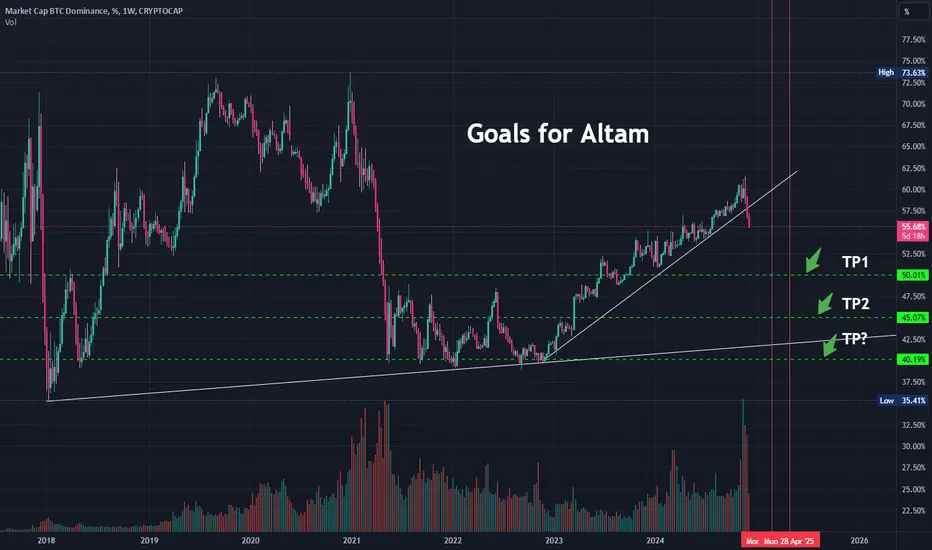
A glorious Alt Season is upon us!It appears that the Bitcoin dominance has finally started to decline. I believe that the dominance will hold steady as it did during the previous cycle, as Bitcoin makes one more push higher, and then decline even more rapidly as the peak pandemonium commences. I'm expecting a bottoming in Bitcoin dominance around April of 2025 plus or minus a couple months just based on historical timing.
At the moment, Bitcoin is in a consolidation for possibly the next month or so it appears.
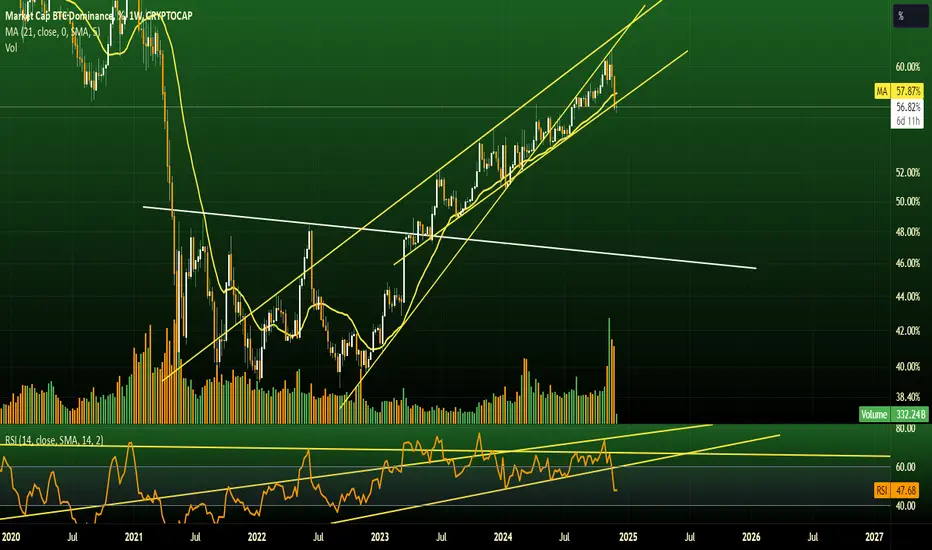
1.5 Year BTC Dominance Wedge Finally Breaks!Traders, for a year and a half we have lived inside of this bearish BTC.D wedge. Well, last week it finally broke. This week it looks like we'll get our confirmation of this break. This means altcoin season is officially underway (if you haven't had proof enough already).
As BTC continues its sideway price action, various alts have been taking their turn playing catch up. I expect this type of price action to continue through December for alts though they may incur a bit of a pull back at some point as BTC.D heads back up to retest the underside of that wedge. Once hit though, expect our alts to run again.
✌️ Stew

BTC.D More Down and then BOOM!Bitcoin Dominance is going to play this wedge out, it looks like. Then we can see the real push to 100k++!!
IS #Altseason 2024-25 finally Start?? HOLD OR SELL!!#BTC.D (BTC Dominance):
BTC.D Finally Rising Wedge Downside Breakout is Confirmed..😊
Long Awaited #Altseason 2024-25 is finally Started..
hold your altcoin and enjoy the raid..
but don't remember to book your profits..
🥰If you find this helpful and want more FREE forecasts in Tradingview😍.
Please show your support back🙏,
Hit the 👍 LIKE button,
Drop some feedback below in the comment✍️!
❤️🤝 Your Support is very much 🙏 appreciated!❤️🤝
💎 Want me to help you become a better Crypto trader?
Now, It's your turn!
Be sure to leave a comment; let me know how you see this opportunity and forecast.
Trade well, 💪
#BTC.D #CRYPTO #BULLISHRUN #BINANACE #ALTCOINSEASON #UPTREND
#btc dDominance of Bitcoin gives the possibility of a timely correction in Bitcoin and growth in the rest of the coins
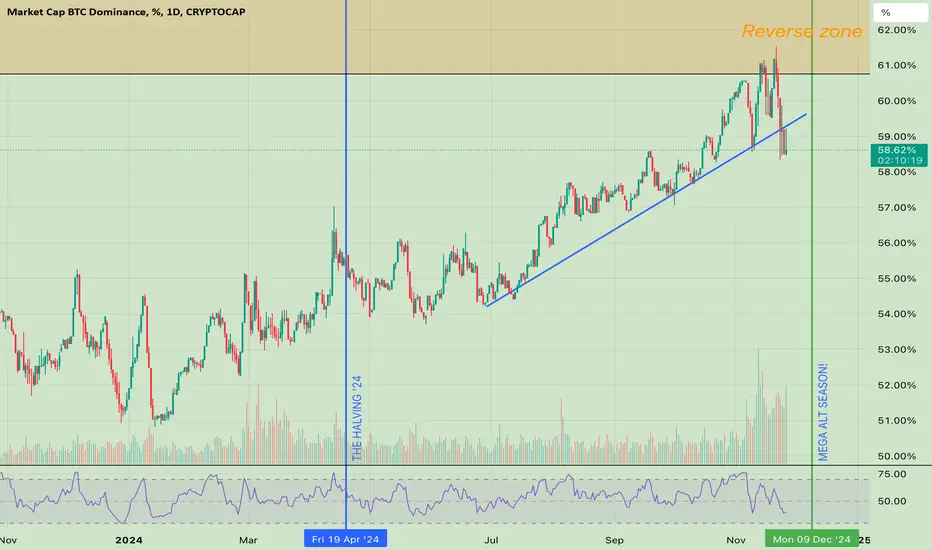
MEGA Altseason incoming?Did the #BTCDOMINANCE just broke the trendline?
Did the #BTCDOMINANCE reversed from my reverse zone?
Do we finally getting a MEGA #ALTSEASON?
BTC dominance just made a perfect retest#bitcoin #btcdom chart has bounced with recent dump. If this' a probable successful retest, then #altcoin dump sessions and #btc + #usd domination will be likely necessary.

BTD.D Broke down the bullish trendAs you can see the dominance of BTC is weaker in the last 2 weeks right now the up trend is over for a short period the market will take some profit of BTC and finding a new ALT to gain more profit.
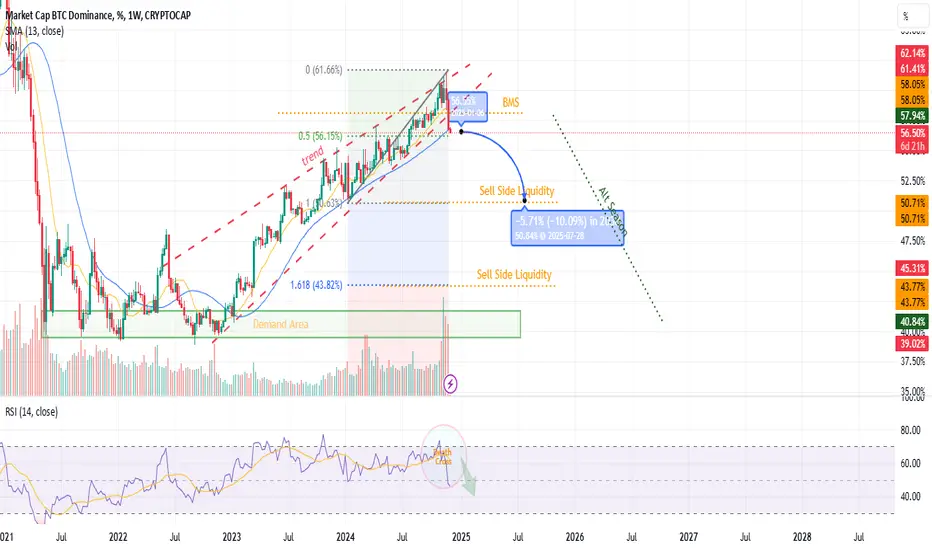
BTC Dominance Weekly OutlookAlt Season Potential
A BMS (Break of Market Structure) has occurred in the bullish trend, showing a change of character to bearish, as seen from the candle indicating heavy selling pressure.
If the trend continues, BTC dominance would correct to the nearest SSL at Fibonacci 50.71%, and if it cannot hold, a deeper correction would occur at Fibonacci 1,618 at 43.77%, indicating the occurrence of Alt Season.
BTC dominance is falling, capital is flowing into altcoins!Hello everyone, as we can see, for a very long time, BTC's dominance over the rest of the market was gaining strength, but now we can see how the level of dominance has broken out of the upward trend channel, which is causing a rebound and the transfer of capital into altcoins.
The flow of capital gives clear and significant increases on the market, and therefore many cryptocurrencies benefit from an increase in price.
It is worth looking at the RSI indicator, which also indicates that the energy used is used to flow capital into the rest of the market, and what is more, it can be seen that there is still room for a stronger decline to the support places indicated on the chart.

Bitcoin Dominance Halving Cycles and Alt SeasonsThis chart shows that in the 2 recent halving cycles Bitcoin Dominance had a massive pullback 240 days after the halving. We are now approaching the next 240 day cycle after the most recent halving earlier this year.
240 Days after Halving = December 17 2024.

BTC DOMINANCE Update (1D)This analysis is an update of the analysis you see in the "Related publications" section
In the previous analysis, the price didn’t reach the red zone and experienced a heavy drop, exactly as expected. This highlights the importance of this level.
However, before anything else, you should know that from the green zone, we anticipate a significant pump in Bitcoin dominance, which will lead to an altcoin correction. When this zone is reached, you should sell your altcoins to be able to buy them back at the bottom.
Stay with us to capitalize on the altcoin season!
For risk management, please don't forget stop loss and capital management
Comment if you have any questions
Thank You
