$BTC.D + $USDT.D + $USDC.D = Flight to Safety Breaking DownFLIGHT TO SAFETY chart is breaking down.
Once the 20WMA breaks under the 50WMA the flood-gates are open.
BTC.D trade ideas

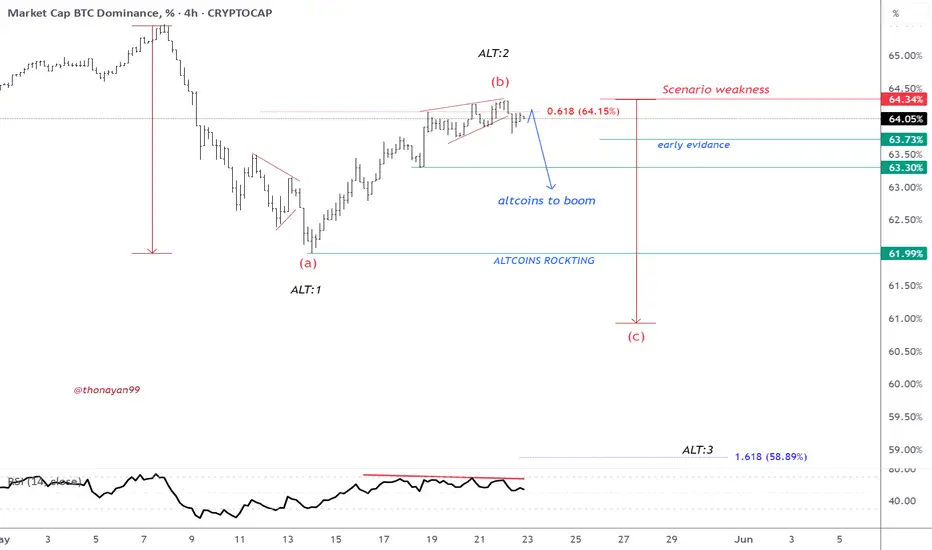
WhEn ALTCOINS SEASON ?!
well according to the chart, the altcoins season might start very soon and if we start to see break under the green lines levels then this might ignite the altcoins season. first break under 63.73% level might gives us an early evidence to support the idea and break under 63.3% level might confirms the possible start of altcoins season, hopefully, and the more it dips it makes altcoins even rocketing to the top. on the other hand, going back above 64.34% might weakness or at least delay this idea.
good luck
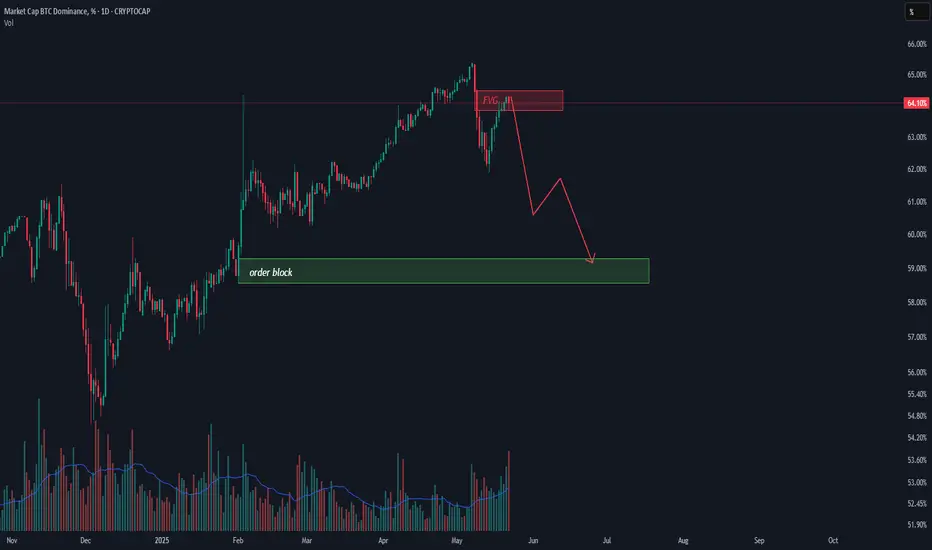
BTC dominance next move (maybe) looking at this BTC Dominance chart, we’re currently sitting around 64.13%, and price just tapped into that red zone marked as “FVG” — that’s a fair value gap, basically an area where price moved too fast before and didn’t fill orders properly as you see this is my take on BTC Dominance and i think its going to the order block that its around 58%
this is just my take, not financial advice. No one can predict the crypto market with certainty. It's wild and full of surprises, so always do your own research and stay sharp.
BTC DOMIdea regarding your day is good to have you and I can do the best you and your day is good to have you in our thoughts and I will send you the best I will send it out tomorrow night I can
Bitcoin Dominance Breaking Below Support!🚨 Bitcoin Dominance Breaking Below Support! 🚨
I can smell the money flowing into altcoins 👃💰
When BTC dominance drops, it's usually a sign for a potential ALTSEASON 🚨📉
What altcoins are you holding?
Bitcoin Dominance Dropping AgainBitcoin Dominance rose for over a week, causing altcoins to once again underperform Bitcoin as it rose to new highs. This is normal in a real cycle - Bitcoin goes up, then sideways, altcoins go up, then the interest goes quickly back to Bitcoin. It is difficult to play the moves, but exciting to see the trend return after many years.
Today, once again, we have Bitcoin settling above a new all time high and altcoins outperform since. It feels like we are finally about to get a true bull market, but always proceed with caution.
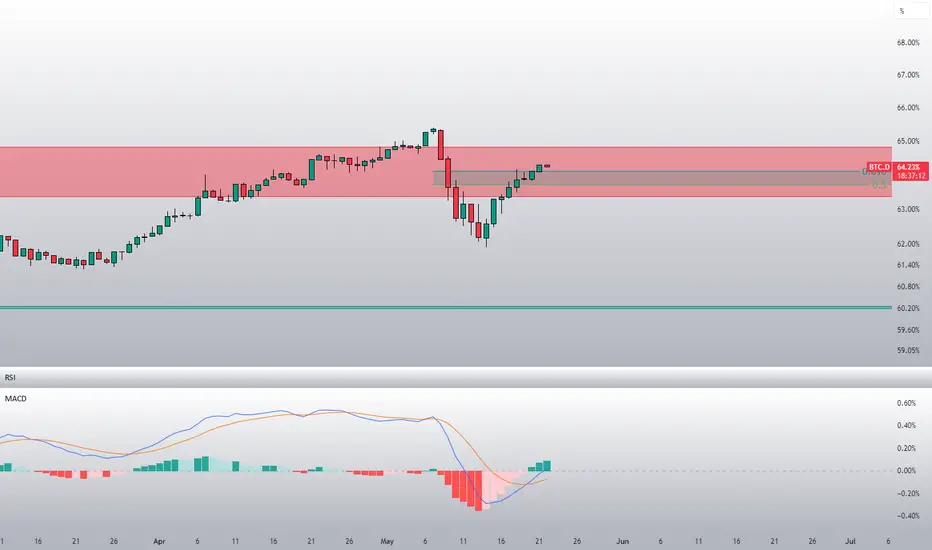
BTC Domincance looks bearish on the 4H ChartBitcoin Dominance has lost momentum and forming a small bearish divergence on the 4H chart. The 0.5 fib level might act as support but if it fails to hold alt coins may see liquidity coming towards them especially the blue chips like Ethereum.

BTC.D Don’t let them mess you around.Don’t let them tell you it’s too late to buy crypto—most of those voices have no clue. Right now, take your capital allocation X and deploy it equally across the top six coins by market cap; you can still lock in solid gains by early September or, at the latest, late October. Then set aside 10 % of that same X to spread across the top 20 meme coins on the leaderboard—sit back and watch for potential 10× to 50× returns. Good luck, stay disciplined, and blessings!
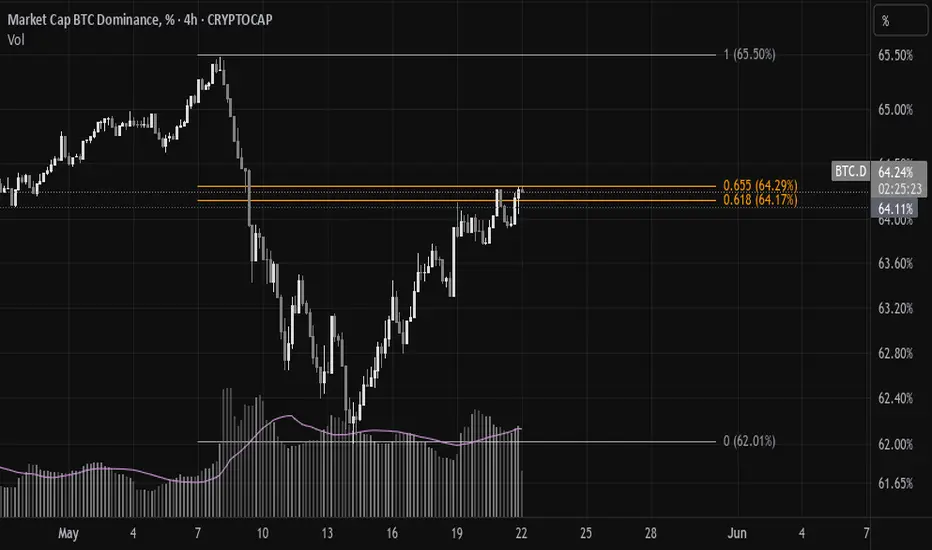
It looks like BTC.D isn't finished yetBTC.D broke above the golden pocket of its previous down move, and the daily MACD crossed bullish. It looks like another leg up.
Altseason Start Fibonacci 0.618, often referred to as the "Golden Ratio", is a key level derived from the Fibonacci sequence. As the numbers in the Fibonacci sequence get larger, the ratio of one number to the next approaches approximately 0.618 (or its inverse, 1.618). This value is known as the Golden Ratio.
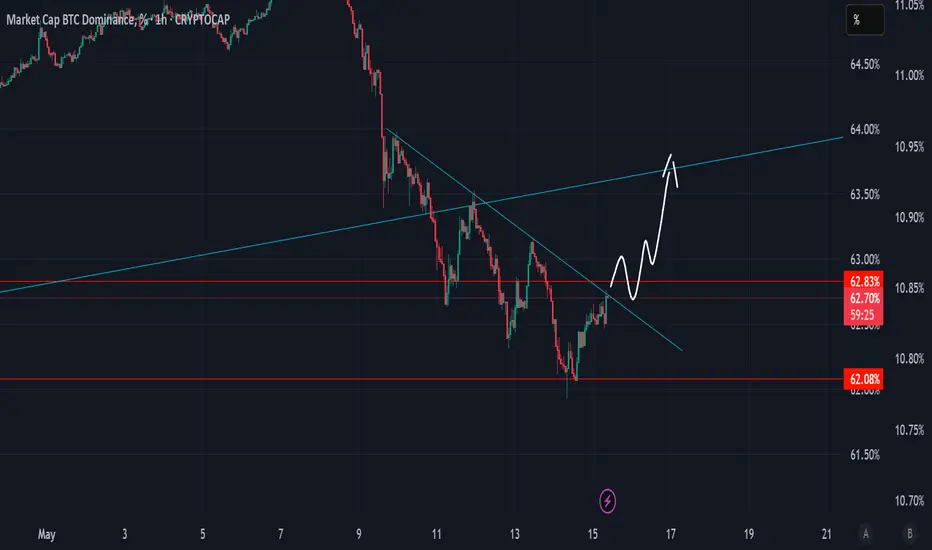
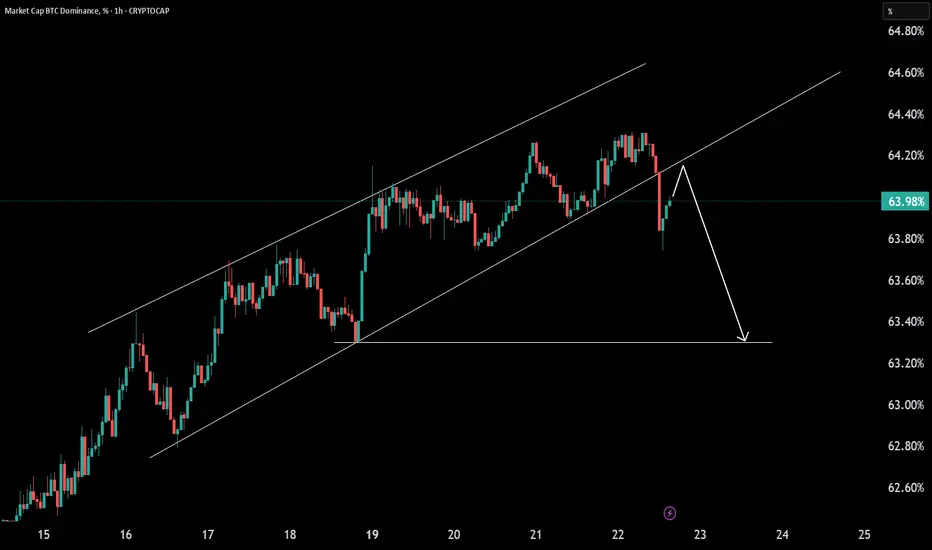
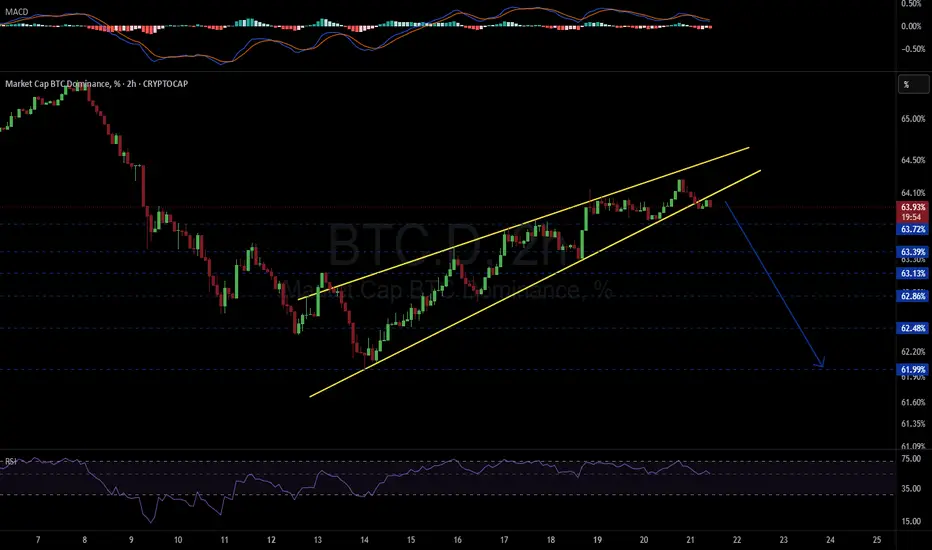
BTC.D 2H BTC dominance 2H timeframe:BTC dominance has broken below the rising wedge on the 2H chart — a classic bearish signal.
If it retests the breakdown level and holds, we could see more downside…
And you know what that means — lower BTC dominance usually means altcoins are ready to pump!
🔥 Keep an eye on it!
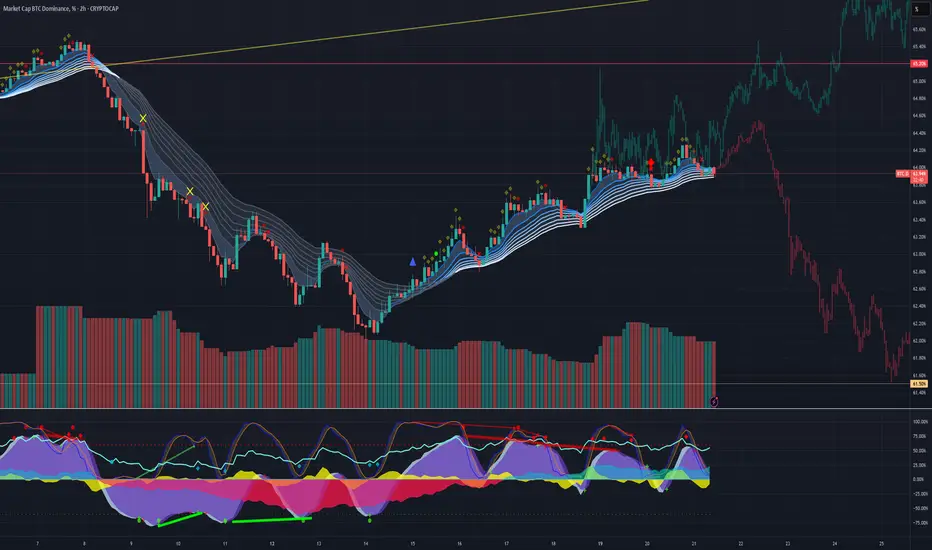
BTC fractals are.. hmm XDWOW! What a great recovery BTC has had over the past few weeks! We see something very interesting happening on BTC Dominance. 2 Fractals with similar momentum and price action have been spotted that match up with the current situation! What we see playing out are 2 VERY different scenarios! Keep your eyes on the 63.7% level and the 65.2% levels for more confidence in which short term direction it will go. #NFA #stayonyourTIPPYTOES
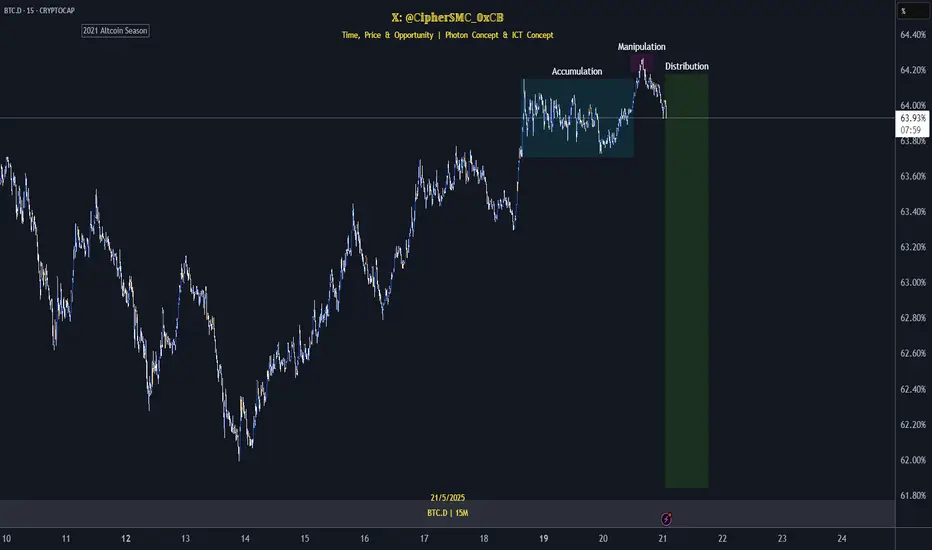
BTC.D PO3BTC.D Is Forming "The Power of 3"
This pattern could signal a shift, potentially paving the way for an altcoin rally once again.
BTC Dominance (BTC.D) looks overextended after a strong run-up.I'm anticipating a small pullback, which could open the door for altcoins to finally gain some momentum. The past few months have mostly favored BTC, but this could be a window where ALTs inject some life back into the market.
Areas I’m eyeing for bids:
Large caps: ETH, SOL, etc.
Mid to small caps: INJ and similar quality projects.
I don’t see meme coins as a solid play just yet — still too much risk without clear rotation.
Macro factors could trigger a BTC.D bounce later, will revisit.

BTC Dominance at Resistance After Structure Shift BTC dominance near its current resistance at 64.15% if breaks can move to next resistance at 65% or final resistance at 71% but at my point of view it's seems unlikely because at 1D time frame BTC dominance change it's character or structure shift and now testing it's Resistance which is also FVG there at 64.15% also we can see it's currently moving in between a channel if breaks which is likely to see it further down to it's next support. If breaks below 62% and BOS again in 1D time frame will give more confidence to confirm recently Market Structure Shift.

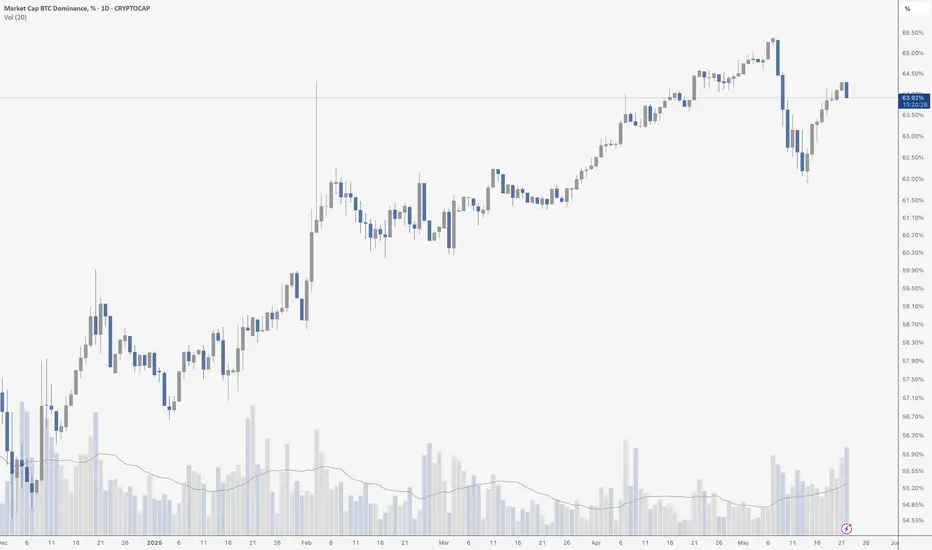
$BTC.D : Have we seen the top or a local top in the $BTC.D ? CRYPTOCAP:BTC has been a recent bull run and trying to reclaim the ATH of 107K USD. Currently firmly above 100K the Crypto currency looks very bullish in the near to medium term. But what we have seen is an the CRYPTOCAP:BTC.D chart is having an initial hiccup in this later part of the cycle. For the first time in the last few quarters there has been a back to back 2 weeks where CRYPTOCAP:BTC.D has 2 red candles. CRYPTOCAP:BTC.D reached it local peak of 65.3% which we have closely predicated in this blog space many weeks ago. We said the target for CRYPTOCAP:BTC.D for this cycle is 66%. We came close to 66% and since then we are seeing weakness in the CRYPTOCAP:BTC.D chart.
Now the question comes was that the top in CRYPTOCAP:BTC.D chart ? My take is that this is a local top. We might see some weakness in CRYPTOCAP:BTC.D in the upcoming weeks. Then we will again bounce back to break above the 66% decisively before this cycle comes to an end.
Verdict : CRYPTOCAP:BTC.D achieved a local top. Cycle top taget remains above 66%. Long term bullish on $BTCUSD.

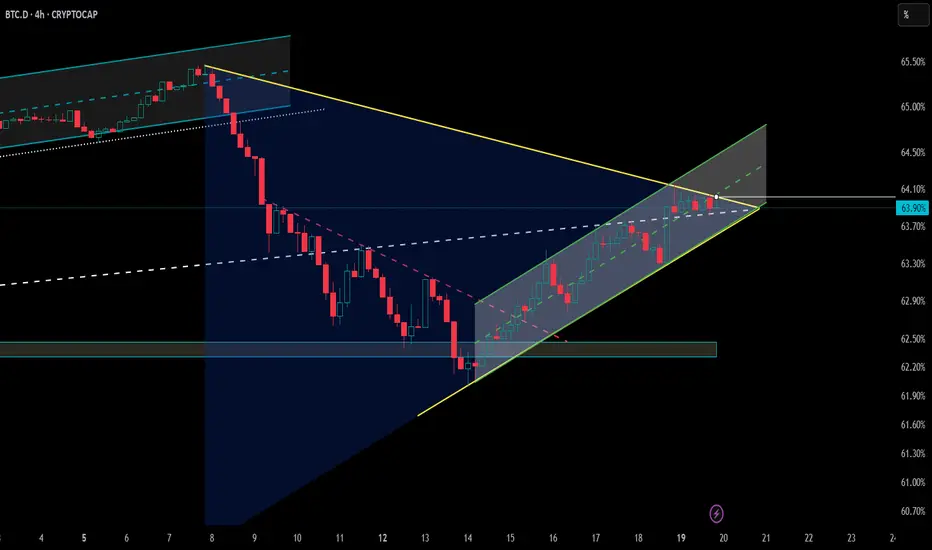
BTC Dominance Forms Symmetrical Triangle Inside Bullish Channel📊 CRYPTOCAP:BTC.D – Dominance Setup Unfolding
🔥 After breaking out cleanly, BTC Dominance is now consolidating within a symmetrical triangle on the 4H chart.
📈 The broader structure remains bullish, with price still respecting an ascending channel — showing strong positioning from BTC holders.
👀 This formation could lead to a decisive breakout. A move here may shift capital flows between BTC and altcoins — stay alert!
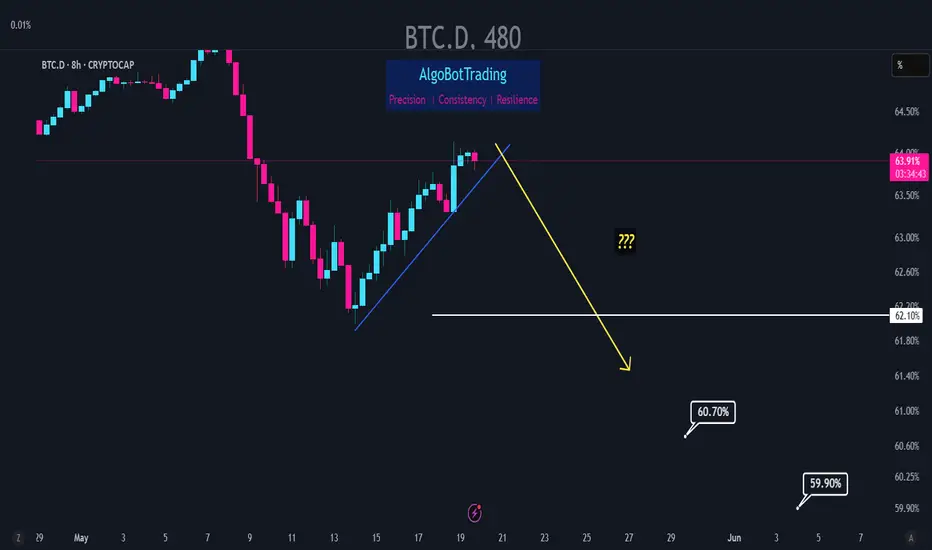
BTC.D quick update - May 19 2025he recent drop in BTC dominance accompanied by the drop in USDT.D resulted in stronger pumps in altcoins.
After a temporary upward correction, it looks BTC dominance is ready to continue the downward move. Crossing below the blue trendline can be a good trigger for the drop towards the 62.10%, 60.70% and 59.90% levels.
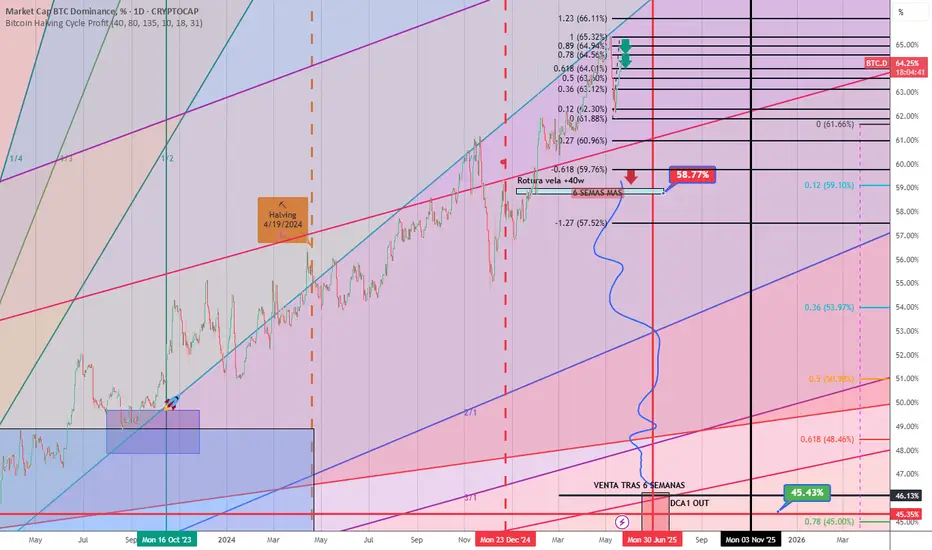
BTC Dominance 1 of 3 (bearish)BTC Dominance 1 of 3 (bearish)
1. Retraced to fib 0.618
2. Tested (and got rejected) SMA 200
3. Filled the FVG
4. Rejected at premium
5. Entered wave 3 (fib 1.618 target = 58.75%)
6. Fib trend zone 28 May
7. Fib time zone 28 May

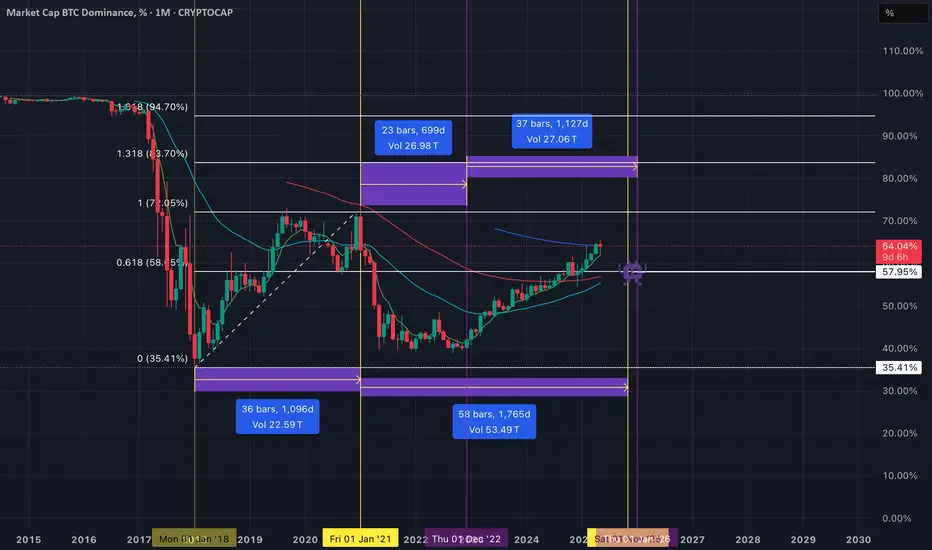
Bitcoin DominanceI ask you to tell me what the trend is. Is the number going up or down? There is a gap to 95% BTC.D. This is not debatable. It's a fact. We're about to get a "gap-close", where the ratio attempts to fill the gap. This is very normal, and expected when you properly learn technical analysis and theory. The theory of why the ratio might go for 95%, well before it happens. It's because there's a technical theory behind. You should be paying attention here.
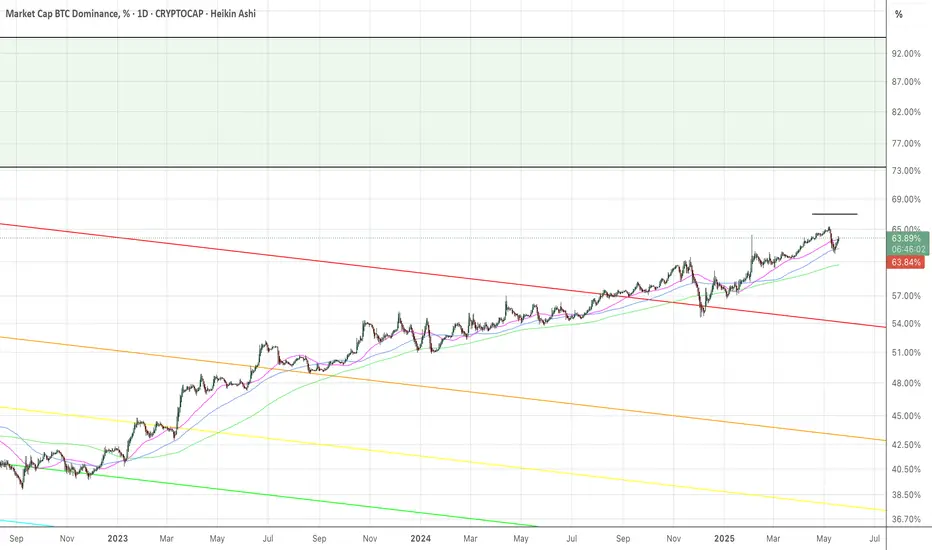
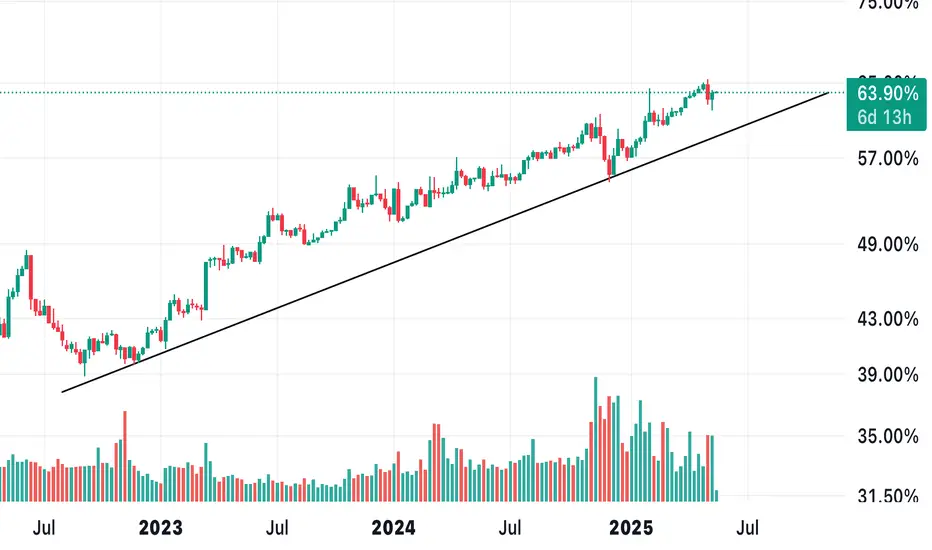
Ascending Channel Update The dominance has been trading writhing this ascending channel since May 2023 (for exactly 2 years) and it still hasn’t broken below this level sustainably. Yes, the dominance just got rejected at the top of the channel, but for alt season to begin, it must break below the ascending channel. The dominance might drop to the support level and bounce, if it bounces it means alts had a run but still not alt season. If dominance breaks below the support level of the channel and stays below the channel, then there’s hope for a sustained alt season and not just a tiny bull run.

No Sign of Weakness YetAs long as Dominance stays above this support level, there is no alt season. Do not be scammed by the scammers who pretend to be traders on trading view. The same scammers have been calling for alt season by misleading people through BTC.D charts. Yes, the D dropped by 5%, but it recovered very quickly and there will be non alt season unless the D breaks below the major support shown in the chart. Don’t let them mislead you. Weekly RSI is showing a divergence, which means there might be a reversal in the near future, but RSI alone is not reliable enough and so far despite the divergence on the RSI, the D keeps rising and the Alts keep bleeding.