Bitcoin Dominance Is Growing, But Don't Panic!Hello, Skyrexians!
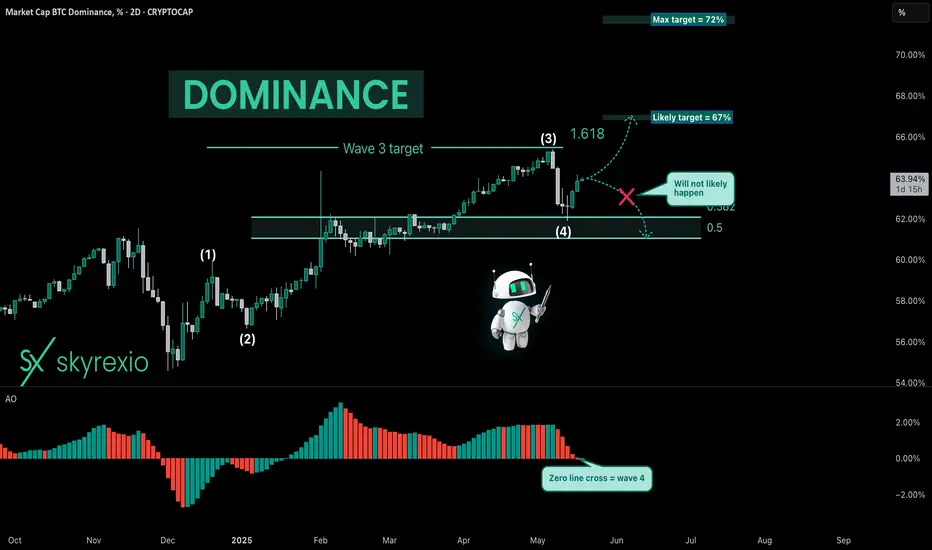
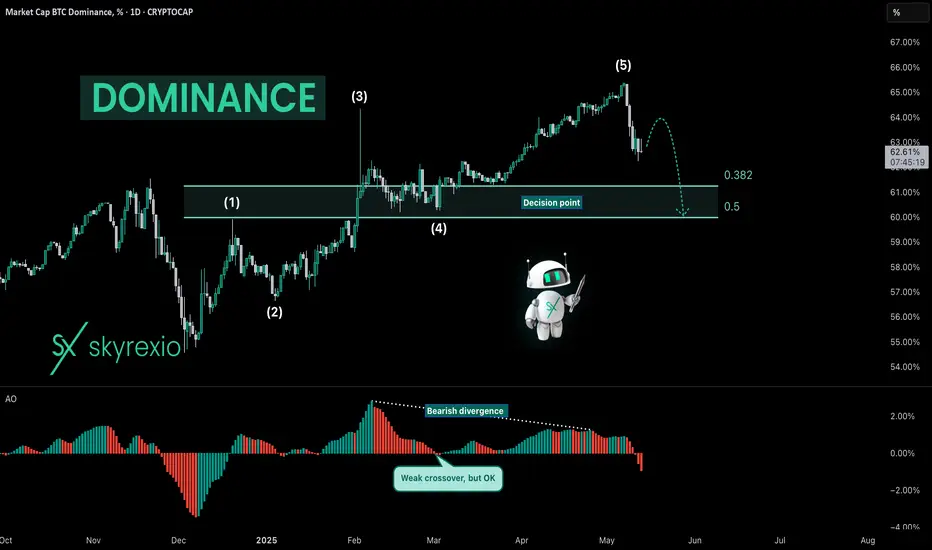
When I shared last update on CRYPTOCAP:BTC.D I mentioned that not sure that altseason has been started, now I decided to go back to my first scenario where dominance shall reach 67%.
You can tell me that wave 4 shall be ABC shaped and now we will see dump to 61%, but dominance usually has the very sharp corrections, moreover 0.38 Fibonacci has been reached and Awesome Oscillator crossed zero line on 2 days time frame. Wave 4 is likely to be finished. Now wave 5 is going to the most likely target at 67%. This pump will be fast, may be in 1-2 weeks. Also wanna tell about disaster max target at 72%. This target is very very unlikely because it will break all picture on 1 week time frame, but also let's just keep in mind. This analysis perfectly correlates with ATOM analysis, which is also actual for all altcoins.
Best regards,
Ivan Skyrexio
___________________________________________________________
Please, boost this article and subscribe our page if you like analysis!
BTC.D trade ideas
BTC DOMINANCE NEW UPDATE (1D)This analysis is an update of the analysis you see in the "Related publications" section
This upward move is in line with our previous plan and is meant to complete wave G.
Wave F didn’t touch the green zone exactly and reversed slightly higher due to market maker manipulations, which has made trading in these areas more difficult.
It is expected that from near the top, the price will drop to complete the larger wave F | which might come with a green and attractive market. Completing wave G, which we are currently in, will likely take several more days.
For risk management, please don't forget stop loss and capital management
Comment if you have any questions
Thank You
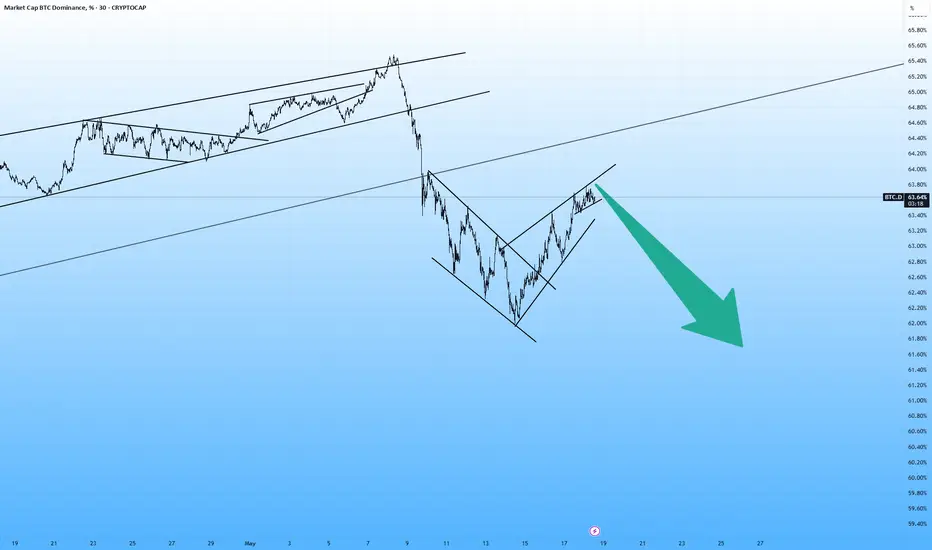
Dominance is currently engaged in a battle to move downward.Bitcoin dominance is currently in a strong downward battle, facing increasing pressure from altcoins which are gaining momentum. Despite some resistance trying to push dominance higher, the overall trend suggests a weakening grip of Bitcoin over the crypto market. This decline indicates growing investor interest in alternative cryptocurrencies, especially as sector-specific tokens and new projects start to outperform BTC. If this downward movement continues and breaks key support levels, we could see a more significant rotation into altcoins, fueling a broader rally across the market.
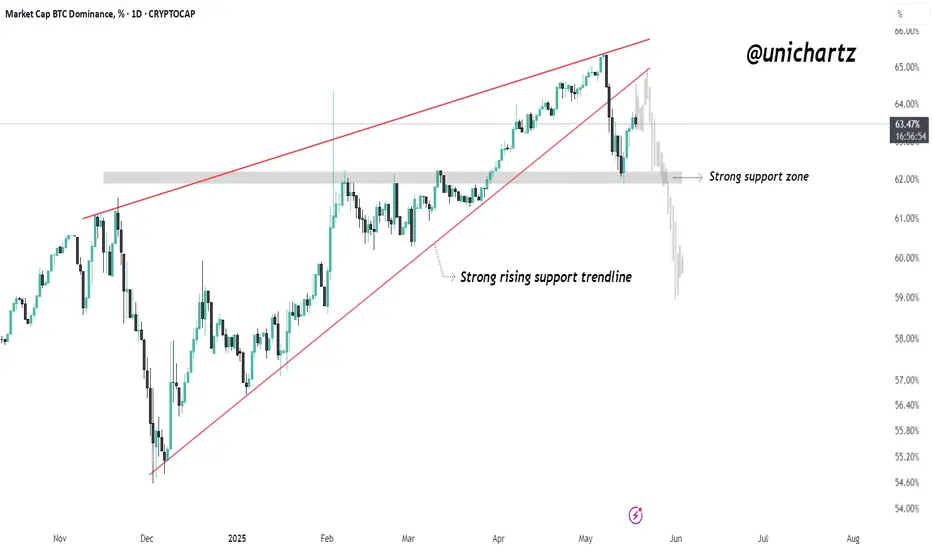
BTC Dominance – Critical Breakdown ConfirmedBitcoin Dominance has officially broken below the long-standing rising wedge structure, signaling a significant shift in market momentum. This pattern, which had held strong since December 2024, has now failed — and that’s a big deal.
After the breakdown, BTC.D temporarily bounced but was rejected on the retest of the wedge’s lower boundary, confirming the breakdown as valid. This retest-then-drop scenario is a textbook bearish continuation signal.
Not only did BTC.D lose the rising trendline, but it also failed to hold the horizontal support zone near 63%–62%, which acted as a key floor for months. Now, with price heading lower, Bitcoin's dominance is clearly weakening, and that’s bullish for altcoins.
What this means:
Bitcoin is losing control of market share.
Altcoins may start gaining serious traction, especially mid and low caps.
If BTC.D drops below 60%, we could see an acceleration of capital rotation into altcoins — a classic start to an altseason.
BTC.D SHORT IDEABTC dominance shows bearish pattern+small bearish pattern. I'm expecting alt season.
BTC.DBTC.D
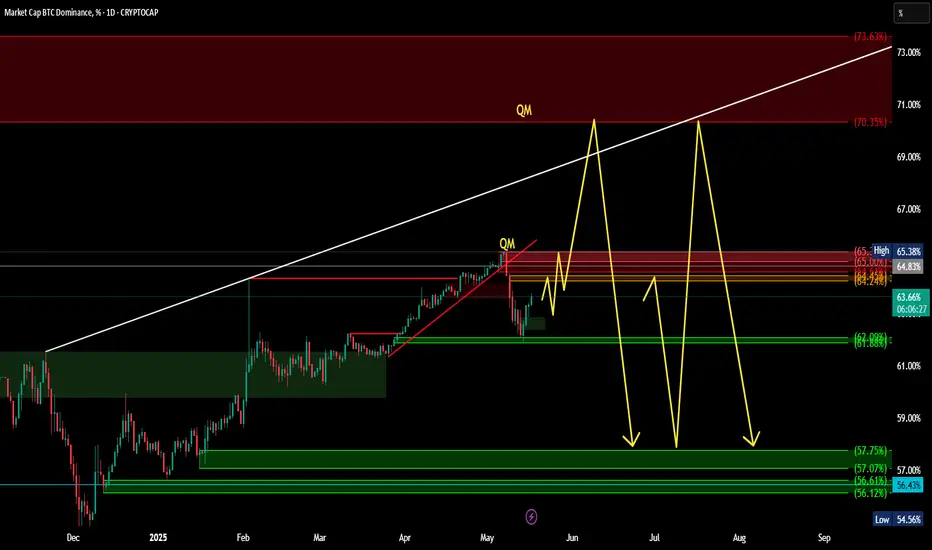
The chart is in an uptrend and had a correction.. ERC bearish candles which indicate a head and shoulders
Ahead targets 64.21 or 64.51 or 65
If the correction starts from this area it is a sign of alt season and can be up to the support area of 57.75
If it does not correct from this area it can be from the resistance area of head and shoulders 75.35 which is a sign of alt season and can be up to the support area of 57.75
So, where do we go from here?I assume the daily timeframe will determine the direction in which BTC.D is heading. Either we're making a lower high, which would suggest that BTC.D has reached its top, or we're making another higher low, which would suggest that BTC.D is heading higher again.
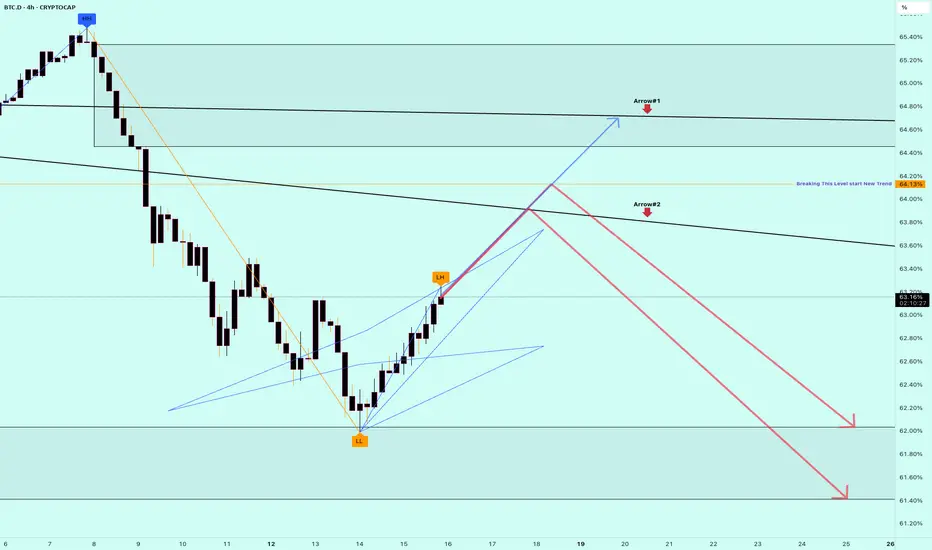
Bitcoin Dominance Pullback Explained,Beginner Friendly AnalysisLet’s talk about what’s happening with Bitcoin Dominance, or BTC.D — and what it could mean for altcoins right now.
So, Bitcoin Dominance recently made a strong move upward. That means Bitcoin gained more market control compared to other cryptocurrencies. But now, it’s starting to slow down a bit and retrace — which simply means it's pulling back after a strong move.
When this happens, many altcoin trades hit their targets — or what we call take-profit levels — and now, a lot of them are getting ready for new buy entries. This is an important phase, especially if you're someone who trades altcoins.
Right now, I see three possible scenarios for Bitcoin Dominance:
🔹 First Scenario: BTC Dominance pulls back just a little more, touches a key level — marked as Arrow #2 on the chart — and then bounces back up from there.
🔹 Second Scenario: The retracement goes a bit deeper, touching the lower level — Arrow #1 — before possibly reversing.
🔹 Third Scenario: BTC Dominance breaks below Arrow #1. That would mean the earlier breakdown was fake, and we might see a quick recovery upward.
Now, in my personal opinion, the first two scenarios are more likely. We may either see a bounce soon or a slightly deeper retracement before Bitcoin Dominance heads back up again.
✅ For altcoin traders, this is a great time to watch the market closely. Many altcoins are resetting and could give fresh buy opportunities soon. But don't rush in — wait for solid confirmation signals.
As a beginner, just remember:
Markets move in cycles. It’s not just about buying or selling quickly. It's about timing and understanding the bigger picture.
🧠 The best traders are not the fastest — they’re the most prepared.
📢 Quick disclaimer before we finish:
This is not financial advice. I’m sharing my personal thoughts for educational purposes only. Always do your own research before trading or investing. Crypto can be risky — so take your time, learn, and grow step by step.
Thanks so much for listening — and I’ll catch you in the next update!
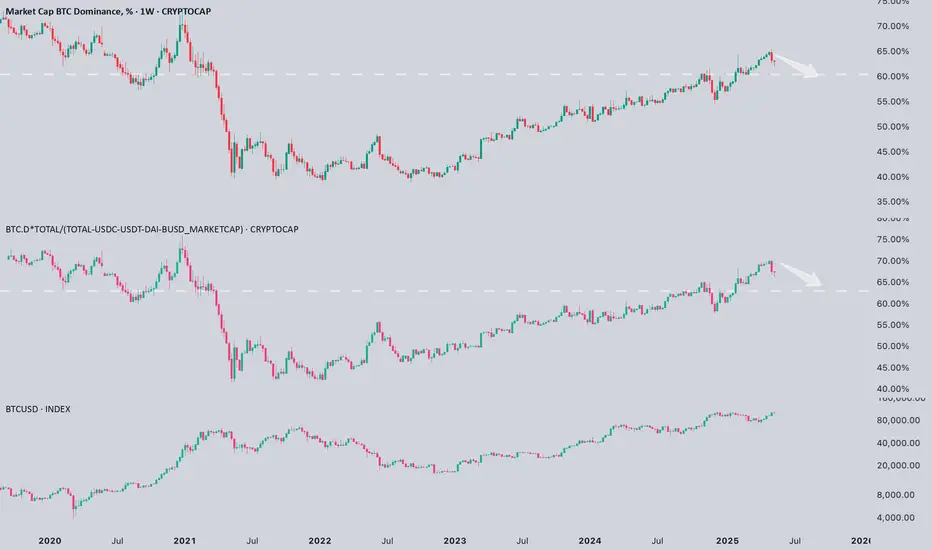
Is Bitcoin dominance finally starting to crack?Is #Bitcoin dominance finally starting to crack?
I think we’re getting the first real signal.
📉 After a strong run, BTC CRYPTOCAP:BTC dominance has rejected from major resistance and started to pull back. Even when adjusted for stablecoins, we’re seeing the same early signs of weakness.
📝 Historically, this kind of shift has been a precursor to capital rotation into altcoins. We might still be far from full-blown altcoin euphoria, but this could be the beginning of a transition from a BTC-led market to a broader risk-on phase, especially when the market starts pricing in a rate cut.
💡 Keep in mind: the biggest alt runs tend to come when BTC consolidates near highs while dominance fades. If this move confirms, it might be time to prepare.
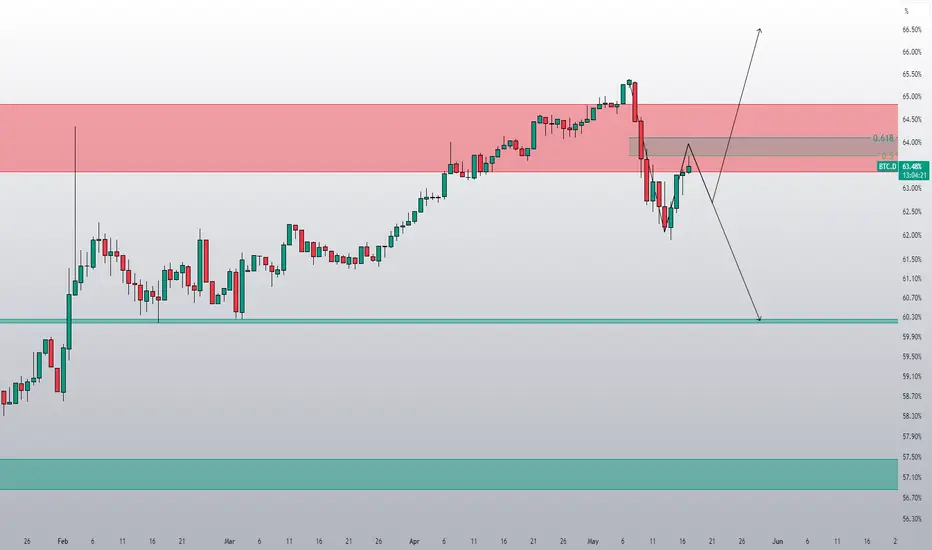
Bitcoin Dominance $BTC.D just bounced off the 62.0%Bitcoin Dominance just bounced off the 62.0% zone and held the 100 EMA.
Altcoins had a moment — but the tide may be turning.
📉 Pullback held above key demand (61.0%–61.5%)
📊 Now reclaiming 62.7% with EMAs curling up
💥 Break above 63.5% = renewed pressure on alts

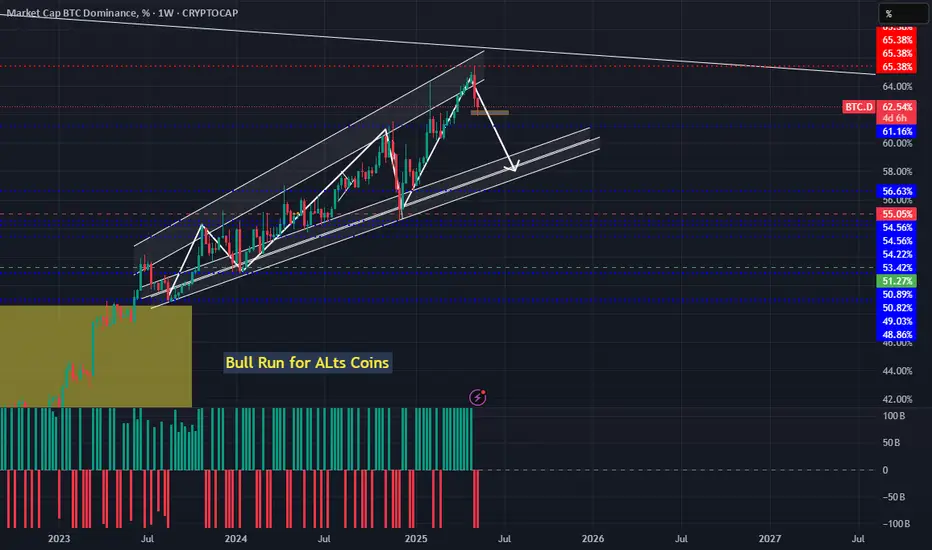
Bitcoin Dominance Double Resistance – Altcoin Breakout Ahead?Bitcoin Dominance Double Resistance – Altcoin Breakout Ahead?
Post with Emojis:
📊🚀 Bitcoin Dominance Double Resistance – Altcoin Breakout Ahead? 🌈📉
Hey Traders!
BTC Dominance just hit a critical confluence of resistance at the top of the ascending channel (62.82% to 63.53%) and is already showing early signs of rejection. History tells us this zone doesn’t hold for long—check the left side of the chart for past failures!
📚 What This Means:
If dominance rolls over here, expect altcoins to finally break free and start outperforming. 🌱
Watch for a key breakdown below 62.32% to officially kick off the next wave of altcoin dominance.
Targets for dominance on the downside: 59%, 56.9%, and possibly even 54% over the coming weeks.
📈 Probability Outlook:
✅ 70% chance BTC dominance gets rejected—altcoin rally ahead! 🚀
❌ 30% chance dominance breaks higher—remain cautious on alts.
This is the moment we’ve been waiting for. Altseason isn’t declared yet—but the gates might just be opening!
One Love,
The FXPROFESSOR 💙

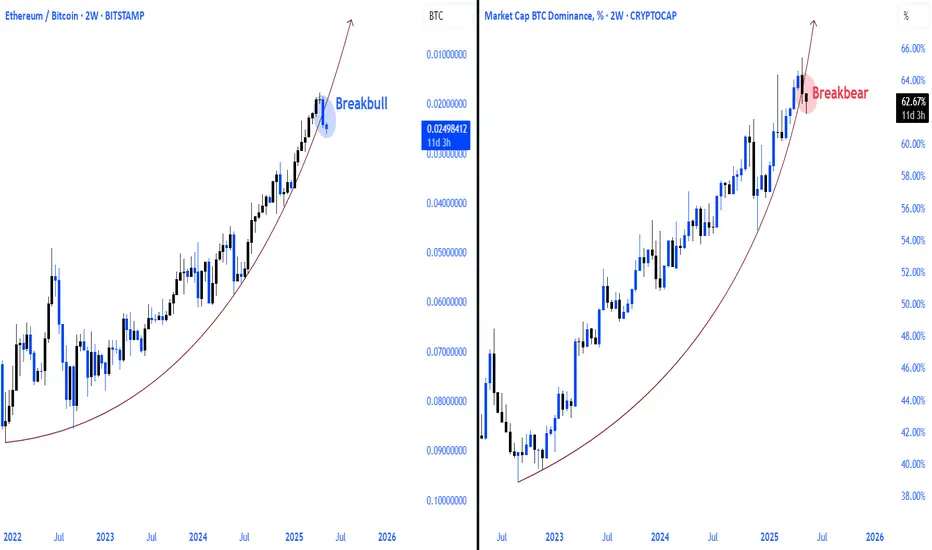
Eth/Btc vs Bitcoin Dominance Ethbtc parity and bitcoin dominance parabolic curve breakout occurred. bitcoin dominance down ethbtc will start the up process
Bull Run 2025 !! Btc.d droppingi am right and told u guys.Saw my last post, now wait for pivot exit. just before a rate cut.

Altseason Has Been Started (But I Am Not Sure...)Hello, Skyrexans!
Let's carefully make update on CRYPTOCAP:BTC.D because previous analysis where I bet for local top slightly above 65% is playing out even stronger than I supposed. Today I will show you why altseason could be already started, why I am not sure and where is the critical level.
Earlier I told that daily time frame does not suit for this Elliott waves cycle measurement, but we have 155 bars there, slightly above 140 bars, so we can count it as a valid. Moreover we can see zero line cross on Awesome Oscillator, but again only slightly. That's why I am not sure if uptrend on dominance is over or we shall wait for earlier predicted wave to 67%. But anyway I am sure that 60-61% will be reached before, so it was not a mistake to be in altcoins from 65.3%. When price will reach Fibonacci level we will see how it will approach it and make a decision about our altcoin's holdings.
Best regards,
Ivan Skyrexio
___________________________________________________________
Please, boost this article and subscribe our page if you like analysis!
BTC DOM TF H4BTC dominance is currently at support, will it retest the 63% area, the decrease in BTC dominance requires consolidation to continue the decline and this is a good sign for Alt Coin
Start of the Altcoin Rally - (not Altcoin Season)My analysis approach involves applying the Fibonacci function. I use the trend-based Fib extension to determine the target level, and the Fib retracement to determine the correction level. I also utilize the Elliott wave principle. Both produce the result shown. For clarity, I'm representing the A-C wave in turquoise, drawn from the (0) point to the (A) point to the (B) point to the (C) point. Beforehand, I drew the trend-based Fib from the (0) point to the (A) point to the (B) point, which then represents the area (target level) in green, yellow, and red. When the price reaches the target level (ZL), the Fib retracement is drawn from the (0) point to the (C) point, which then represents the potential correction level. The result shows that the price reached the 1.618 Fibonacci level (green line) at 65.30%, followed immediately by a countermovement to the south, which likely caused the altcoins to pump. However, I believe that the altcoin season only started when the (0) point was broken. Before that, I expect a reaction to the north when the (0) point is reached, eventually reaching the 0.783 Fibonacci level (purple line). After that, it's off to the south. I would describe the end of the altcoin season in a separate idea.

Bitcoin Dominance is testing the monthly 100 EMA — and stalling.Bitcoin Dominance is testing the monthly 100 EMA — and stalling.
Price action shows clear hesitation at a key macro level.
If this holds, alts could catch a bid for the first time in months.
Break it? Altcoins stay sidelined.
Critical moment for market rotation.
BTC.D is started to melting downThe MARKETSCOM:BITCOIN dominance bounced off a very critical level. It seems that the altseason is just started. The upcoming altseason will be face melting. Fill your bags with valuable alts ...
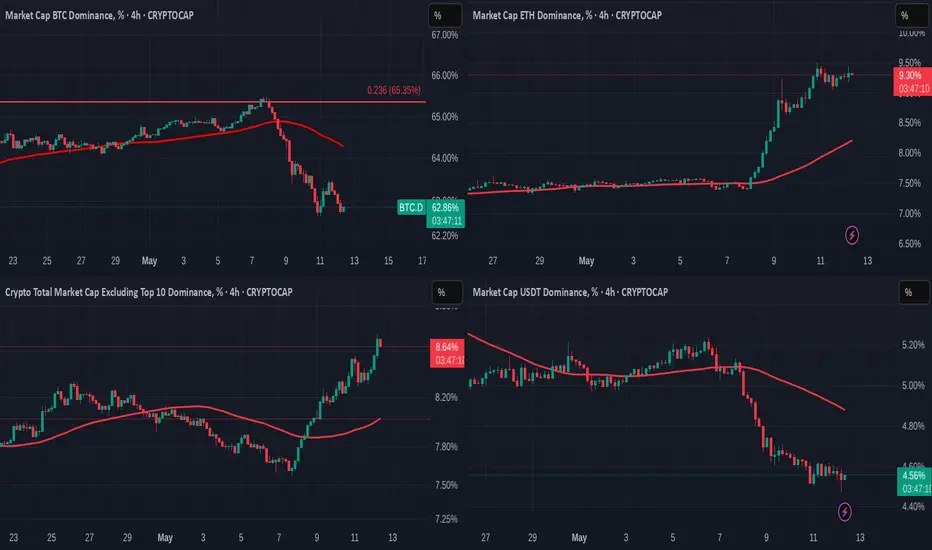
4 X Crypto Dominance charts showing Where the money goingCRYPTO MARKET DOMINANCE CHARTS
These are 4 hour charts, showing PA from Mid April to now.
BTC.D - ETH.D
OTHERS.D - USDT.D
RED line = 50 SMA
BTC.D - Dips, Showing money flow into other Assets. PA has fallen below the 50 SMA and yet the price has remained static above 100K. The fact that the Dominance chart is dropping is more a sign of the increase in Selling, Profit taking and the increase in Dominance of other Assets and the fact that the price is unchanged, slightly higher, also shows the demand for BTC remains strong.
ETH.D - Climb showing some ETH recovery though no where near the climb that Bitcoin has made. The ETH Dominace can also be reflecting the increased Dominance of ALTS on the ETH network. In the last 24 hours, The ETH dominance has Fallen slightly
OTHERS.D - Rapid climb - Top 125 coins minus the Top 10 ny market dominance.
MID to LOW Cap ALTS taking most of the Money. This will include all ALTS on any Vlockchain, including the TH network. Some Massive gains here signaling ALT Season though I am uncertain how long this will ast.
BE CAUTIOUS
USDT.D Drops showing money leaving Stable coins and moving to Assets. When stable coins get sold off, it is a sign of confidence in the market, Foe me, MOST of the money flowing into ALTS right now are coming from the Stable coin sell off
As I mentioned just now, I remain cautious about this right now,
Watch that BTC.D like a Hawk because THAT is the signal of change in this.
The Table below explains ( sorry for the formatting )
BTC.D- BTC - ALTS
increase- increase- Decrease
increase- Decrease- Decrease Rapid
increase- Stable- Stable
Decrease- Increase- Increase Rapid
Decrease -Decrease- Decrease / Stable
Decrease -Stable- Increase
BTC DOMINANCE We got the rejection Inside the channel, that is the good indication for alts It’s the beginning of all season you have to just accumulate the alts at that point

Welcome to ALT SEASON (Real) | BTC.D & ETH/BTCCRYPTOCAP:BTC.D is rejecting off 2021 POI and deviating this cycle's high having just closed the weekly under 64%. Coupled with CRYPTOCAP:ETH strength showing signs of a trend reversal after downtrending for 4-year against $BTC. Likely see CRYPTOCAP:ETH trade upwards of US$5000 this year as ETH outperforms BTC.
