BTC.D trade ideas

BTC.DThe way this chart has been I'm not even going to guess lol.
Great to finally see some down pressure, now the key here is to see some follow through.
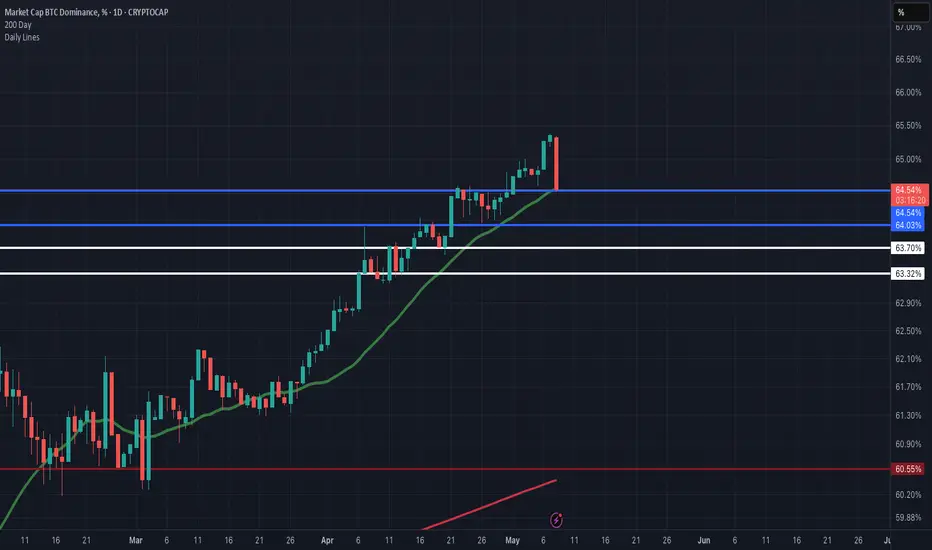
Bitcoin Dominance BTC.D analysisCurrently, the maximum of BTC.D was 65.38% and the absolute maximum is very close, and then the capital will start flowing into altcoins.
We will have to keep a close eye on where the capital will go: only to highly liquid altcoins, or to a certain industry, or to a narrative, as it was before: “defi”, “memecoin”, and so on...
Do you have any ideas where the capital can go? Write in the comments!
❗️ Also, it is worth noting that such a popular term as "alt-season" lasts less and less, and you have to wait longer and longer for it!
It seems that this time the "alt-season" has every chance to last until the end of 2025, and then... it will be seen. Perhaps the market will gain capital and new powerful players who will set a new vector and new rules by 2028....
But first... we have to live to see it!)
_____________________
Did you like our analysis? Leave a comment, like, and follow to get more

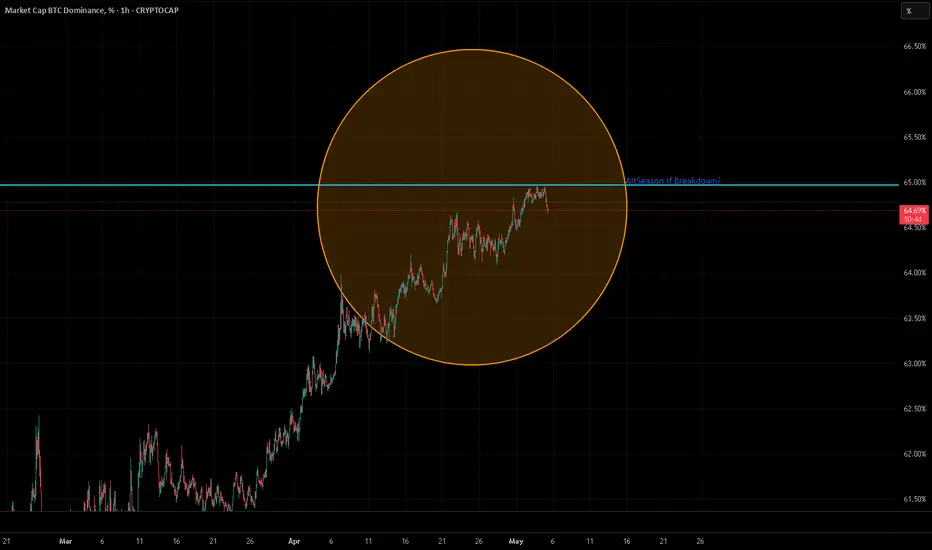
Bitcoin Dominance being rejected at major resistancePlan is simple. If the Bitcoin Dominance getting rejected it will draw down other altcoins as well. Probably leading to an altseason if ETH explodes.
A Table to show you Money Flow when BITCOIN DOMIANCE MOVES
A Simple Rule of Thumb can be followed when BITCOIN DOMINANCE moves up or down and it can save you a fortune if you use it properly.
BTC.D - BTC - ALTS
increase - increase - Decrease
increase - Decrease - Decrease Rapid
increase - Stable - Stable
Decrease - Increase - Increase Rapid
Decrease - Decrease - Decrease / Stable
Decrease - Stable - Increase
Currently we are seeing BTC.D Decreasing and yet the BITCOIN Price in Increasing and ALTS are INCREASING
Tjhis is Great BUT you need to watch BTC.D like a Hawk now because when that changes and begind to rise again, as it will do one day, maybe soon maybe in a month....then the likly hood of ALTS dropping Quickly is high
Bitcoin is now in heavy resistance and pushing through.
Pay attention to how long it can do that
The table above is your Saviour

BtcDominance will not BITCOIN Dominance will not hit 70%, idk why people keep saying this. Maybe 66% tops but as of now the falling wedge it ranges in the last two cycles do not play out with btcd hitting 70%.
We are on the cusp of alt season starting. However with crypto development since last cycle, this season is all about utility not memes. Xrp/ada/hbar/sol and any iso20022 compliant crypto will moon.
BTC Dominance Update… top could be formed. Too could be formed with btc dominance. We could be seeing the beginning of alt season start to unfold.
BTC.D done or not?I like to think that 65% may be the top for BTC.D, but it cannot be ignored that BTC.D has gone to around 72% in the last three cycles. Will it do the same this cycle?
The 4 Crypto Dominance charts and 4 x TOTAL charts -ALT ?
There are some charts we should always refer to in times where we feel change may be upon us.
The chart above are
Bitcoin Dominance ( BTC.D ) - Ethereum Dominance ( ETH.D )
Others Dominace ( OTHERS.D) and USDT Dominance ( USDT.D) ( I use USDT as it remains the largest Stablecoin by market cap)
The RED line in these Daily charts is the 50 day SMA
In most of my posts recently, I have been mentioning how Strong BITCOIN is remaining while under a Lot of resistance.
But we really should not forget the rest of the market. THE ALTS
The Fabled ALT Season has been running away from us, making many wonder just what is happening.
To explain, while BTC.D remains high, it shows us that the Money remain invested in Bitcoin.
When this Dominance Drops, in the past, it has signalled the rise of investment into ALTS.
Called ROTATION, the money rotates from one asset to another.
Due to the corporate investment in Bitcoin, this rotation has not happened.
BUT IS IT ABOUT TO ?
Let look at a few things
BTC.D has been rising continuously for Months now, It is way above that 50 day SMA. PA could fall a Long way before the support of that 50 SMA is required and I notice as I type, that is is beginning to drop. It's local support may help
ETH.D has begun to Rise but we need to pay attention to this as it could get rejected once again by the 50 SMA. Ethereum has had a very hard time this cycle and has yet to show any sustained recovery
OTHERS.D - Now OTHERS is the one I watch most. Others is the Top 125 Coins MINUS the Top 10 by market cap. This shows us the Mid to Low cap Alts coins.
This is also rising right now but once again, we need to wait and see if it breaks through the 50 SMA that has rejected it many times.
The USDT.D has been dropping. This shows that USDT has been rotated into other assets. Bullish but I have to say, that as I write this, I have just noticed that this has begun to rise also though only on a 1 hour chart so maybe just Noise but it is worth watching.
So, on these dominance charts, we see a potential start to a rotation but with the likely hood of rejection of the 50 SMA, It could be the First step of a bigger move.....But with potholes in front.
The Next Logical thing to do is to look at the TOTAL market Cap charts, to compare this dominance.
This chart shows us the Daily charts for
TOTAL Crypto market Cap - TOTAL2 ( minus BTC )
TOTAL3 ( Minus BTC & ETH ) - OTHERS ( Top 125 coins Minus top 10 by Dominace )
SMA;s in chart are RED= 50, BLUE = 100, GREEN = 128, YELLOW = 200
The TOTAL is the ONLY one that has PA above all the SMA's, potentially offering Support on many fronts. It has also had the most sustained Rise. Hence the high level of Dominance in the Market.
TOTAL2 is above the 50 SMA that has rejected it previously and is about to hit into the 100. We need to see if this will be rejected or not.
Remember how the ETH.D is also facing rejection off the 50SMA - ETH is under pressure
TOTAL3 is above the 50 and appears to have broken through the 100. This is VERY Bullish for the ALT coins and could show us some potential for a continued rise as sentiment continues to turn positive. But we should watch that 200 as a potential problem
OTHERS has the largest and strongest rise and again, is above the 50 and appears to have broken through the 100. This chart has the largest gap between current PA level and the next SMA that may reject it. This is the same on the Others.D chart
SO, in conclusion, The potential for a Rotation does exist but it is going to be hard fought. There is the possibility of a HIGH volitle state for the next few days, possibly Weeks.
If you are going to rotate out of Bitcoin, Be VERY CAUTIOUS until at least the next SMA have been claimed on both sets of charts.
The nest bets are on the Mid to lower Cap ALT coins.
BUT I will say this. I cannot See BITCOIN Selling off to invest in ALTS. I also see Bitcoin continuing higher against the USD.
IF we get an ALT season now, It will be Quick, Volatile and possibly with Quick Pump and Dumps on most ALTS.
The larger ALTS will survive this better than the Meme, small caps in my opinion
For me, the ROTATION that creates an ALT Season will occur with the rotation of money from ALT to ALT and NOT BTC to ALT
What ever you do, Remain in Peace and Safety

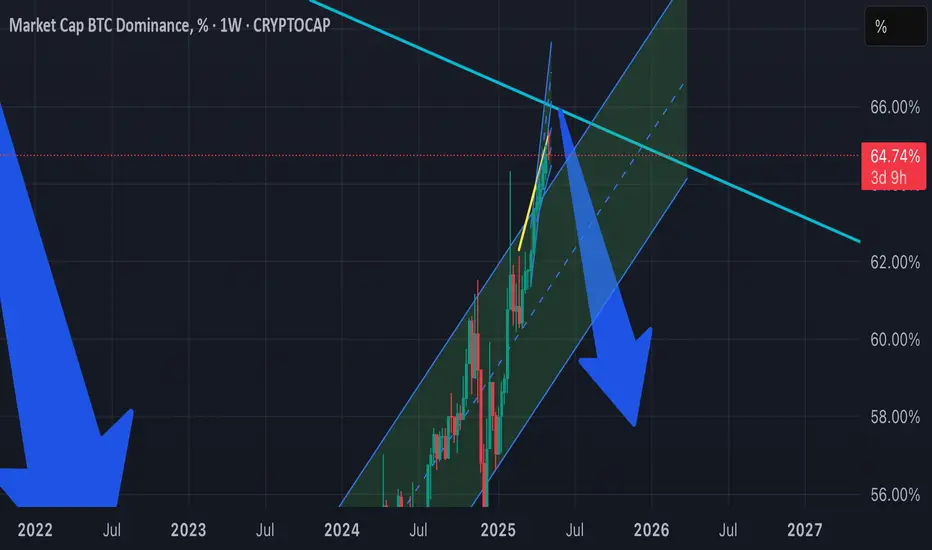
BTC Dominance: Approaching Major Resistance!!BTC.D is nearing a major 66%-68% resistance zone within a long-term ascending channel (since 2018). Historically, this area has triggered BTC.D pullbacks, often leading to altcoin rallies. The chart itself anticipates a rejection from this level.
If BTC.D rejects, a move towards the 53-54% lower channel support is likely, potentially bullish for alts. Watch for bearish weekly candle closes and increased selling volume as confirmation. Altcoin price action should also be monitored for signs of strength. This key resistance zone presents a significant point for the broader crypto market. Exercise caution and await.
If you find this analysis helpful, please hit the like button to support my content! Share your thoughts in the comments, and feel free to request any specific chart analysis you’d like to see.
Happy Trading!!

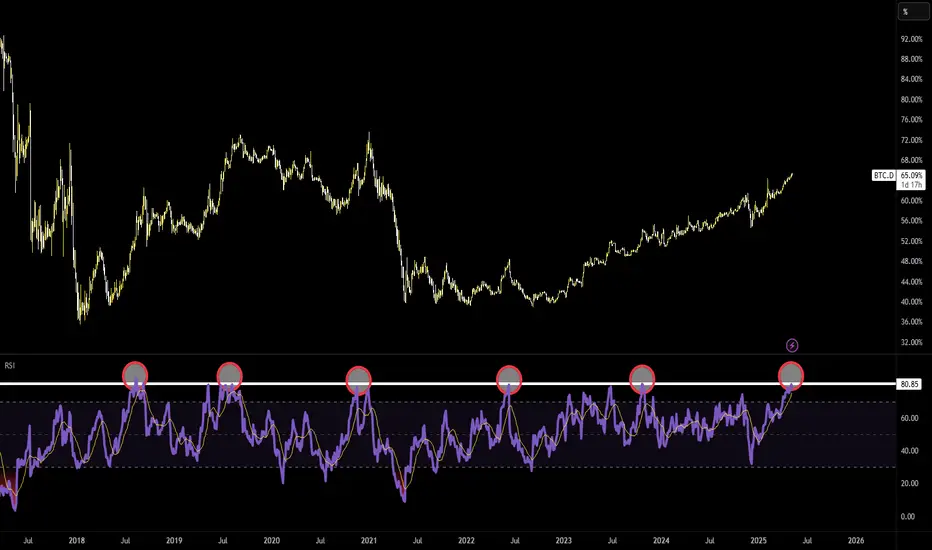
Is dominance finally due for a pullback?- Bitcoin dominance has been in a relentless uptrend
- 3D RSI now hitting levels that historically have resulted in at least temporary pauses/pullbacks in trend
- should this materialize I expect alts like ETH, Maker, EOS and SUI to do very well
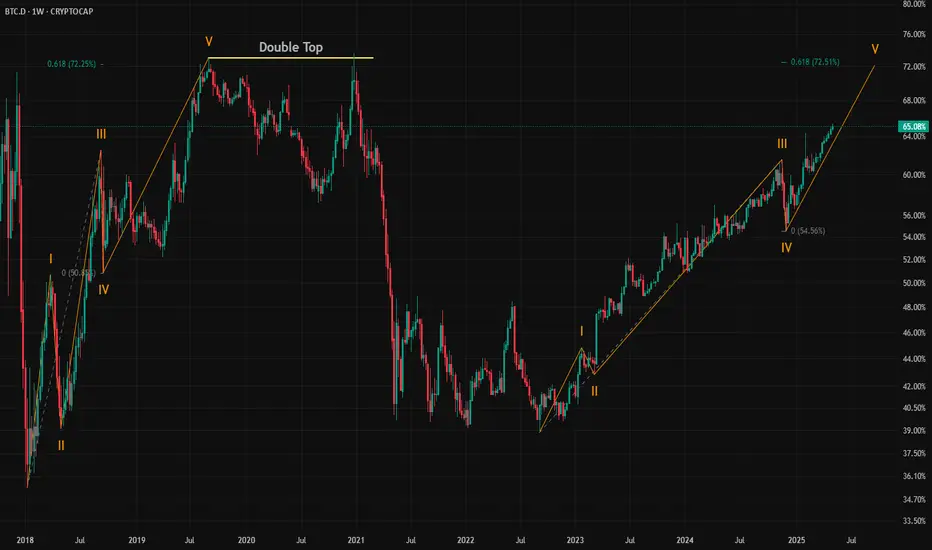
My thoughts on Bitcoin DominanceBitcoin Dominance is going to hit 0.618% of Fibo which is 72.5% of dominance before we see an altseason. This would be the completion of the 5 impulse waves. Also keep in mind the double top formation which might happen later. Happy trading!
NFA. DYOR.
#BTC Dominance Update – Key Levels in Play!🚀 Hey Traders! 👋
If you’re finding value in this analysis, smash that 👍 and hit Follow for high-accuracy trade setups that actually deliver! 💹🔥
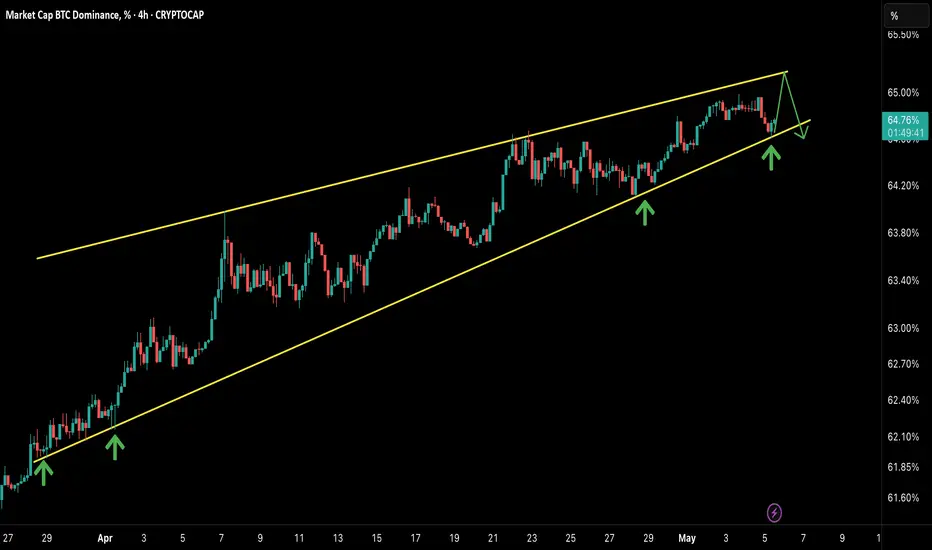
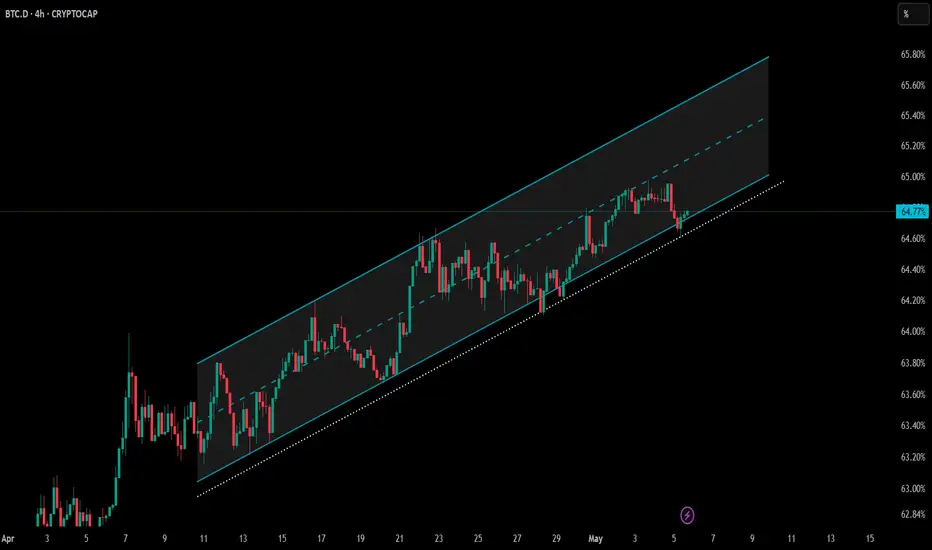
Bitcoin dominance ( CRYPTOCAP:BTC.D ) is trading inside a beautifully defined rising channel on the 4H chart.
📈 What’s unfolding?
✔ Strong support holds at the lower channel line (marked by green arrows)
✔ Bounce potential toward the upper channel resistance (~65%)
✔ Expect possible rejection there, followed by another retest of support
💥 Why this matters:
✅ BTC dominance drives altcoin sentiment
✅ Rising dominance → pressure on altcoins
✅ Watch for a breakdown below support → potential altcoin relief rally
⚙ Key Takeaway:
Monitor this channel carefully. If dominance breaks below support, alts could gain momentum. If it bounces, BTC will continue to lead.
💬 Drop your thoughts in the comments — are you betting on BTC or alts next? 🚀👇
BTC Dominance Reversal ZoneHello everyone, I've identified a possible reversal zone for BTC Dominance, there is a confluence of technical levels; Fibonacci retracement, extension and projection, along with a parallel channel, trendline and RSI bearish divergence. This looks like a solid level for BTC Dominance to top out.
Let me know what you think, this could be the start of the Alt Season that we have all been waiting for.
Bitcoin Dominance - the two scenarios!Bitcoin dominance continues to rise after breaking out of a rising wedge pattern on the weekly chart. It has now also broken through the 0.786 Fibonacci level.
Next stop is Rectangle 1, where Bitcoin dominance is expected to reach 68% — and most likely, this will mark the top of dominance before it starts to drop, triggering a historic altcoin season.
Scenario 2:
Dominance keeps pushing higher toward Rectangle 2, potentially surpassing 70%. At that point, many altcoins may form new lows, and weak projects could get wiped out.
Fear in the market will hit extreme levels —
but that could signal the beginning of an altseason and the collapse of BTC dominance.
Best regards Ceciliones 🎯

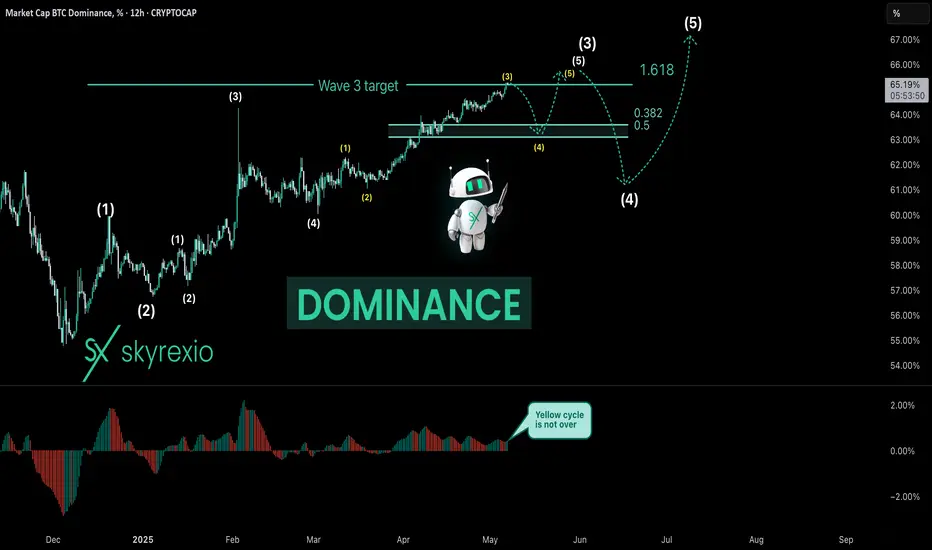
The Most Important Bitcoin Dominance Analysis!Hello, Skyrexians!
This CRYPTOCAP:BTC.D analysis can be a little bit complicated, but this is very important update on our previous analysis. Dominance is next to the top, but now the period of unexpected moves has been started.
Today we have 12h time frame to look at the internal wave structure. Tonight dominance hit the higher degree wave 3 target at 65.3% like I told you in previous article, but the subwave inside the wave 5 inside wave 3 is not finished. Let's count the waves for yellow cycle and we can see that there were no the wave 4 because Awesome Oscillator is still above zero. When it will cross it the yellow waves 5 will finish wave 5 inside wave 3. Now I expect the move to 63-63.5% then retest of recent high again then more significant correction and then another one wave to the upside - final big shakeout.
Best regards,
Ivan Skyrexio
___________________________________________________________
Please, boost this article and subscribe our page if you like analysis!
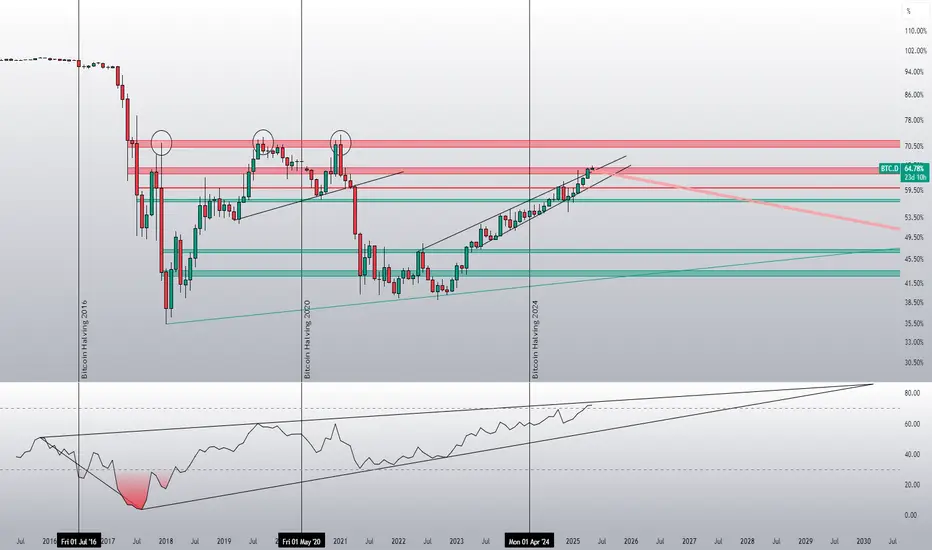
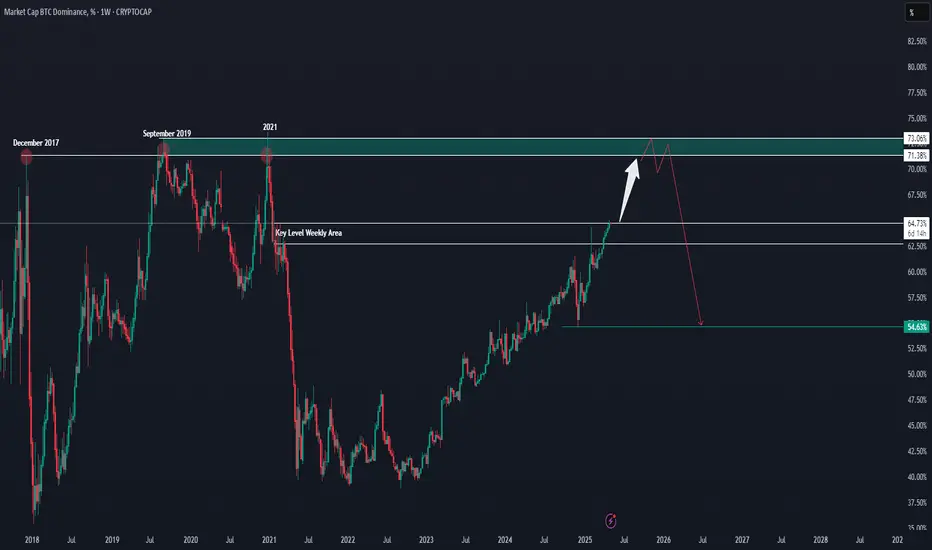
No Altseason Until BTC.D Hits 70%?Bitcoin Dominance (BTC.D) is currently climbing and approaching a major resistance zone between 71.38% and 73.06%. This area has proven to be a strong turning point in the past, acting as a top back in December 2017, September 2019, and again in 2021. These repeated rejections suggest that this zone is likely to remain a key resistance.
Right now, BTC.D is sitting around 64.66% and still has room to push higher. However, if it enters the resistance zone again, there’s a strong chance it may face selling pressure and start reversing. The white arrow on the chart shows the possible move into resistance, while the red projection outlines the expected rejection and potential decline back toward the 54.63% level—another important support zone from the past.
In simple terms, BTC dominance might be nearing its peak, and once it reaches the upper zone, we could start seeing altcoins gain more strength as dominance falls. This chart helps anticipate when the market might shift from BTC-led rallies to altcoin outperformance.
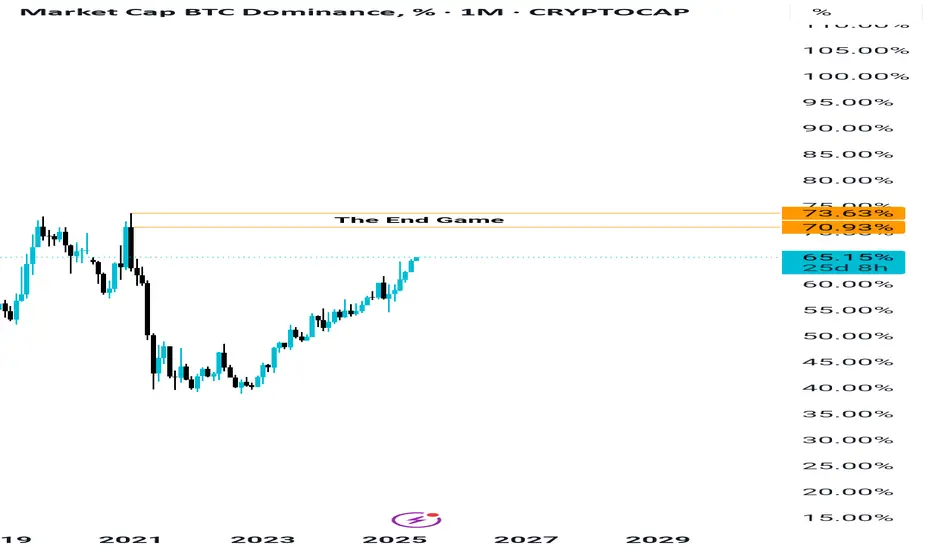
End of Ifs and Buts, The End game for BTC dominance The Final Level of Bitcoin Dominance: Where the Altcoin Season Begins
Bitcoin Dominance (BTC.D) has long been a critical indicator in the crypto market — a gauge of how capital is distributed between Bitcoin and the rest of the altcoin market. Over the past months and years, we’ve watched Bitcoin's dominance fluctuate, often controlling the direction and momentum of the entire crypto ecosystem. Now, we are approaching a crucial zone — the final frontier for Bitcoin Dominance, ranging between 70% to 73%.
This 70%-73% range is considered the maximum potential level Bitcoin Dominance can realistically reach in the current macro and market structure. Historically, whenever BTC.D has approached this threshold, it has struggled to maintain upward momentum, signaling the exhaustion of Bitcoin’s solo rally. Once this resistance zone is tapped or slightly pierced, we anticipate a strong and swift reversal.
Why is this level so important?
Because it's not just resistance — it's the trigger zone. As Bitcoin Dominance begins to fall from this region, capital starts rotating aggressively into altcoins. The drop is not gradual — it’s often sharp and aggressive, as confidence and attention shift rapidly from Bitcoin to the broader altcoin market. What follows is nothing short of explosive: altcoins across the board start rallying — some gradually, others in parabolic moves.
This is the moment the crypto community has been waiting for:
The beginning of the true altseason.
A period where projects that have been undervalued for months — or even years — suddenly come alive. Gains that take months in traditional markets can happen in days. The charts begin to light up green, portfolios expand, and traders realize that the wait was worth it.
In conclusion, 71% to 73% BTC Dominance is the final boss — the last gatekeeper before the altcoin revolution takes center stage. Once this level gets rejected and the downward trend starts, the market will shift dramatically. Be ready, stay sharp, and prepare your altcoin strategies — because the altseason we’ve all been waiting for is just around the corner.
Bitcoin Dominance Update (4H)It appears that Bitcoin Dominance is preparing for one final upward move.
I believe this could be the last dominance rally before a major bullish breakout across the broader market.
For a more detailed perspective, please refer to my previous analyses on Bitcoin Dominance and the "Others" market cap.
— Thanks for reading.

Btc Dominance unstoppable? But wait-
BTC Dominance Nearing 0.786 Fibonacci Level – Altseason on the Horizon?
Bitcoin dominance, which measures BTC’s market cap relative to the total cryptocurrency market, is currently approaching a critical technical level — the 0.786 Fibonacci retracement, precisely around 66.20%. Historically, this level has acted as a strong resistance zone, often signaling a potential reversal in BTC dominance.
If BTC dominance starts to reverse from this level, it could mark the end of Bitcoin’s solo run and the beginning of an Altseason — a period where altcoins significantly outperform Bitcoin in terms of percentage gains.
Why does this matter?
As BTC dominance reverses, capital tends to flow from Bitcoin into altcoins, especially mid-cap and low-cap gems. This redistribution often leads to explosive moves in altcoins — with historical data showing potential 30x to even 50x returns in select projects during strong Altseasons.
This scenario aligns well with Fibonacci-based market psychology, where the 0.786 level is seen as a last point of resistance before a trend shifts. In this case, a rejection at 66.20% could be the technical confirmation that the broader market is ready to rotate out of Bitcoin and into altcoins.
Key Takeaways:
BTC dominance is nearing the 0.786 Fib level at 66.20%.
A rejection here could trigger a sharp dominance reversal.
Capital rotation may favor altcoins, setting the stage for massive gains.
Prepare for potential 30x–50x opportunities during the upcoming Altseason.
If you’re into trading or investing in the altcoin market, this could be a critical time to start researching and building positions before the breakout momentum begins.
Follow me for more premium updates.
🚀 💎 🚀

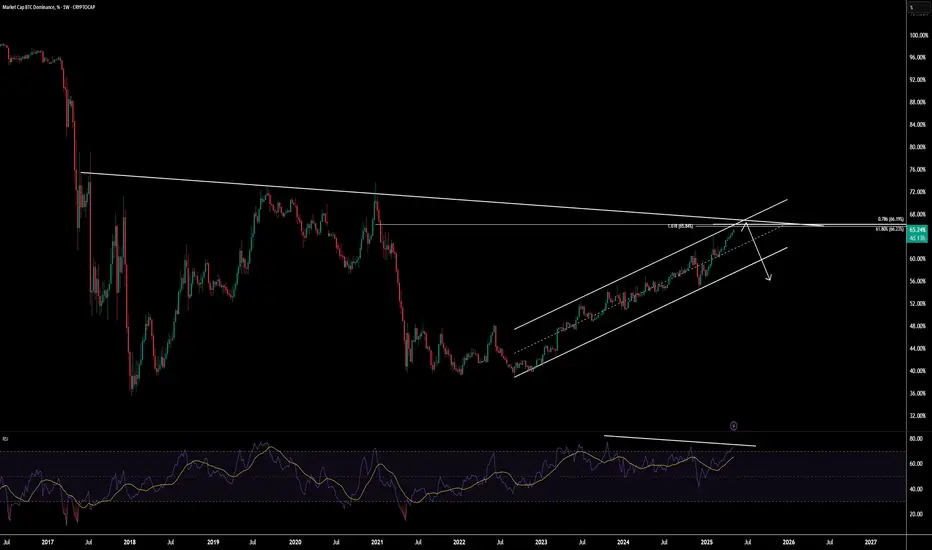
ALT COIN SEASON IS JUST WEEKS AWAY, HOPE YOU HAVE YOUR BAGS FULLHey Traders,
We’ve been watching this Bitcoin Dominance (BTC.D) chart closely — and it’s heating up again!
For those unfamiliar, BTC Dominance tracks the percentage of total crypto market cap that belongs to Bitcoin. When BTC.D rises, it typically means altcoins are underperforming compared to BTC — either due to their market caps falling, or BTC’s increasing. When it drops, altcoins are gaining ground.
While this chart won’t tell you whether markets go up or down, it’s critical for spotting where to diversify and when. It’s a must-have tool in your crypto trading utility belt.
⸻
Why This Chart Matters Now:
We’re nearing the top resistance trendline of a long-term triangle formation that dates all the way back to 2017. This line has rejected BTC.D multiple times in the past — and we’re back to test it again, hovering between 63% and 66% dominance.
Each of these rejections previously led to a drop in BTC Dominance — which triggered powerful altcoin seasons.
⸻
Key Bearish Signals:
• Bearish Divergence on the MACD
• MAJOR Bearish Divergence on the RSI
(Just like before previous alt seasons!)
• TOTAL2 (the white line representing all altcoins) looks poised to spike if history repeats.
Altseason Clue: When BTC.D forms bearish divergences on these indicators, it’s often followed by a surge in altcoin market cap — a key early signal we may be close to another one.
⸻
BUT… This Isn’t 2021 Anymore:
Let’s be real — the market has changed. Solana-based launchpads like Pump.fun and Jupiter DEX have revolutionized how easily tokens are created and traded. That’s new capital flow and speculative behavior we didn’t see last cycle.
Plus, the geopolitical landscape is shifting fast. With President Donald J. Trump calling for crypto regulation frameworks within 180 days, we may soon see an influx of institutional money — but it could come with strings attached.
⸻
Final Thoughts:
A breakdown in BTC.D could mean a major rotation into alts — but don’t bet the farm.
Markets could still dump. We may even skip altseason altogether this cycle.
However, this chart gives you a crucial edge — so use it wisely. Know your tools. Zoom out. Plan ahead.
As always — stay sharp, stay safe, and stay profitable out there.
— Savvy

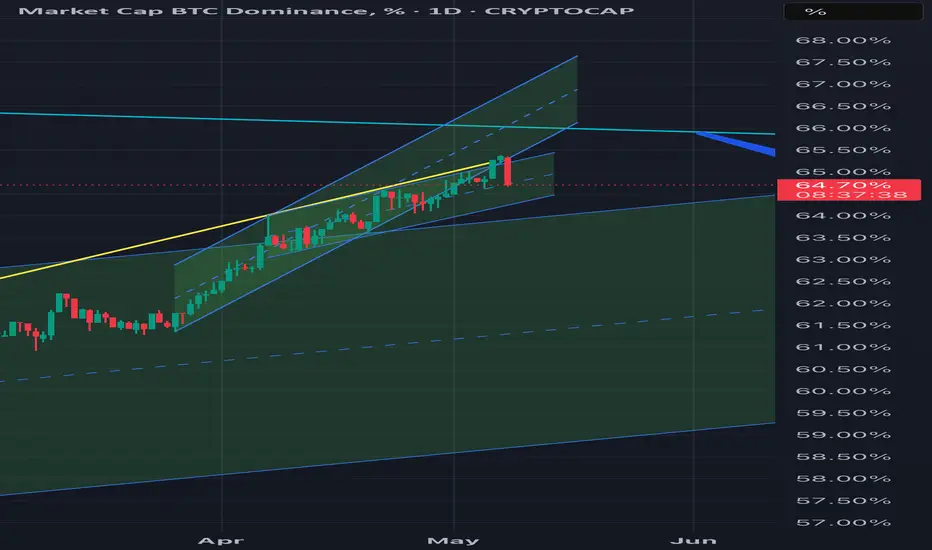
BTC Dominance at a Decision Zone – Altcoin Outlook Hinges on Thi 🔍 BTC Dominance – 4H Chart Update
BTC.D is still respecting the ascending channel despite a brief dip below support—it quickly recovered, showing strong resilience and is now hovering near 64.76%.
📊 Scenarios Ahead:
🚀 Bullish Case: A bounce here could send dominance toward the top of the channel near 65.5%, signaling capital rotation into BTC. This may pressure ETH/BTC pairs and small caps.
📉 Bearish Case: A breakdown below the channel and key trendline would shift momentum—fueling a move into altcoins.
⚡ BTC.D holding = altcoin bleed
🌱 BTC.D breakdown = altseason potential
🔎 Next 1–2 candles are key—watch for rejection near mid-channel or a decisive support break! 👀
Alts: Dead or Ready to Explode ?!Hello Traders 🐺
Still doubting the possibility of an Altcoin Season?
Probably yes — and that’s fair. We’ve been through a major correction over the past 4 years, especially in the altcoin sector. But the big question is:
Are alts dead... or is this just the calm before the actual storm? 🤔
As you may already know, market movements depend on a mix of factors — and altcoins, in particular, need real FOMO in the market to shine, whether that’s to the upside or downside.
Let’s break it down based on the crypto bull cycle, because understanding this cycle helps you track smart money and ride along with it.
🚨 Here’s what typically happens:
Before any real BTC season, we get the halving event (every 4 years).
Right after that, whales and big players begin accumulating BTC quietly.
They maintain pressure on the market to load up at cheap prices 😁🤯
But of course, they can't keep this up forever...
As time passes, others start to catch on. On-chain data becomes more visible, and retail traders begin spotting these moves — which is key, because you can track the whales and use that data to make smarter decisions.
This BTC season usually lasts 1–2 years, during which:
BTC.D (Bitcoin Dominance) climbs steadily 📈
Money flows out of alts, and many ALTS/BTC charts crash
Some altcoins hit new all-time lows vs BTC 😒🤦♂️
But here’s the plot twist...
Nothing goes up forever — and BTC Dominance is no exception.
Right now, it’s sitting at a monthly resistance level, and we’re starting to see bearish signs building up:
Bearish divergence on the daily RSI
A clear rising wedge on the daily chart
RSI shows weakness, even while price continues climbing
This setup looks very similar to what we usually see in a distribution phase 👀
And you already know what tends to come next... 🔥🐺
Hope you found this idea helpful.
If you have any questions or thoughts, feel free to drop them in the comments below — I’m always around.
And as always, remember:
🐺 Discipline is rarely enjoyable, but almost always profitable. 🐺
🐺 KIU_COIN 🐺
