Bitcoin Dominance - BTC.D - AltcoinsYears of struggle to be inside for a subseason that lasts a few weeks.
For some it's financial freedom, for others it's the cornerstone of a reset story.
We're talking about Bitcoin Dominance.
Few know just how powerful it has become.
The only thing that is real is bitcoin. By the time everyone realizes this, 99.99% of investors will have lost all their assets.
And we will all regret buying altcoins instead of bitcoin at the end of the day.
I think the most extreme peak for bitcoin dominance in the short term is 73%.
Dominance is going to have a rough ride before it crosses this target.
We will see an altcoin season that will give small investors a breather.
Then we'll break 73% with a disruptive bitcoin dominance.
Bitcoin will show everyone again who is the real boss.
BTC.D trade ideas

Update BTC.DFrom the data shown on the drawing, we find that a Diagonal Leading pattern has been formed and is then considered a wave A, then a correction is made in wave B, which is the bottom of the Leading pattern, from which altcoins and Ethereum breathe, and when it reaches the bottom, then a final wave C begins, rising strongly in the same direction upward. Let us follow
Note: The model fails if it closes above an area 55.26%

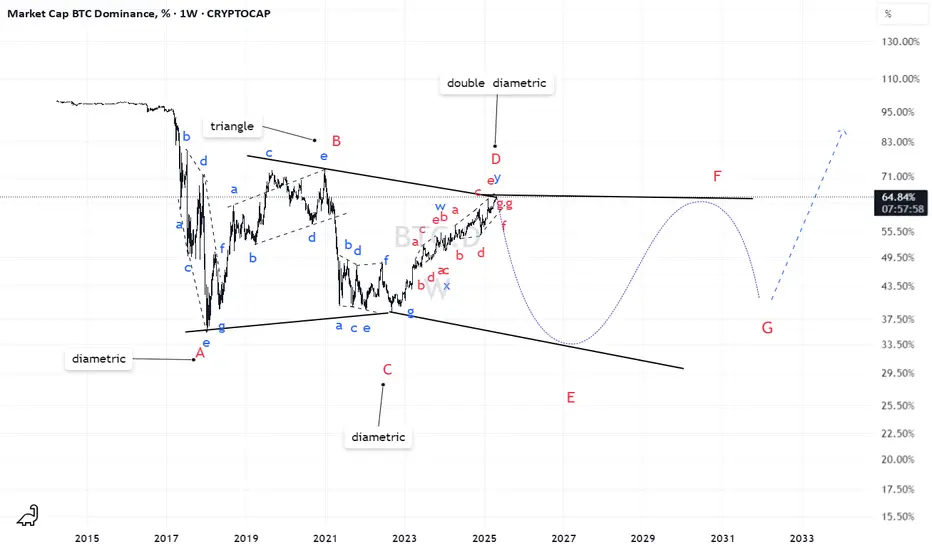
BTC.D(based on NEo wave)I changed my idea about midterm but not about longterm!
Altseason will make a heavy downtrend for this in a few months later which I call it wave E
BTC Dominance will rise above 70-72%BTC.D.% W has established range, I would expect it to get to 70-72%. I dont think we will see altcoin season soon. World is discovering bitcoin on the level of countries, banks, billionaires, investment funds. Ask a question, if you were the bank, or government would you hold 65% in BTC and the rest in alts? What would be your counties portfolio, would you be a president? I bet, you would say at least 95% in BTC. I think 70-72% of dominance can be broken up to 80% easy, when another $10T get into crypto.
IMO for the next couple of years this trend will steady go up only.

Bitcoin Dominance TO 52% with in 7 to 14 days Bitcoin dominance has recently experienced a significant upward trend, reaching 64.96% on the daily timeframe. This surge highlights Bitcoin’s growing strength 💪 relative to the broader cryptocurrency market. Currently, dominance is approaching a key resistance level at 65.79% 📈, which is considered a potential reversal zone 🔄.
🧠 Technical Overview
A closer look 🔍 at the recent momentum in Bitcoin dominance reveals signs of a maturing uptrend 📶. As the indicator nears historically significant resistance levels, the probability of a downward correction 📉 increases. Based on time-based analysis ⏱, signs of a pullback are expected to emerge within the next 7 to 14 days 📆 from the point of touching or nearing the 65.79% level.
🎯 Potential Correction Targets
If the anticipated reversal materializes, the correction targets are as follows:
First Target: A retracement to the 60% level, which has acted as prior support 🛑 and could temporarily halt further declines.
Second Target (deeper correction): A move down to 52%, a strategic support level 🧱 that could pave the way for altcoins 🚀 to outperform.

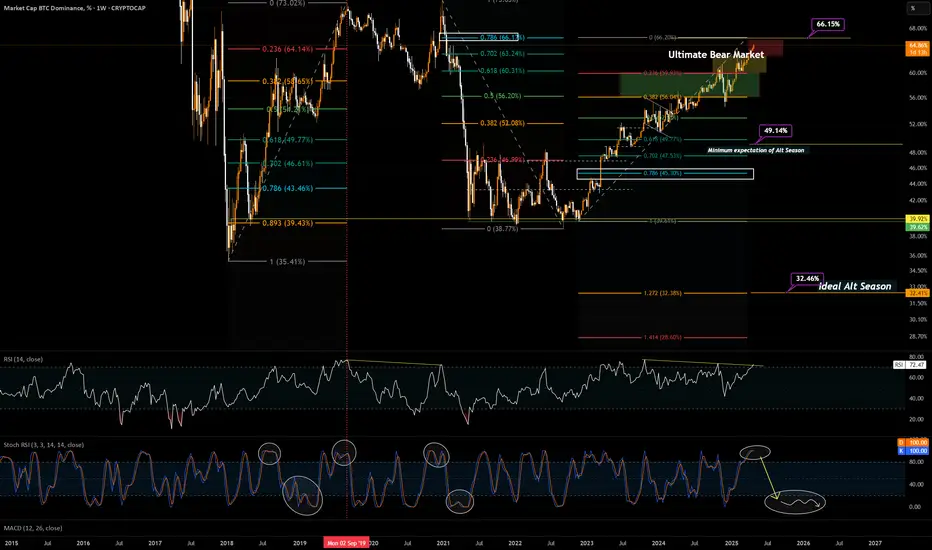
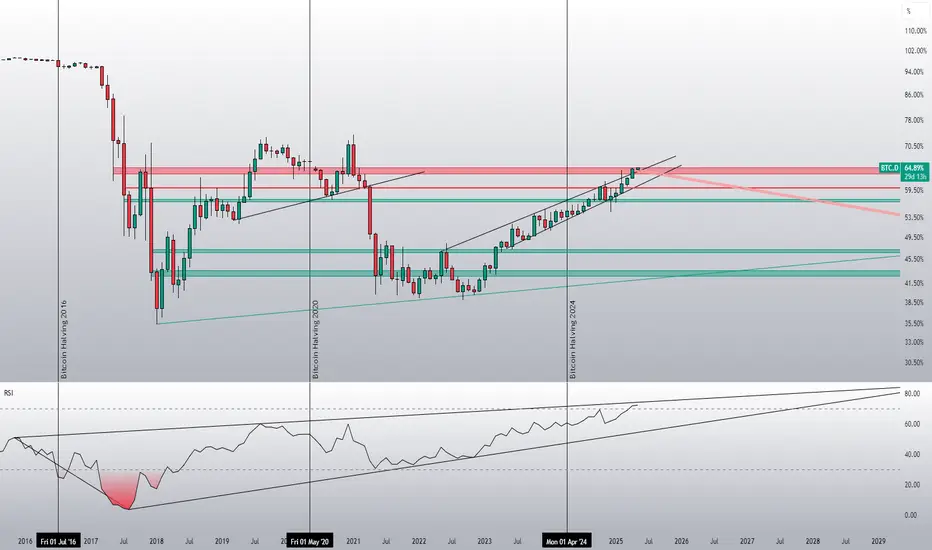
Bitcoin dominance and the altseasonIn this chart, you can see the Bitcoin dominance from 2017 till now.
The depth of the altseason was 35.14% and for the bear market we went up, up to 73.02.
If we take a Fibonacci retrace level, we can see during 2021 altseason we were only retraced 0.893 or 89.3% what we lost during bear market.
It was something new and for the first time, Bitcoin Dominance didn't make the new all time low.
Following the same fact, I decided to find the possible levels for bitcoin dominance to top. we are getting closing the the 0.786, this level usually the last level that we could be bearish in any chart, however remember that last altseason we passed 0.786 but rejected at 0.893.
My opinion would be we are reaching to the top of Bitcoin dominance sooner than later, I can easily see Alts are reversing from bearish in short term and BTC Dominace Maxing in stoch RSI.
When you stay longer than usual in max excitation in stoch RSI you will be doing longer in opposite direction as well
Max BTC dominance can reach 66.2%
However, worse case scenario I am expecting at least BTC Dominace during altseason drop to 49.14% which is a historical support and also resistance during BTC season and Alt Season.
Ideally, we should go down up to 45.30% as it would be the 0.786 of the range from 39.9% to 66.2%
However, if we are able to make a new All time low in BTC dominance first idea place to see rejection or reaction would be 32.38%
It was fun while it lastedIf this bearish gartley plays out brace yourself for a crash of epic proportions.
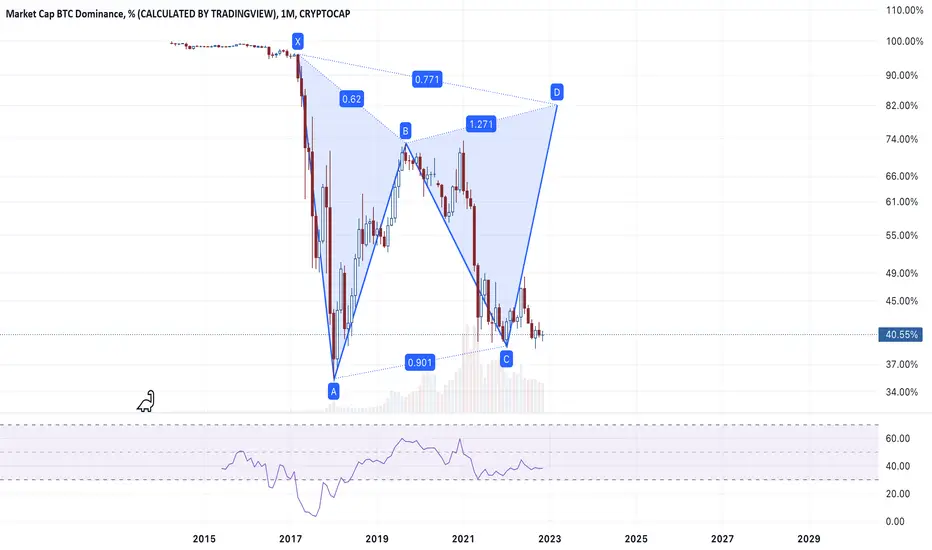
Beyond FOMO: Strategic Analysis of BTC.D and Market ProspectsLet's begin by examining CRYPTOCAP:BTC.D on the monthly timeframe. Here we see the old EXP model, which formed in December 2020. This model reflected the decrease in bitcoin dominance during 2020-2021. For our current analysis, we're interested in the level of the first point — 73.02%.
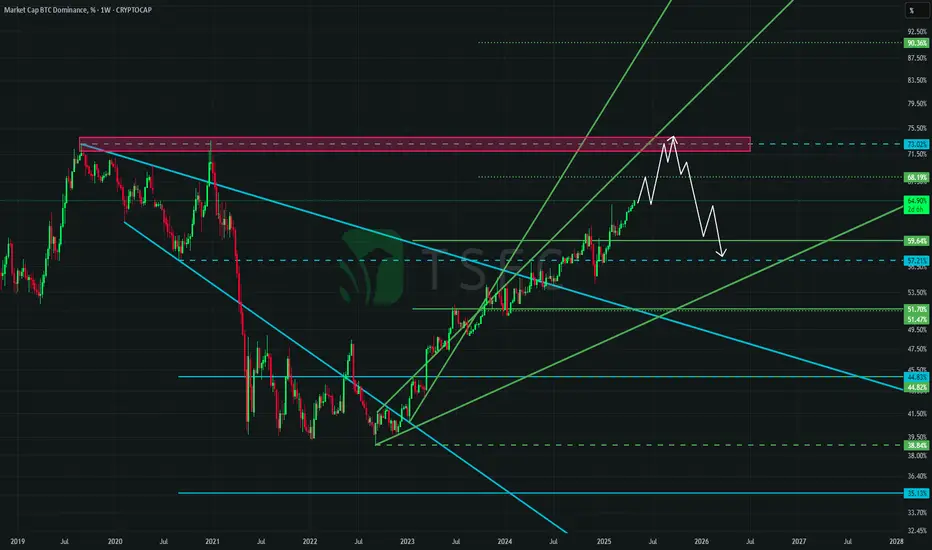
On the weekly timeframe, we see an AMEXP model that formed in January 2023 and effectively describes the entire current upward trend.
Note the price reaction from the model levels of 51.7% and 59.64%. Within this model, we have two more upper levels: 68.9% and 90.36%.
The dominance level of 90.36% seems unrealistic from a common sense perspective: such a scenario is only possible with a total collapse of the entire crypto market, when all assets (including bitcoin) would depreciate to the point where bitcoin's capitalization would constitute 90% of the entire market. I hope we never see these values. However, reaching the 68.9% level seems quite likely.
Most likely, the price will try to break through the 68.9% level (we may see a bounce from this level, which might be mistakenly perceived as the beginning of a new alt season). After that, the price will likely make a new maximum and rise above the 73.2% level. And only then will we finally see the formation of a downward trend in bitcoin dominance.
What might be happening in the market if our bitcoin dominance analysis proves correct?
Let's look at the #BTC chart, where the expansion model was validated on the weekly timeframe (green model):
According to the model levels, we can expect growth to at least $109,354, and at maximum — to a new all-time high (ATH) with targets of $115,116, $116,757, and even $152,723 or $174,102 (although the probability of reaching the last two targets, despite their presence in the model, is relatively low).
If we look at CRYPTO:ETHUSD , the picture looks significantly worse — the asset is in a deep bearish phase.
Against the backdrop of general positive sentiment, CRYPTO:ETHUSD may grow to $2 059 or even to $2 626, but we will consider this merely as a bounce. We can only talk about a real trend change when the price moves beyond the yellow model.
Everyone is waiting for the reversal of bitcoin dominance (we have only calculated the most probable reversal point), as its exponential growth should be replaced by the long-awaited alt season.
However, few consider a possible negative scenario: the correction of bitcoin dominance may occur against the backdrop of a general market decline, where bitcoin will fall faster than altcoins. Against the background of growing macroeconomic uncertainty (problems in the global economy have not disappeared, they continue to accumulate, and no matter how they try to "postpone" them — this will not pass without a trace), we consider the negative scenario to be the main one.
For the past year, everyone has been saying that bitcoin is a super-reliable asset, and if something goes wrong — you need to buy bitcoin. Most retail investors love bitcoin and hate altcoins — largely because they have many unprofitable altcoins in their portfolio and no bitcoin. Each time, missing the moment to buy bitcoin, they succumbed to FOMO. Now, as bitcoin moves toward a new maximum, everyone is rushing to buy it again.
At the same time, we have a market where 80-90% of participants are in large losses. For most assets to just break even (not to mention profits), they need to grow by 300-400%.
Of course, we're not saying everything will necessarily be bad, but we prefer to stick to a strategy that primarily takes into account the negative scenario. For now, we will refrain from investment positions and give preference exclusively to speculative ones.
Btcs dominance should dropBitcoins dominance has been rising and rising, and is about drop.
All seasons is here, buckle up buttercup, and enjoy the ride

Bitcoin Remains King, But Altcoins Face Potential Ruin.Although forecasts of Bitcoin reaching astronomical levels have cooled, its role as the foundation of the cryptocurrency ecosystem remains steadfast.
Bitcoin continues to demonstrate resilience and stability, serving as the digital gold standard in an increasingly volatile market.
However, a starkly different picture emerges for many Altcoins.
The classic "Head and Shoulders" pattern, a bearish technical indicator, is becoming increasingly prevalent, suggesting a potential decline or even extinction for a significant portion of the Altcoin market.
Investors need to proceed with caution and strategic foresight.Diversification and a focus on established projects like Bitcoin are paramount in mitigating risk. Understanding technical analysis and market trends is crucial to navigating the complex and ever-evolving crypto landscape.
Don't let the lure of quick gains blind you to the fundamental principles of sound investment. Choose stability, choose resilience.
SEYED.

Altcoin season closer than ever?It's done. BTC.D finally grabbed liquidity at 65%. Now the majority of liquidity is below.
When will altseaon start?#Altseaon2025
• BTC dominance: 64.86%, Strong Bitcoin focus.
• Altcoin market cap: $820.93B
• Altseason will start once BTC dominance clearly reverses below 60% and altcoins break out above $900B resistance.
As long as BTC dominance is above 60%, prefer investing in Bitcoin.

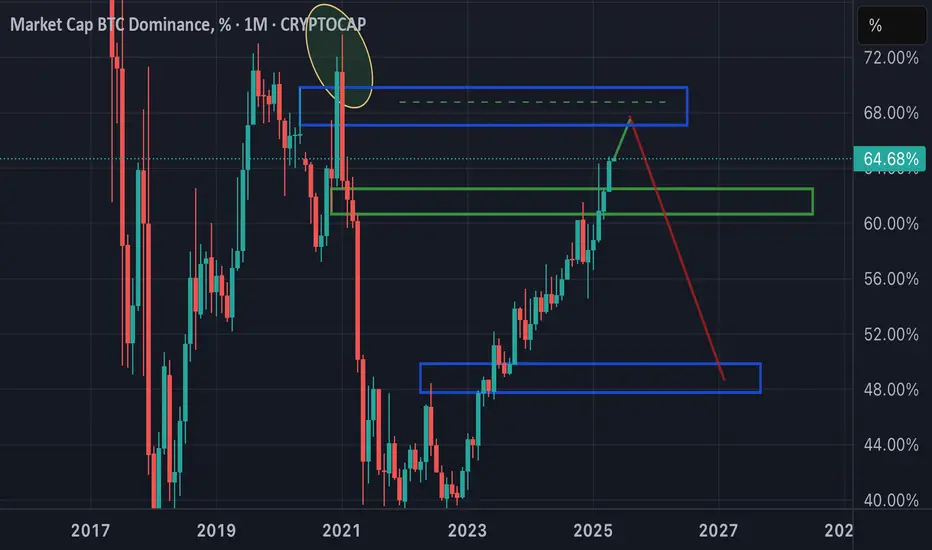
Bitcoin Dominance: My Global Overview Hello, Skyrexians!
Yesterday we made a local update on CRYPTOCAP:BTC.D where pointed out that waves order has been changed a little bit, today we will take a look at this chart globally. Soon we can have a great reversal but we will feel pain before it because target above 66% will happen.
This is monthly chart. The first greatest altseason looks like an impulsive wave 1. Then correction has been started. The first pullback finished inside 0.61 Fibonacci zone and it contains on 5 waves. This is the sign that it's wave A. If wave A has 5 waves it means that global wave 2 will be zigzag ABC or triangle ABCDE. We will exclude the zigzag because wave C has almost reached the wave A bottom, and it cannot be flat correction because wave A is impulsive, so we are in huge triangle. Waves A, C, E shall be impulsive.
Current wave is wave C which can reach any target next to the wave A top. Our earlier predicted 66-67% looks reasonable and we need to focus on internal counting. This chart is just to make us sure that we are next to reversal.
Best regards,
Ivan Skyrexio
___________________________________________________________
Please, boost this article and subscribe our page if you like analysis!

BTC DOMINANCEBitcoin dominance could break down at this point, potentially signaling the start of an exceptional altseason.
BTC DOMINANCEBitcoin dominance could break down at this point, potentially signaling the start of an exceptional altseason.

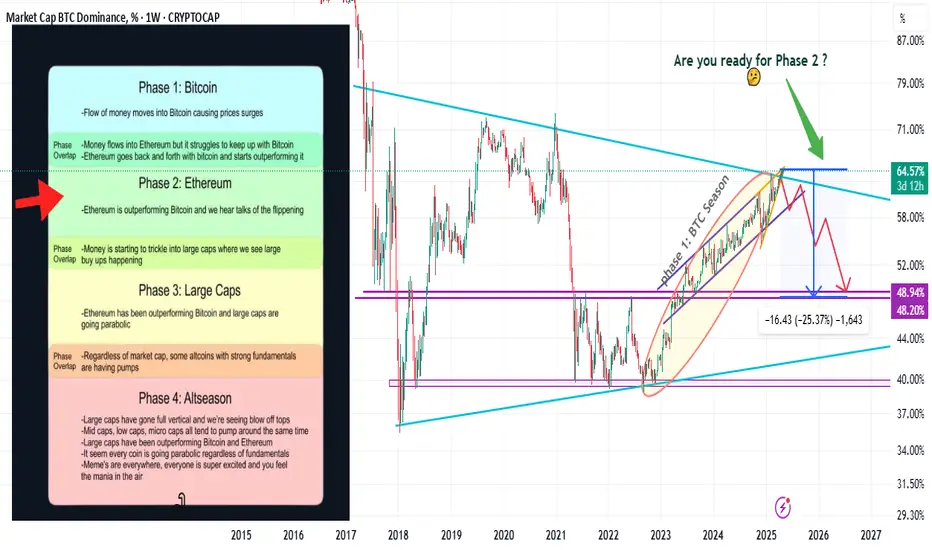
Crypto Phases Explained: From Bitcoin Season to Full-On FOMO !Hello Traders 🐺
I hope you're doing well. In this idea, I want to dive into the different phases of the crypto market, because I feel like many new traders — and even some semi-pros — still don’t fully grasp this fundamental concept. So make sure to read this until the end and feel free to ask your questions in the comments below!
🔹 PHASE 1 – Bitcoin Season
This is where it all begins.
You can guess from the name: BTC starts outperforming almost every altcoin, especially ETH. In this phase, Bitcoin’s price often grows rapidly while most alts lag behind. As BTC's market cap rises, Bitcoin Dominance (BTC.D) also increases — and this is clearly visible on the chart.
In the current market, BTC.D is rising toward a key resistance level, suggesting we are still in late Phase 1, but possibly approaching a shift.
🔹 PHASE 2 – Ethereum Season
Why ETH and not the rest of the altcoins?
Because when smart money rotates out of BTC, the first stop is usually Ethereum, the second-largest asset by market cap. ETH is also the backbone of many other projects, so it makes sense that it leads the altcoin wave.
When ETH starts to outperform BTC, that’s your sign: Phase 2 has begun.
🔹 PHASES 3 & 4 – Altcoin Season
This is the fun part. 🤑
In Phase 3, we typically see larger cap altcoins (top 100 projects) begin to surge and hit new all-time highs. Then comes Phase 4, the final leg of the bull cycle — full-on FOMO. Even low-cap coins start doing 20x or more, and yes, many small investors suddenly feel rich.
🔎 So… how do we know what phase we’re in?
Excellent question. But a tricky one.
As mentioned, BTC.D is showing signs of weakness near a long-term resistance trendline. That could mean BTC is topping short-term, and ETH might soon start to take the lead. To confirm that, just watch the ETH/BTC chart closely.
For deeper confirmation, add these charts to your watchlist:
OTHERS/BTC
TOTAL2
TOTAL3
They help you see when capital starts flowing into mid and low-cap alts — and help you track the sunrise… and the sunset. 🌅
Final Note:
If you’re still confused during market volatility, don’t worry. Trading is a long and tough journey — and patience is key. Learn from your mistakes, stay disciplined, and always remember:
🐺 Discipline is rarely enjoyable, but almost always profitable. 🐺
Stay sharp,
🐺 KIU_COIN 🐺
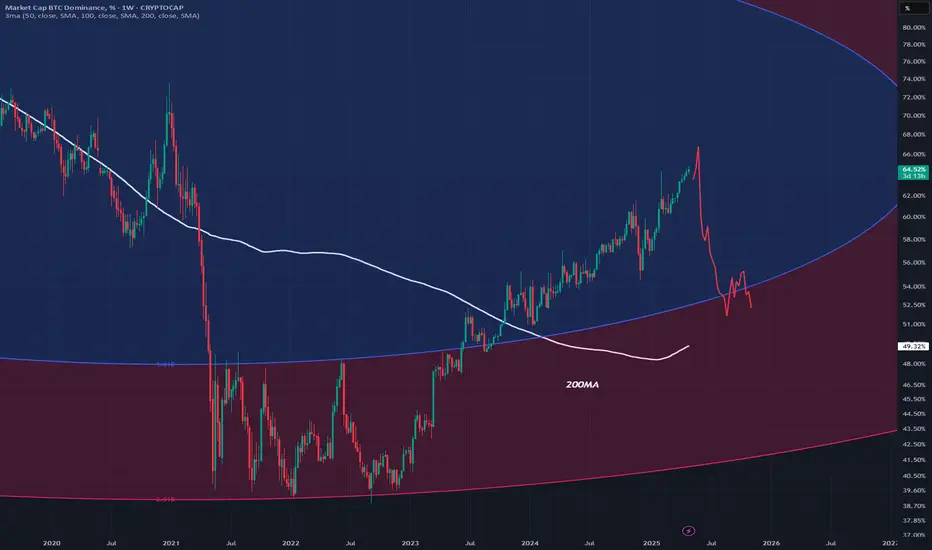
BTC Dominance - AltseasonExpecting a move down to the 200MA in white or grey
This aligns with the fib circle 1.618 in blue
This will be the third strong alt season
Bearish for dominance for now
Weekly timeframe
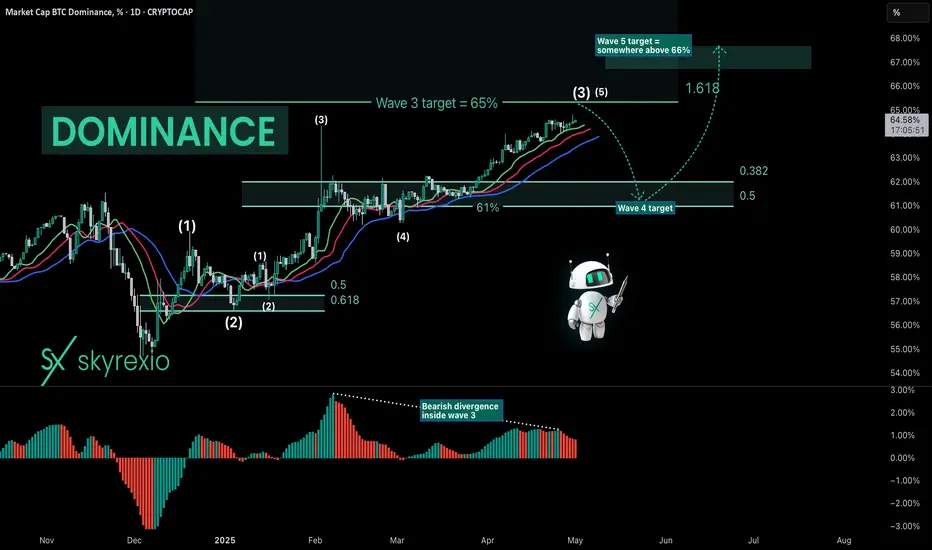
Bad News From Bitcoin Dominance: Pain AheadHello, Skyrexians!
I got sick for these 5 days that's why has not shared updates, but market was very boring so we didn't miss any significant move. CRYPTOCAP:BTC.D concerns me now because to end this trend we need to see any significant correction, but we didn't. On the 12h Awesome oscillator was not able to cross zero line and reversed to the upside, so our main change is that daily time frame measures the wave 3 inside the major impulse.
If we count waves inside this impulse price is approaching 1.61 Fibonacci level at 65.3% and trust me it's much better to see it's reaching before the drop. When this wave will be finished, wave 4 will happen. It can bounce significantly to 61%. This is strong target area and I am sure we will be there soon. Wave 5 can be extended, can be not. The max target is 71%! Sounds awful. The likely target at 66-67%, to make it more precise let's wait for wave 4 finish.
I plan to close in profit those part of trades which has been opened after Feb 3 dump on this potential bounce to have money to add on the last huge shakeout. People believe in altcoins too much, very unlikely to have altseason now. Ready for hate!
Best regards,
Ivan Skyrexio
___________________________________________________________
Please, boost this article and subscribe our page if you like analysis!
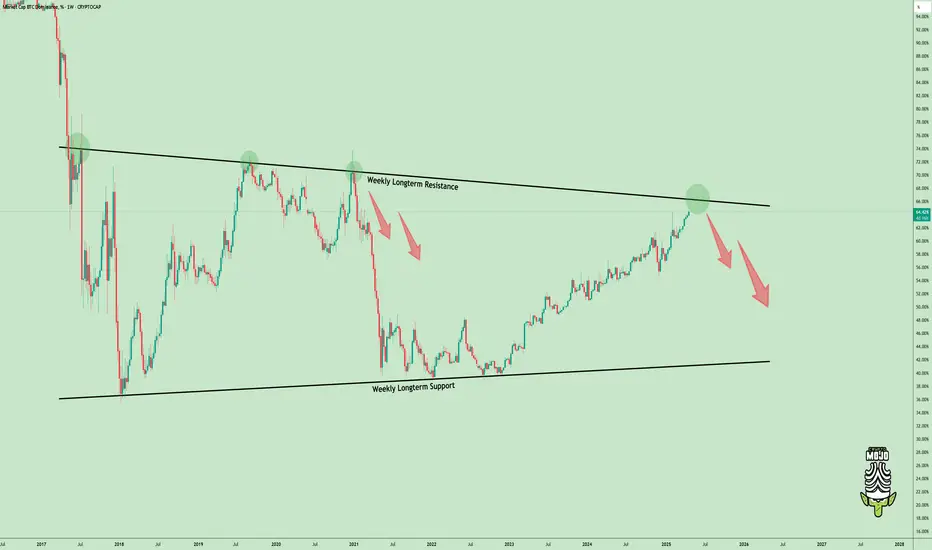
Altseason Loading? BTC Dominance Hits Key Resistance!The BTC Dominance chart is testing a long-term weekly resistance zone.
Every time it hit this trendline in the past, we saw a strong reversal. If history repeats, altcoins could soon gain serious momentum.
Stay alert. A shift might be coming.
#BitcoinDominance #Altseason
Btc.d targetting lows.This is the short term target.
* The purpose of my graphic drawings is purely educational.
* What i write here is not an investment advice. Please do your own research before investing in any asset.
* Never take my personal opinions as investment advice, you may lose your money.

buyingThe launch of altcoins is approaching. We are still in the Bitcoin dominance zone. Many of those who rush will lose patience. A lot of patience.
Soon things will become clear.
This is not financial advice

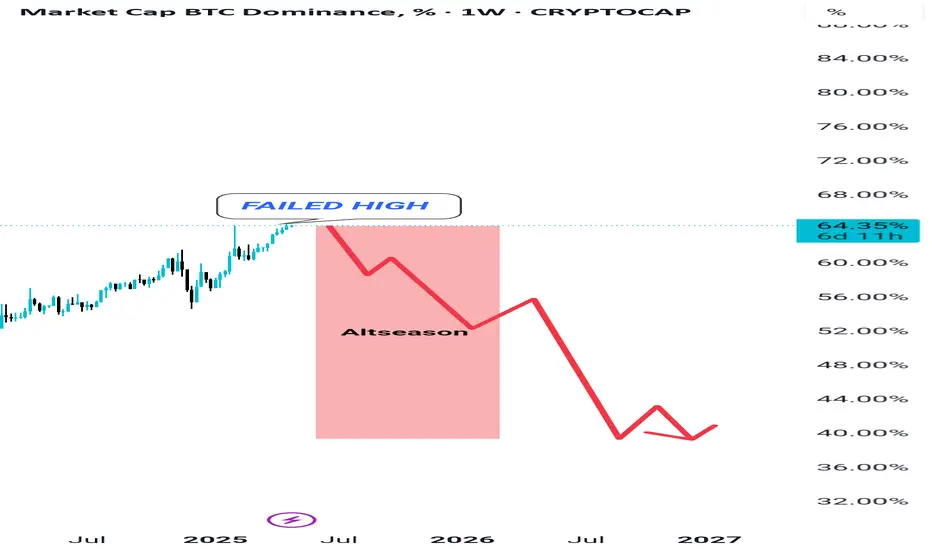
BTC Dominance weakness of uptrend Bitcoin's dominance has failed to establish a new high, suggesting a significant weakening and a lack of upward momentum. This failure strongly indicates that Bitcoin's dominance is poised for a reversal from this point, potentially initiating a new downtrend. Furthermore, a compelling bearish divergence is forming on Bitcoin's dominance on the weekly timeframe's Relative Strength Index (RSI). This bearish divergence is a robust indicator of a potential trend reversal. Considering these factors, there is a high probability of witnessing a decline in Bitcoin's dominance in the near future.
when is ALTCOIN #bullrun??if the bitcoin dominance managed to reach
67.8_ 70.7 by the date of 9 June
I'll be expecting a top formation
so I'll be looking for bearish price action there
trade safe
and follow for more
