Longlived Dominance Coming to an end (Somehow-Someday)?!There are some probabilities (mostly bullish) that The Dominance has peaked and makes a final re-test of the highs right now, before the summer, and from that point until late fall, we can see bitcoin dominance dropping to lower values. Many altcoins holder experience a burnout
The altcoin market di

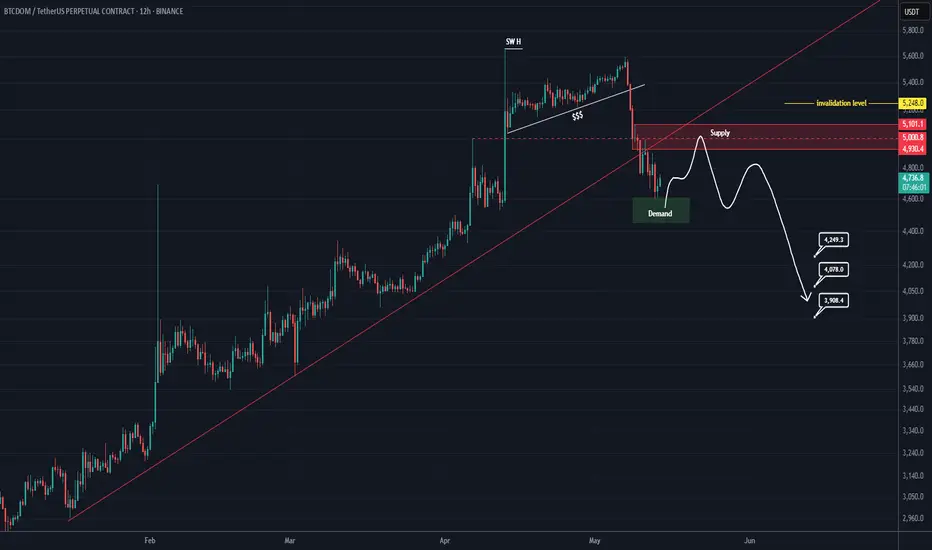
BTCDO Analysis | Catch the altseason! (12H)Note: This chart is tied to Bitcoin dominance and moves accordingly.
The trendlines have been lost, the price has dropped, and it has reached a support level. Such strong trends, when they come to an end, usually result in a pullback to the trendline or the broken levels.
Currently, the price may
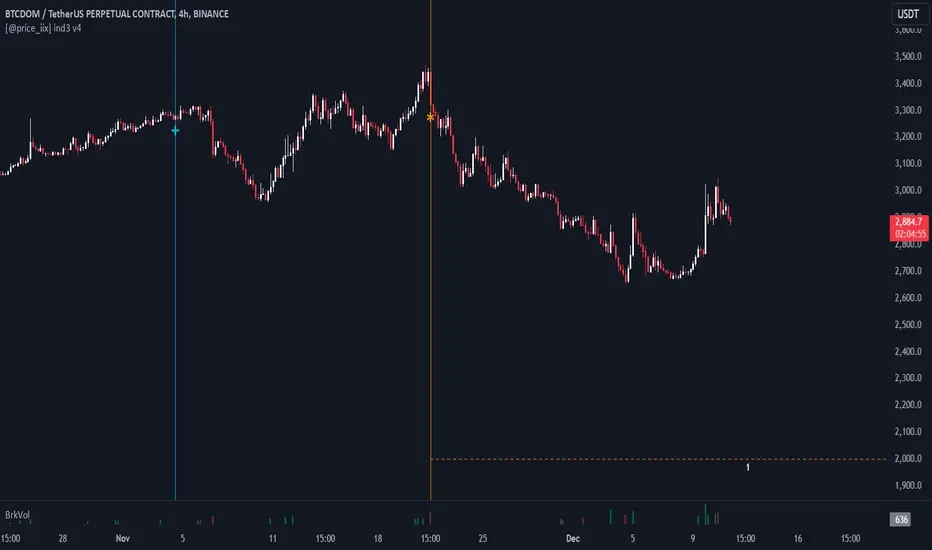
BITCOIN MARKET TOP LEADING INDICATOREverytime BTCDOM experience a sell off,it signals a short or long term top is in for BTC price action.
This is usually a leading indicator and usually play out in BTC price after some weeks/months time

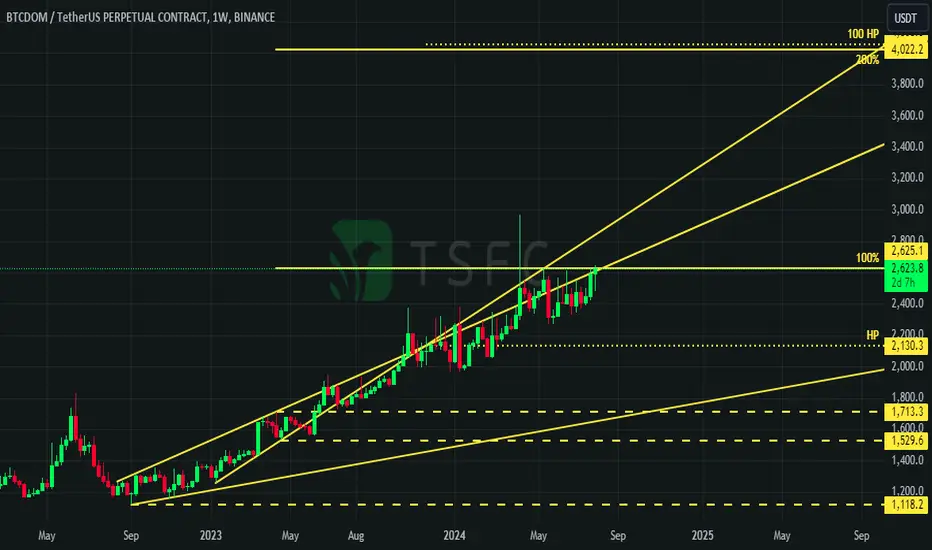
BTCDOM at the threshold of a strong impulseA very interesting situation is now observed on such a ticker as BINANCE:BTCDOMUSDT.P - bitcoin dominance index released by Binance. It differs from CRYPTOCAP:BTC.D in that it shows bitcoin dominance to the top 20 altcoins.
On the weekly chart of BINANCE:BTCDOMUSDT.P there is a very old AMEX
BTC DOMINANCE
Disclaimer 👉 This is my personal analysis for educational purposes , Buy/Sell/Trade at your own risk. I am not a financial Advisor
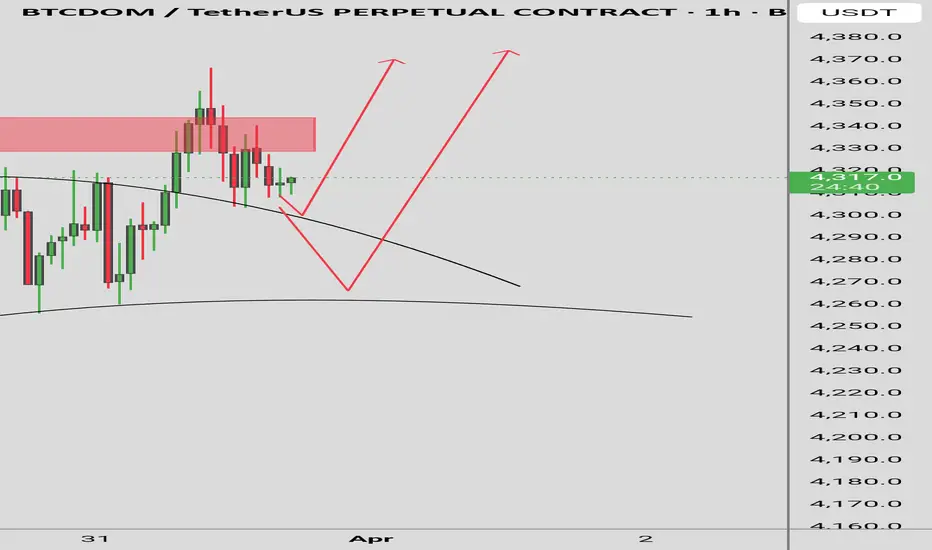
BTC DOMINANCEI see an ascending rising channels that predicts BTC could be in its final phase of dip. If price confirms to this ascending structure, then it ca indicate a confirmation for dominance.
What does this mean for traders?
Well, a break upwards or further ascending structure can mean BTC outperfor

February must be good for alts.BTC.D looks like going to double top and reject, february should be good for ALTs and especially ETH.
BTCD Break StructureA break of this structure either upwards or downwards could mean different things. A breakdown could mean strong upward movement for altcoins and Bitcoin dominance weakening. A break upwards could mean BTC outperformance while altcoins remain stagnant or lose value. Either way, we wait.

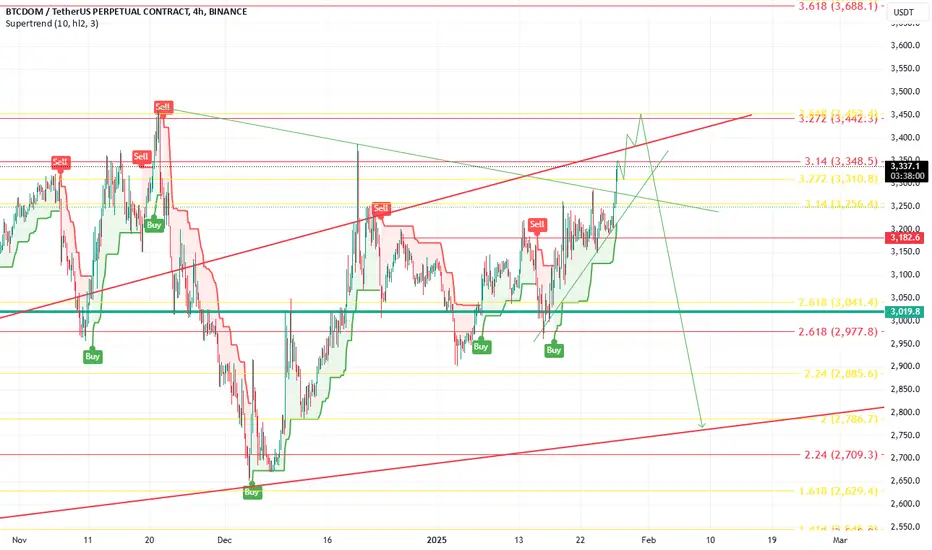
Technical Analysis of BTCDOMBINANCE:BTCDOMUSDT.P reflects Bitcoin's dominance in the cryptocurrency market, currently trading at approximately 2936.8 points on Binance. The chart indicates that the index is testing key resistance levels near 2940 points after recovering from support levels around 2910.
Key Technical Highligh

See all ideas
Summarizing what the indicators are suggesting.
Oscillators
Neutral
SellBuy
Strong sellStrong buy
Strong sellSellNeutralBuyStrong buy
Oscillators
Neutral
SellBuy
Strong sellStrong buy
Strong sellSellNeutralBuyStrong buy
Summary
Neutral
SellBuy
Strong sellStrong buy
Strong sellSellNeutralBuyStrong buy
Summary
Neutral
SellBuy
Strong sellStrong buy
Strong sellSellNeutralBuyStrong buy
Summary
Neutral
SellBuy
Strong sellStrong buy
Strong sellSellNeutralBuyStrong buy
Moving Averages
Neutral
SellBuy
Strong sellStrong buy
Strong sellSellNeutralBuyStrong buy
Moving Averages
Neutral
SellBuy
Strong sellStrong buy
Strong sellSellNeutralBuyStrong buy
Displays a symbol's price movements over previous years to identify recurring trends.