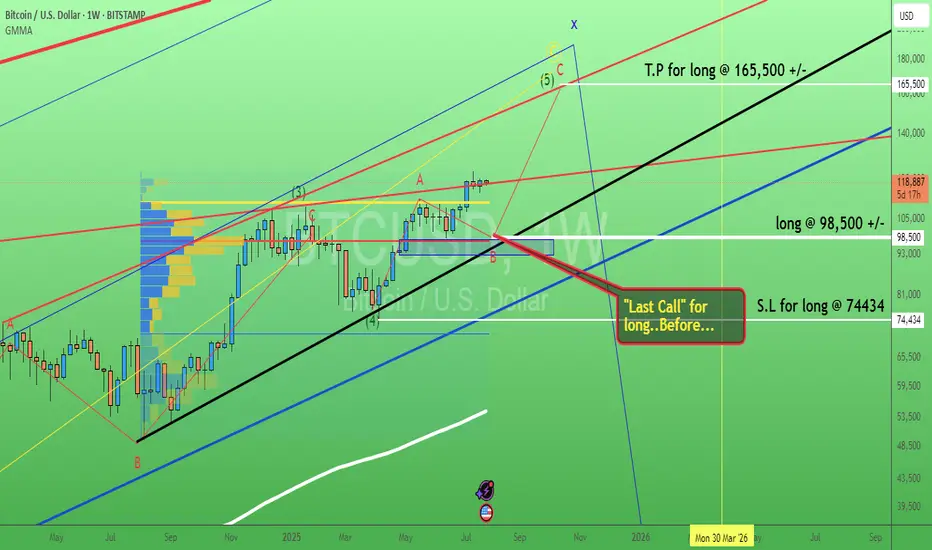
Bitcoin. Last call buy level? 29/July/25BTCUSD probably will have pullback toward confluence zone of 1) Trendline Support 2) Order Block 3) POC of volume before hitting ATH again
BTCETH.P trade ideas

BTC whats next ? a reversal in LTF
* **Blue Zone** = Minor bullish support or reaction zone
* **Yellow Zone** = Major bullish order block / demand zone
* **Red Zone** = Bearish supply zone or resistance
---
### 🧠 **Scenario Planning:**
#### ✅ If price **holds above the blue zone**:
* Expect a **bullish continuation**
* Target: **Red zone** (potential resistance or reversal area)
* Could be a scalp long opportunity with SL below blue
#### ❌ If price **breaks below the blue zone**:
* Expect a **drop toward yellow zone**
* Yellow zone could act as **bullish OB** and reversal point
* Possible long opportunity at yellow, targeting red again
---
### ⚠️ Key Considerations:
* Wait for **reaction confirmation** at blue or yellow before entering
* If BTC forms **bullish engulfing or BOS at yellow**, that’s your entry trigger
* Volume and market structure confirmation will strengthen conviction

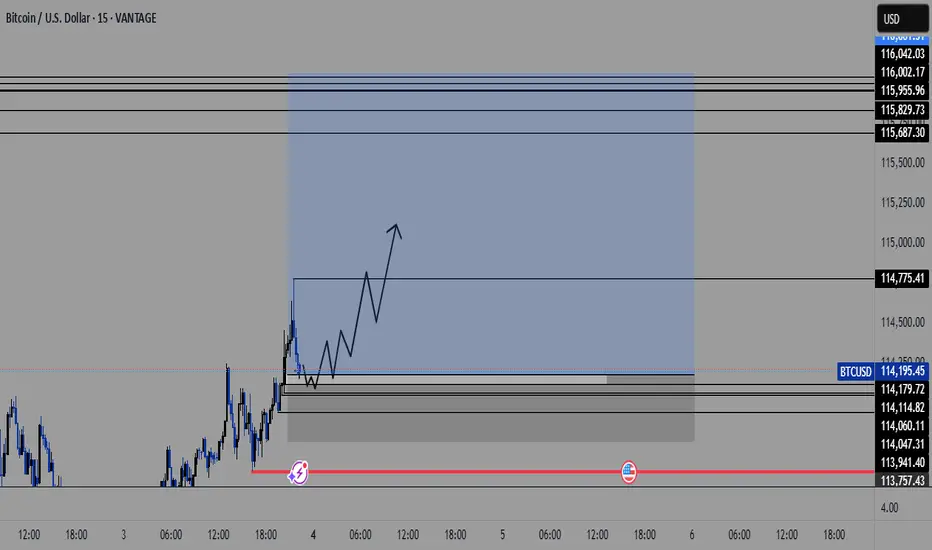
Bitcoin long again from 114k.Got stopped from the previous long , seems like btc wanted to sweep these 4h lows and continue higher .
Lets wait and enjoy the show in the upcoming months.

BTCUSD The Week Ahead Key Support and Resistance Levels
Resistance Level 1: 119,000
Resistance Level 2: 121,030
Resistance Level 3: 122,862
Support Level 1: 111,683
Support Level 2: 110,450
Support Level 3: 108,720
This communication is for informational purposes only and should not be viewed as any form of recommendation as to a particular course of action or as investment advice. It is not intended as an offer or solicitation for the purchase or sale of any financial instrument or as an official confirmation of any transaction. Opinions, estimates and assumptions expressed herein are made as of the date of this communication and are subject to change without notice. This communication has been prepared based upon information, including market prices, data and other information, believed to be reliable; however, Trade Nation does not warrant its completeness or accuracy. All market prices and market data contained in or attached to this communication are indicative and subject to change without notice.

BTC Expansion BTC expansion after a low reading on BBWP. The stochastic RSI gives us an idea of the direction of the move.

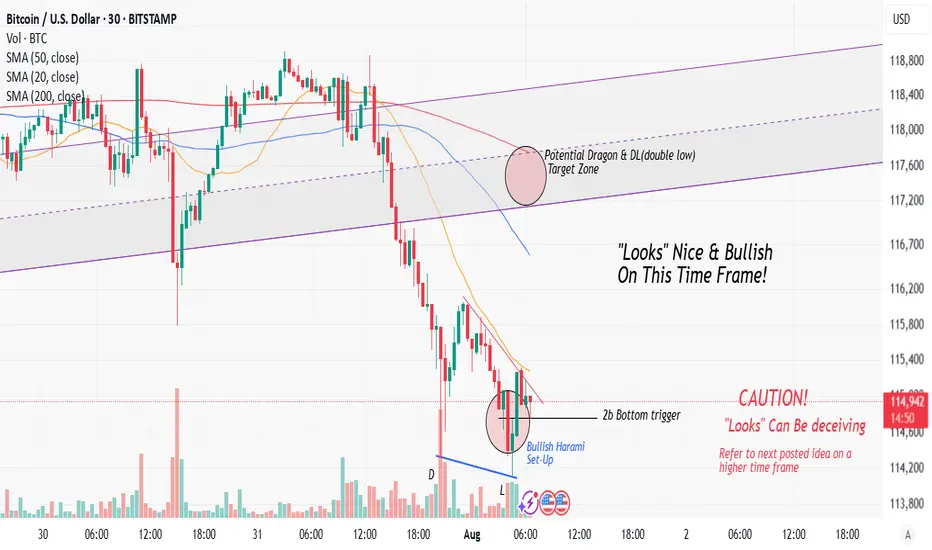
Nice Bitcoin Bullish Set Up On The Hourly I noticed something that may look interesting on the hourly time frame. So here's a little heads up!
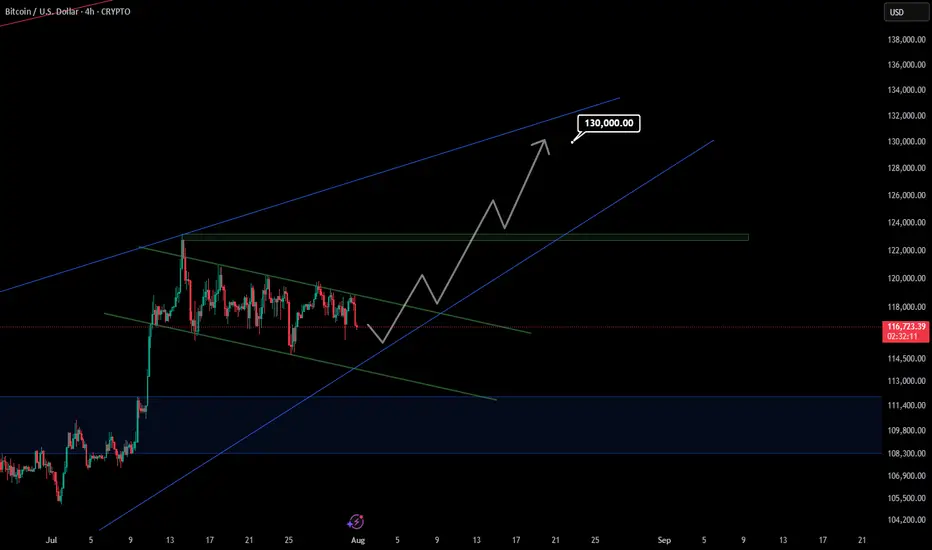
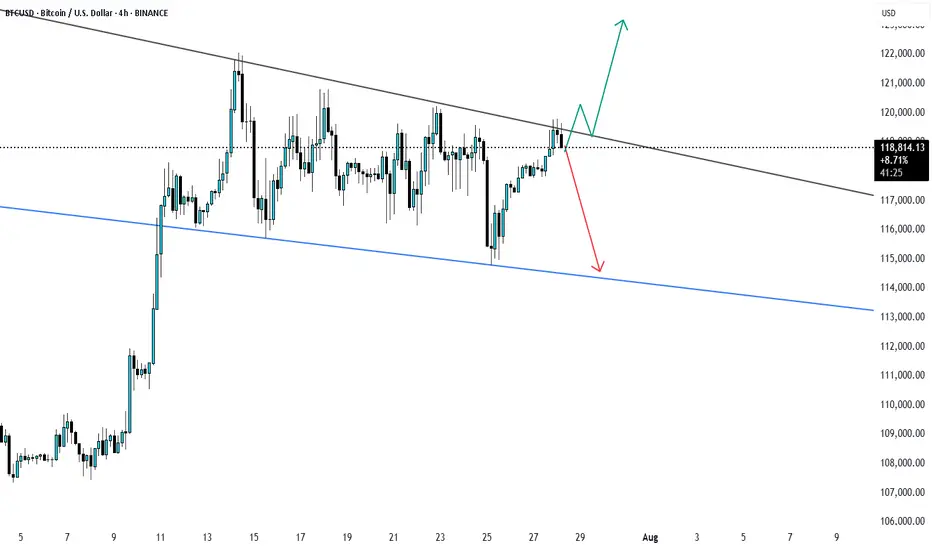
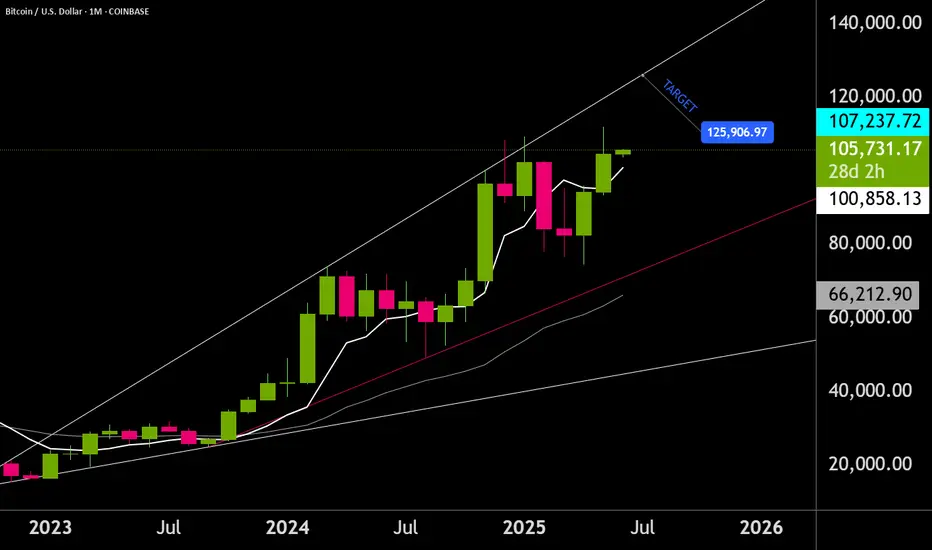
Bitcoin to 130kBTC is still moving inside the falling wedge. A bounce from the lower boundary could trigger a breakout and push price toward $130,000 in the coming weeks.
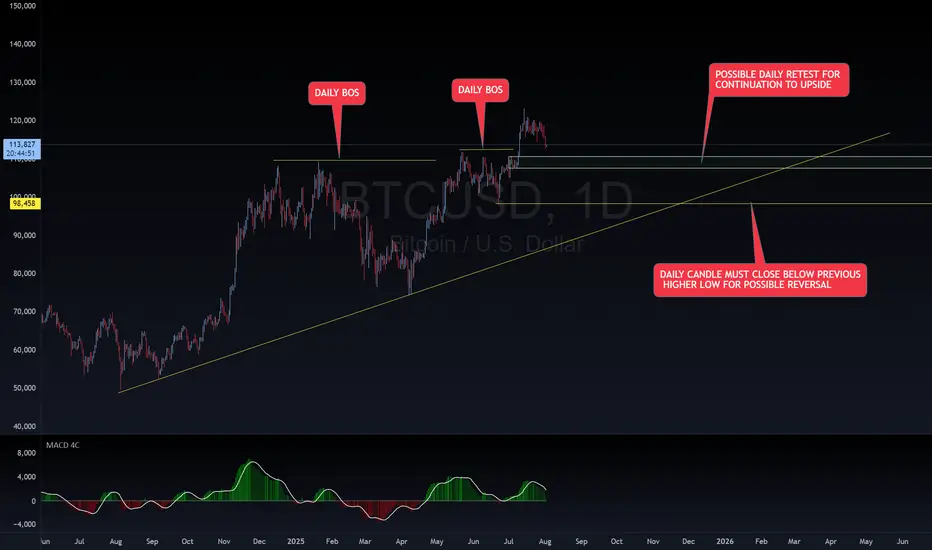
BTC BUY SET UPBTC is on an overall DAILY uptrend with a DAILY BOS. Waiting on a DAILY retest for continuation upward. If DAILY candle breaks and closes below last DAILY HL, it could potentially cause a reversal to downside. Happy trading!
~~~~I want everyone to succeed!
going lon after the close of 07:00 AM the price took the lequidite of a significant Low , and back to the range never close below
this low in 1H TF and 4H TF after we get HL or Swing high I enter buy

BTCUSD – Retest of Key Support at 111,900After setting a new all-time high at 123,229.00, BTCUSD has pulled back and is currently reacting to the 111,900.00 support area. This level aligns with prior structure and may provide a short-term floor if bullish momentum returns.
Support at: 111,900.00 🔽 | 100,622.00 | 87,589.00
Resistance at: 116,190.00 🔼 | 120,011.00 | 123,229.00
🔎 Bias:
🔼 Bullish: Price must hold above 111,900.00 and reclaim 116,190.00 to set up for a potential retest of the all-time high.
🔽 Bearish: A breakdown below 111,900.00 opens the door for deeper correction toward 100,622.00 and 87,589.00.
📛 Disclaimer: This is not financial advice. Trade at your own risk.

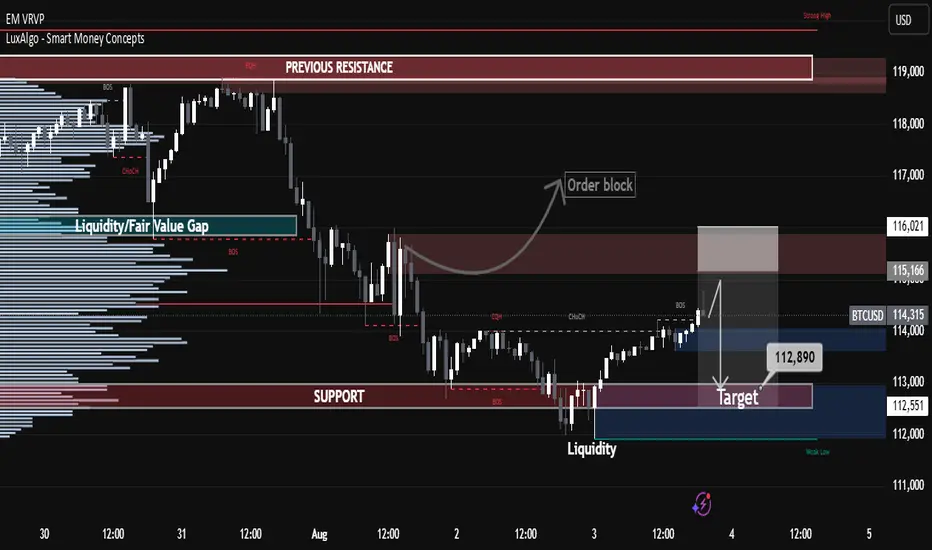
BTC Hits Premium Zone – Bearish Reversal Loading? BTC Hits Premium Zone – Bearish Reversal Loading?
🧠 Technical Breakdown:
🔹 1. Previous Market Structure & CHoCH
The chart shows a clear shift in structure (CHoCH) on the left, which marked the start of the bearish leg.
Break of Structure (BOS) confirms continuation of lower highs and lower lows until recent liquidity grab near the $112,551 zone.
Equal highs and liquidity above were taken out, making the move into the Premium Order Block zone highly significant.
🔹 2. Liquidity and Fair Value Gap (FVG) Zones
A major Liquidity + FVG zone was left unmitigated between $113,000–$112,000, and price is likely to revisit it.
This aligns with the target zone at $112,890, which is highlighted as a magnet for price to rebalance the inefficiency.
🔹 3. Order Block & Premium Supply Zone
A well-defined Order Block is marked just below the resistance zone near $115,166–$116,021.
Price is currently retracing into this zone, suggesting a potential reaction point for smart money to re-enter shorts.
Volume is expected to pick up here, and a reversal could initiate if price fails to break above this supply.
🔹 4. Volume Profile and Market Imbalance
Volume clusters are heaviest near the $114,000–$114,300 range, indicating high activity and previous accumulation/distribution.
Thin volume near the $112,551 zone further confirms price may drop quickly if rejection happens.
🔹 5. Support & Liquidity Sweep
Support zone around $112,551 is a previous liquidity pool and weak low that has not been fully cleared.
Price is likely to revisit this zone in the short term to clear liquidity and complete market rebalancing.
🔐 Institutional Narrative:
Smart money engineered a liquidity sweep to the downside, then caused a retracement into premium.
Now, BTC/USD is positioned in a high-risk zone where sell-side institutions may enter to push price lower.
If this order block holds, expect a rejection toward $112,890, followed by possible deeper continuation into the liquidity void below.
📌 Key Levels:
Level Price (USD)
Strong Resistance Zone 115,166 – 116,021
Order Block (Sell Area) 114,800 – 116,000 (approx.)
Immediate Support 113,000 – 112,551
Target (Liquidity Zone) 112,890
Weak Low (Final Sweep) 112,000
📉 Trade Outlook & Strategy:
🔺 If price reacts bearishly at Order Block:
Look for lower timeframe BOS/CHoCH confirmation.
Entry: Short on rejection at or near $115,000–$115,500
Target 1: $112,890
Target 2: $112,000 (extended liquidity sweep)
Stop-loss: Above $116,200 (invalidates bearish OB)
🔻 If price breaks and closes above $116,021 with momentum:
Structure flips bullish, and the OB is invalidated.
Look for long setups on retracement to $114,000 zone.
🧭 Conclusion:
BTC/USD is currently trading within a Premium Zone, testing a strong Order Block below key resistance. Price may face a bearish reaction, targeting the liquidity zone at $112,890. Smart money footprints suggest a potential trap for breakout buyers, and if momentum fades, we can expect a downside reversal to sweep remaining liquidity.
BTCUSD Possible scenario BTCUSD is trading in range bound way and soon may breakout of again go down. Enter buy only on breakout and retest til then bearish will continue.
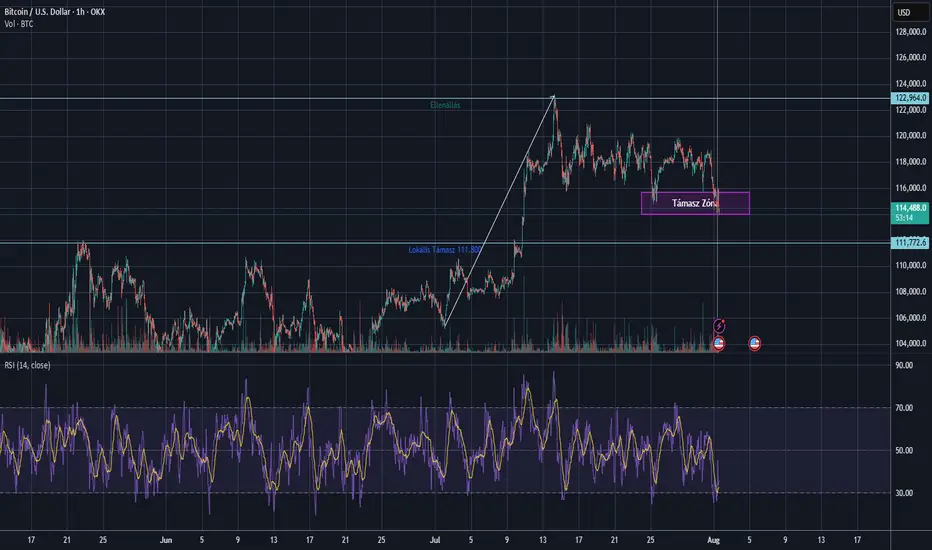
BTC Breaks Support – What's Next for Bitcoin?🧠 Bitcoin Technical Analysis – August 1st, 2025
📉 BTC/USD is under pressure, currently trading near $114,200, after dropping from the recent range highs. The chart shows a clear breakdown from a key consolidation zone between $114,000–\$115,500, marked as a crucial support zone.
🔍 Key Observations:
Major resistance remains at $123,000, where BTC topped mid-July.
A bullish trendline from early July has been broken — confirming momentum shift.
Local support sits at $111,800, a potential next landing zone if this breakdown continues.
The RSI (14) is now in oversold territory, below 30, signaling potential bounce or short-term relief — however, no bullish divergence is visible yet
---
🔎 Volume Spike & Momentum:
A noticeable volume spike has appeared alongside the breakdown, confirming strong selling pressure .
Short-term moving averages (e.g., 10 EMA) are now above price, adding to the b earish short-term bias.
🧭 Conclusion :
This region is critical for bulls — if BTC can reclaim the purple support box, it could invalidate the breakdown and trap aggressive shorts. Otherwise, \ $111,800 is the next area to watch for a reaction.
Let me know your thoughts below — Will this support hold or is \$110k next?
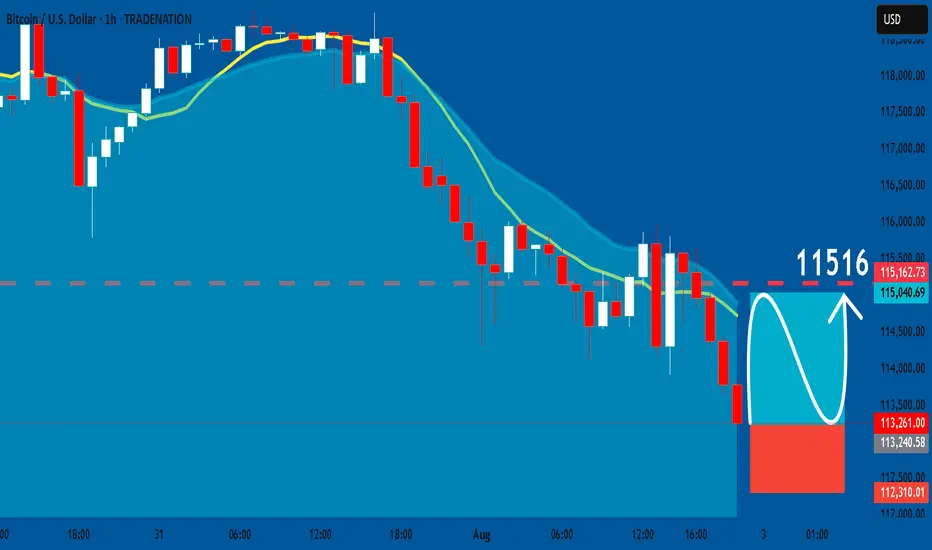
BTCUSD Will Explode! BUY!
My dear followers,
I analysed this chart on BTCUSD and concluded the following:
The market is trading on 11326 pivot level.
Bias - Bullish
Technical Indicators: Both Super Trend & Pivot HL indicate a highly probable Bullish continuation.
Target - 11517
Safe Stop Loss - 11236
About Used Indicators:
A super-trend indicator is plotted on either above or below the closing price to signal a buy or sell. The indicator changes color, based on whether or not you should be buying. If the super-trend indicator moves below the closing price, the indicator turns green, and it signals an entry point or points to buy.
Disclosure: I am part of Trade Nation's Influencer program and receive a monthly fee for using their TradingView charts in my analysis.
———————————
WISH YOU ALL LUCK

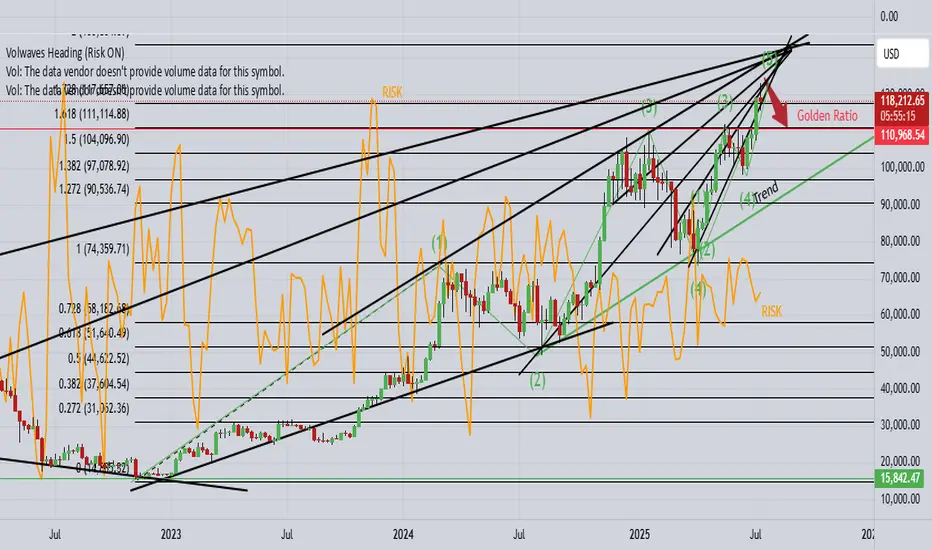
BTCUSD looking for corrective drop towards $111K!1). "Indecisive" weekly Doji retail candle! 2). Price rejection off higher times! 3). Risk indicator is heading south! 4). Trump said "BUY!" 5). There appears to be a cluster of "BUY" orders around $114$K as typically, price drops to trigger those orders!
Bitcoin to $116K in a Week? Here's the Case Everyone's IgnoringI know it sounds wild — but hear me out.
BTC is primed for something massive, and the ingredients are all on the table:
✅ ETF inflows are quietly stacking
✅ Supply shock post-halving is still underestimated
✅ DXY weakening = flight to hard assets
✅ Global uncertainty = Bitcoin safety bid
✅ Technicals pointing to a breakout above ATH with no resistance until $100K+
We're seeing the early signs of parabolic structure forming — and if volume confirms, this could move fast. Everyone thinks a 2x in a week is impossible... until it isn't.
Not saying it’s guaranteed — but if you've been around long enough, you know BTC doesn’t move linearly.
👀 Watch the $72K breakout zone closely. If it flips with conviction and volume, $116K is not out of the question.
Drop your charts. Agree or disagree?
Bullish bounce off swing low support?The Bitcoin (BTC/USD) is falling towards the pivot and could bounce to the 1st resistance.
Pivot: 115,415.51
1st Support: 113,466.96
1st Resistance: 120,573.43
Risk Warning:
Trading Forex and CFDs carries a high level of risk to your capital and you should only trade with money you can afford to lose. Trading Forex and CFDs may not be suitable for all investors, so please ensure that you fully understand the risks involved and seek independent advice if necessary.
Disclaimer:
The above opinions given constitute general market commentary, and do not constitute the opinion or advice of IC Markets or any form of personal or investment advice.
Any opinions, news, research, analyses, prices, other information, or links to third-party sites contained on this website are provided on an "as-is" basis, are intended only to be informative, is not an advice nor a recommendation, nor research, or a record of our trading prices, or an offer of, or solicitation for a transaction in any financial instrument and thus should not be treated as such. The information provided does not involve any specific investment objectives, financial situation and needs of any specific person who may receive it. Please be aware, that past performance is not a reliable indicator of future performance and/or results. Past Performance or Forward-looking scenarios based upon the reasonable beliefs of the third-party provider are not a guarantee of future performance. Actual results may differ materially from those anticipated in forward-looking or past performance statements. IC Markets makes no representation or warranty and assumes no liability as to the accuracy or completeness of the information provided, nor any loss arising from any investment based on a recommendation, forecast or any information supplied by any third-party.

BTCUSD: Long Signal with Entry/SL/TP
BTCUSD
- Classic bullish formation
- Our team expects growth
SUGGESTED TRADE:
Swing Trade
Buy BTCUSD
Entry Level - 11326
Sl - 11231
Tp - 11516
Our Risk - 1%
Start protection of your profits from lower levels
Disclosure: I am part of Trade Nation's Influencer program and receive a monthly fee for using their TradingView charts in my analysis.
❤️ Please, support our work with like & comment! ❤️
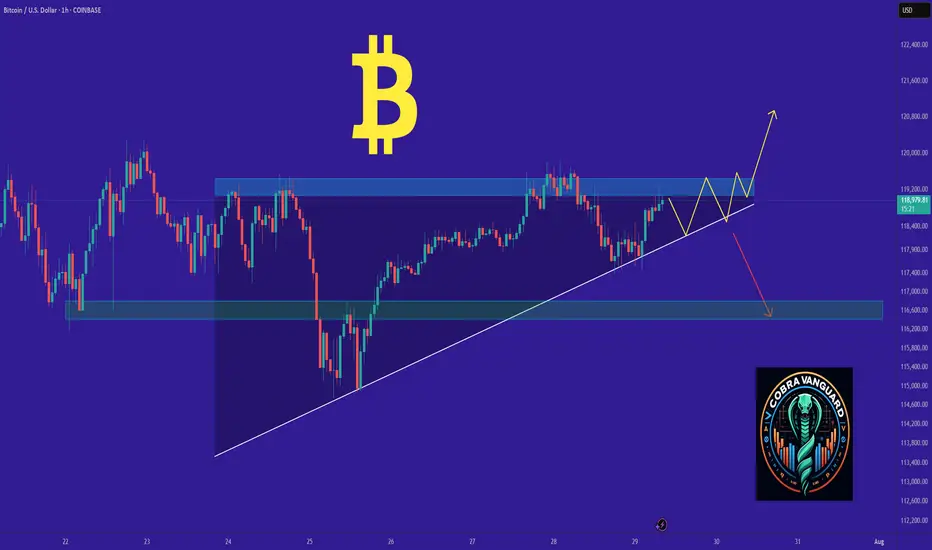
BITCOIN's Situation (1h) !!!The price is within an ascending triangle, which could be encouraging. However, since crypto doesn't always follow patterns, it might break down from below and correct to around $116K!
Best regards CobraVanguard.💚

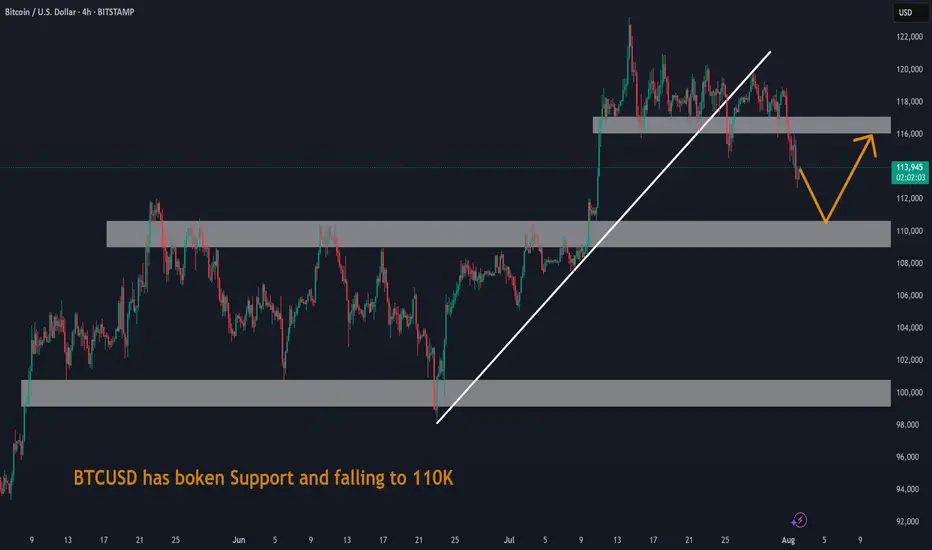
BTCUSD has boken Support and falling to 110KBTCUSD has boken Support and falling to 110K. This decline is due to General fall in equity market due to Tariff war.