Bitcoin FOMC aftermath & plan aheadHi all,
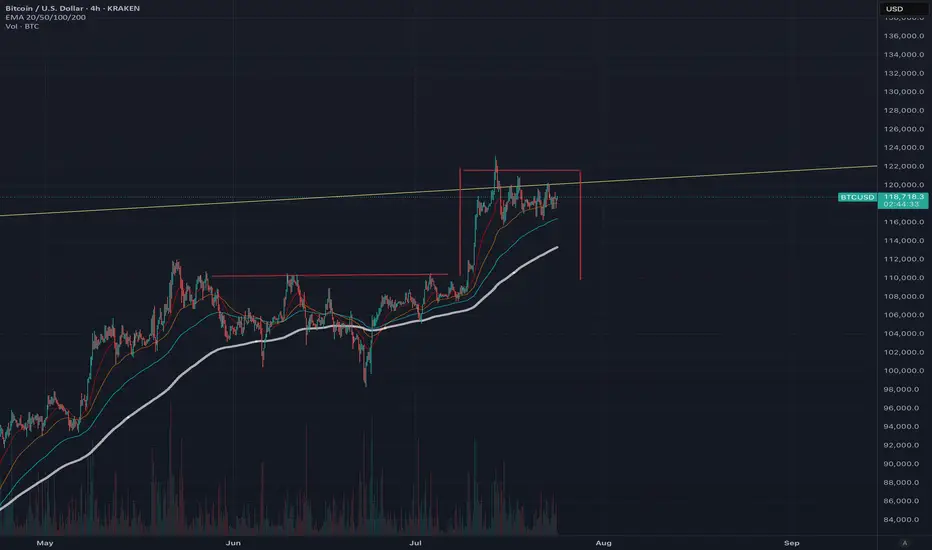
As you may have noticed, Wednesday's FOMC meeting delivered a less-than-optimistic outlook. The absence of rate cuts, combined with uncertainty about potential cuts in September, triggered a downward move in the markets.
Bitcoin is currently trading 7% below its high from July 14th. I anticipate a relatively shallow downtrend and plan to add to my position around $112,000.
BTCETH.P trade ideas
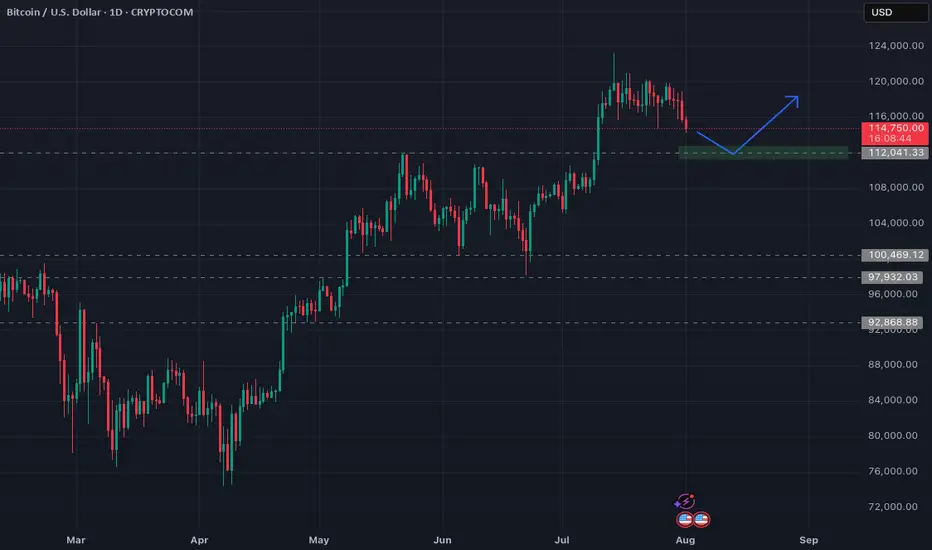
Next crypto/btc top timeframe according to different sourcesAccording to different sources the timing of the next crypto/btc top, could be as early as september 5th. See this chart for the different timeframes.
My current guess, if we get a rally towards $150k+ would be september/oktober.

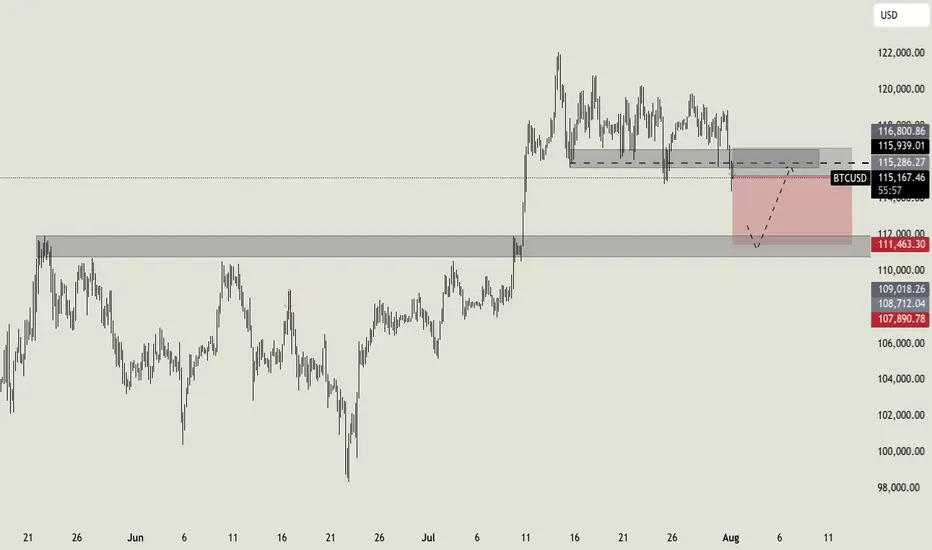
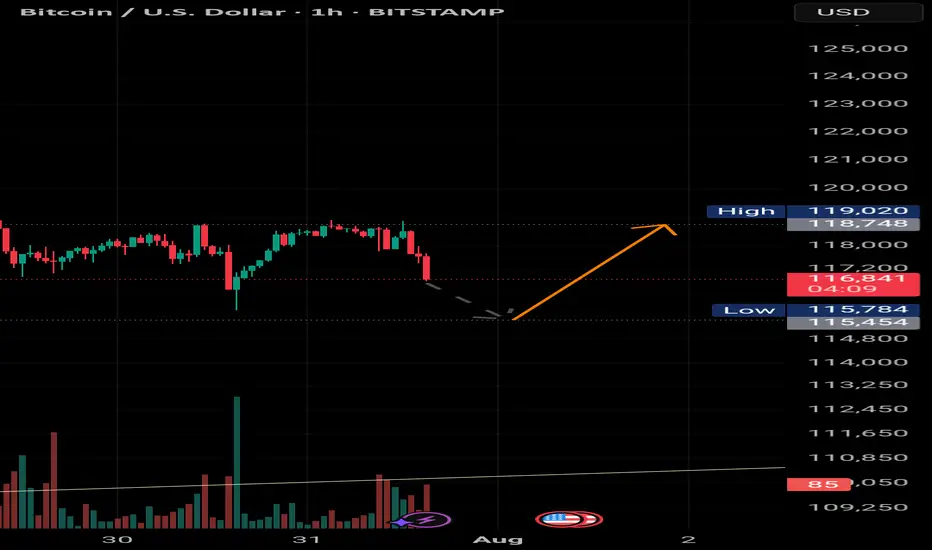
NO FEAR on BITCOIN!I was waiting for a break on this level from some days, and here we go! We catched a nice long setup previous days, and now Bitcoin broke down the key level i highlited last week. This is an important support area that will now act as resistance, so i expect a continuation to the downside till the second support area at $112.000. To invalidate this setup we should expect a clean break above $116.800.
Let me know in the comment what do you expect!
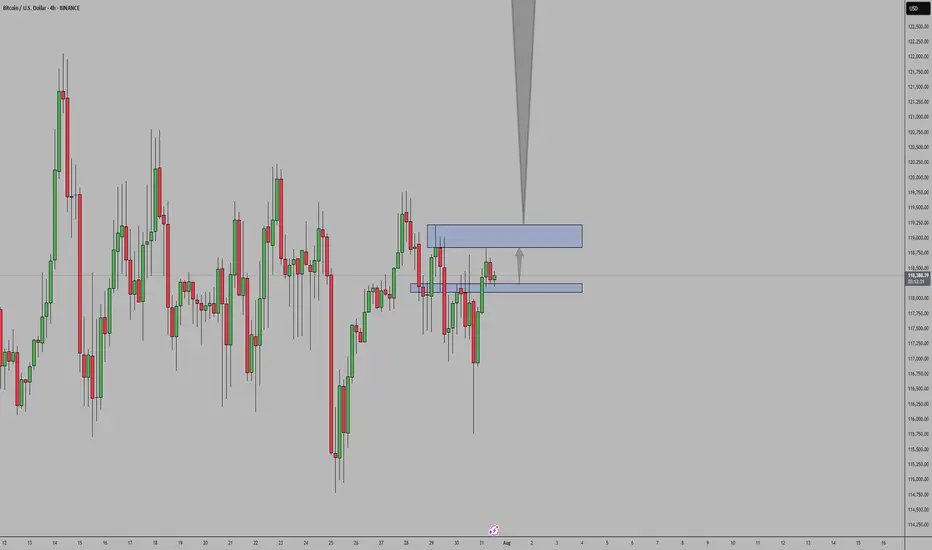
BTCUSD ideaWe are waiting for our asset to reach our action zone, and based on the reaction, we’ll decide on our next moves.ALWAYS WAIT FOR A CONFIRMATION TO SEE IF THE PRICE VALIDATES THE ZONE.and you what is your vision of the EURUSD its interests me! i wait you in the commentary

BTC/USD has formed a symmetrical triangle pattern on the 1-hour Price has broken downwards from the consolidation zone, signaling potential bearish momentum. If selling pressure continues, the projected target aligns with the measured move from the pattern’s height, indicating a possible decline toward the next major support zone. Traders should monitor volume for confirmation and manage risk accordingly.

Bitcoin send it higher . I think btc will stop around 104k region amd then it will continue to give us another leg higher.It is not over yet , it still has to offer us another upside movememt.
Lets send it higher.

BITCOIN Bullish setupBTCUSD bullish setup
Entry - 113090
Stop Loss - 112717
Target - 114260
Risk Reward - 1:3.14


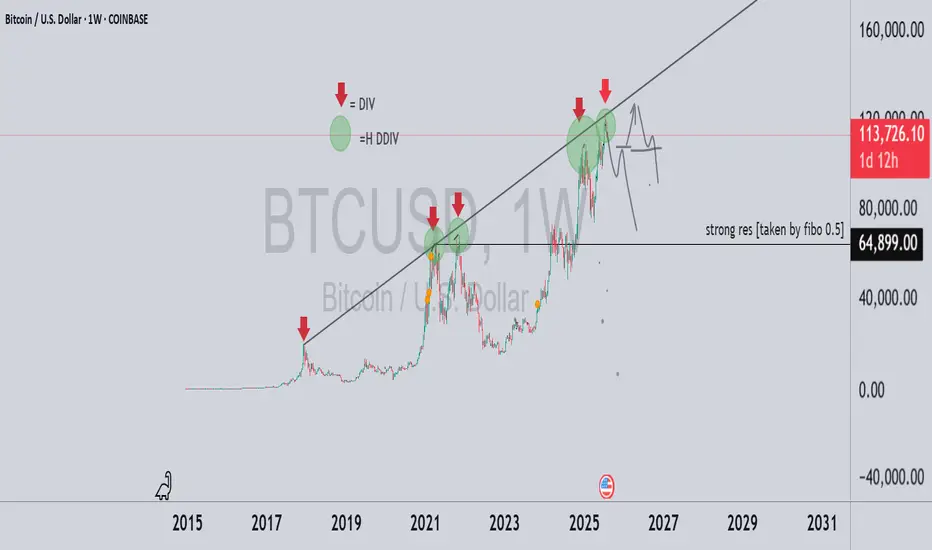
to 65K soon BTC/USD – Historical Cycle Analysis & Mid-Term Outlook (1W)
Exchange: Coinbase
Timeframe: Weekly (1W)
Key Observations:
Long-Term Trendline Resistance
The black ascending trendline has historically acted as a major resistance zone since 2017.
Every touch of this line in the past has been followed by a significant correction.
Bearish Divergences (DIV / HDIV)
Red arrows indicate historical bearish divergences on RSI/MACD.
Each divergence marked a local or macro top before a sharp retracement.
Major Historical Resistance – $64,899
Derived from 0.5 Fibonacci retracement of the primary cycle.
Served as a key ceiling during previous cycles before new all-time highs.
Bitcoin Cycle Behavior
BTC historically forms parabolic tops followed by deep corrections.
The current cycle (2024–2025) mirrors 2017 and 2021 structures, suggesting we may be approaching a macro inflection point.
Mid-Term Scenario
Price near the trendline (~$120K) implies high risk of volatility and correction.
Primary support zone: ~$65K (historical + Fibonacci confluence).
Likely scenario: range-bound movement between $65K–$120K before any sustainable breakout or new parabolic leg.
BTCUSD looking to SellI'm expecting BTC USD to enter into the break of structure and retest zone that is in f4HRS and and then push down from there with a 1:4RR hitting the next point of interest / area of interest

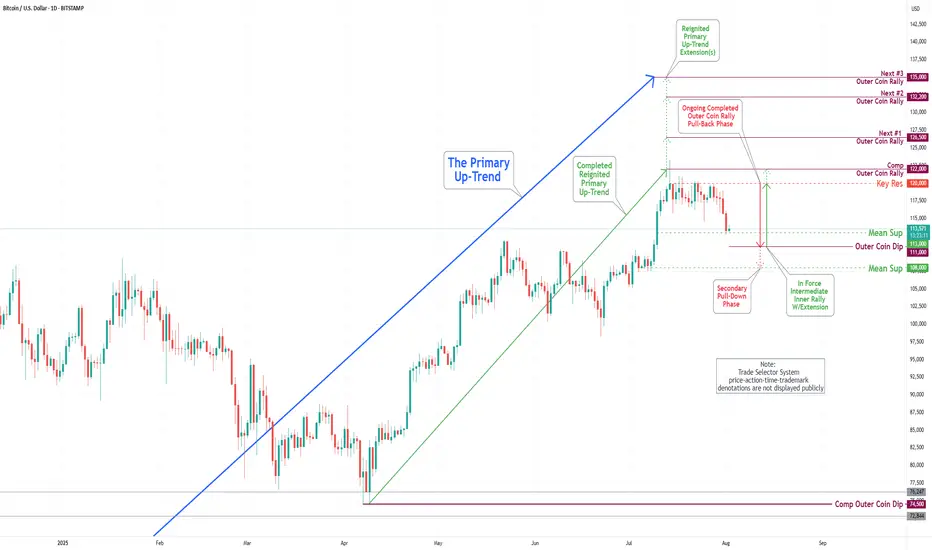
Bitcoin(BTC/USD) Daily Chart Analysis For Week of August 1, 2025Technical Analysis and Outlook:
In this week's trading session, the Bitcoin market experienced a notable pullback. The primary reason for this movement was the Key Resistance level, which led to a decline that reached our Mean Support level of 113000. This anticipated pullback is prompting the completion of the Outer Coin Dip target of 111000, with a strong likelihood of moving towards the Mean Support level of 108000.

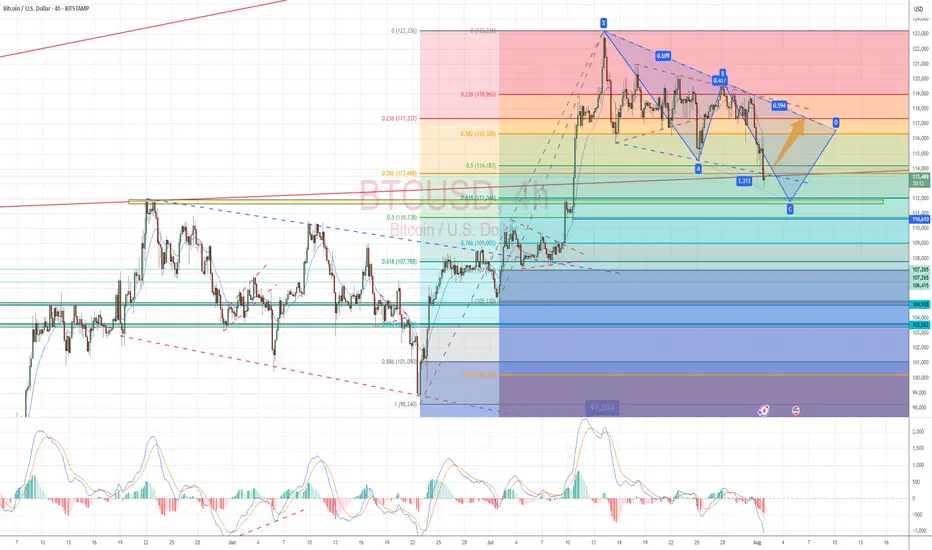
Let's buy BTCUSD on correction!I found interesting opportunity in BTCUSD right now.
It has been moving in consolidation channel after recorded its all time high.
Based on Elliot Wave count, the price right now is making it's wave 4.
The next possible target is 120-125k.
CHEEEERRRSSS..!!!
BTCUSD Technical Analysis (Smart Money Concepts) BTCUSD Technical Analysis (Smart Money Concepts)
Market Structure Overview:
Break of Structure (BOS) observed multiple times confirms a strong bearish trend.
Change of Character (CHoCH) around 30th July indicated initial shift from bullish to bearish intent.
Price has been forming lower highs and lower lows, respecting the bearish structure.
Key Zones:
🔴 Previous Resistance Zone (119,000 - 120,500)
Strong supply area from where price sharply reversed.
Also aligned with a Strong High marked at ~$120,000 – key for any future bullish invalidation.
🟫 Current Target Zone – 116,000
Acts as an immediate imbalance fill/FVG retracement zone.
Target highlighted as potential retracement point before continuing lower.
🟦 Liquidity / Fair Value Gap (FVG) Zone
Located between ~115,800 and 114,500.
Price may aim to revisit this zone on pullback, filling inefficiencies.
🟩 Support Zone (~113,000)
Price currently reacting near this zone.
This area has acted as a demand zone in the past and is expected to provide short-term support.
Volume Profile & Order Flow:
Visible Range Volume Profile shows heavy activity near the resistance cluster, indicating strong distribution by institutional players.
Low volume in the FVG area further confirms inefficiency and potential for a retracement move.
Smart Money Perspective:
The current structure reflects distribution at highs, followed by markdown phase.
Price swept liquidity below local lows and may now seek to mitigate previous supply or FVG around 116,000 before resuming bearish trend.
📌 Conclusion:
Bias: Bearish until 116K is tested and rejected.
Next Move Expectation: Possible liquidity sweep → bounce to 116K → short continuation.
Invalidation Level: Break and close above 117K would signal strength returning.
✅ Educational Note:
This is a classic Smart Money trap setup — liquidity grab near lows, fakeout pump to FVG, and potential short continuation. Traders should be cautious of fake rallies into known supply zones.
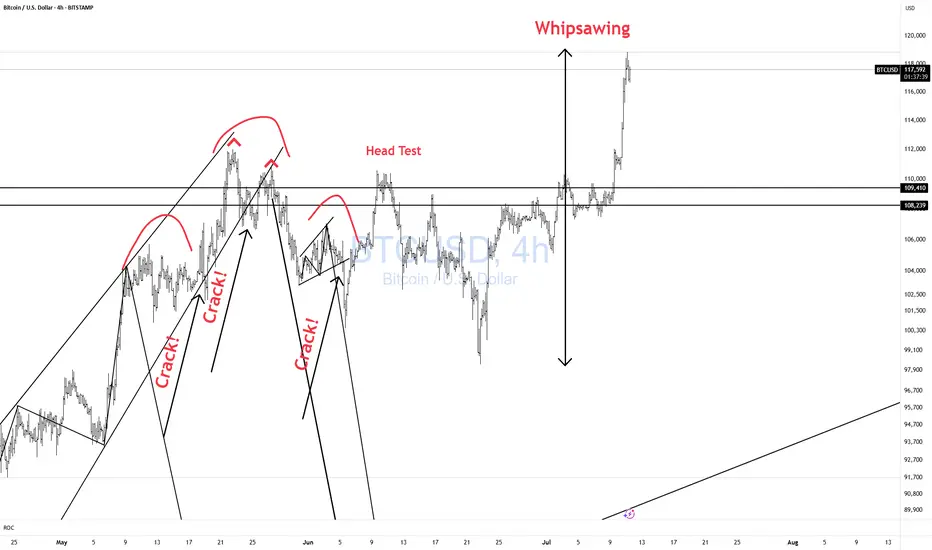
BTCUSD Whipsawing! CAUTION!Bulls CAUTION! Price is whipsawing all over the place.
Better to be out of the market wishing you were in than in wishing you were out!! Don't chase!!
BTC/USD – 4H Short Setup AnalysisBitcoin is currently trading within a defined range under macro resistance. The chart shows price stalling below a key supply zone, with rejection from the upper Keltner Channel and diagonal resistance (yellow trendline). A local bearish divergence appears to be playing out as momentum fades.
📉 Short Position Setup:
Entry: $119,275 (supply retest)
Stop Loss: Above local high / top channel boundary
Targets:
TP1: $117,163 (38.2% Fib)
TP2: $115,858 (61.8% Fib)
TP3: $113,746 (full measured move)
Confluence:
Bearish rejection near multi-touch trendline resistance
Lower high formation after extended consolidation
Heikin Ashi candles showing loss of bullish momentum
Watch for: Breakdown of the white trendline support to confirm momentum shift. Invalidation if BTC closes strongly above $120,000.
Timeframe: 4H | Strategy: Range Reversal + Fib Confluence

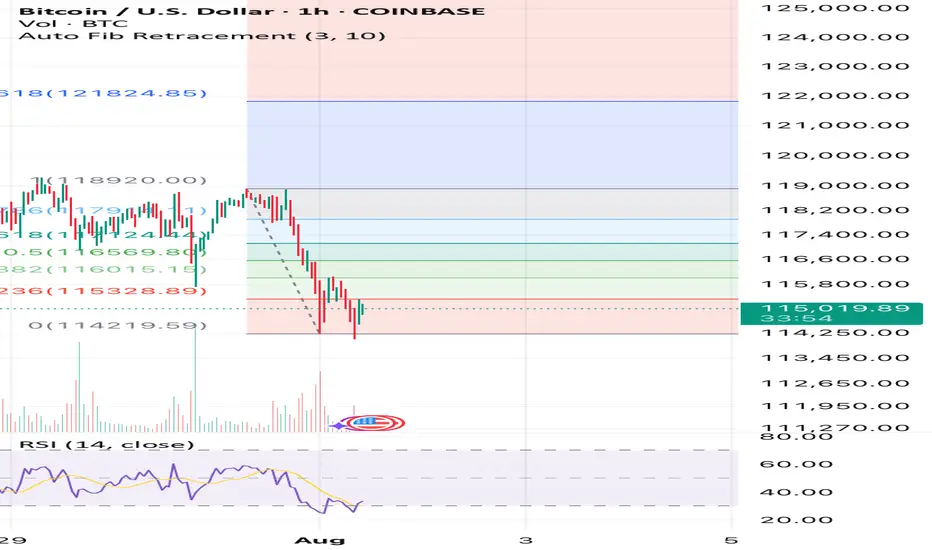
Bitcoin willIt hold if we stay above $115k ?? Fixing up last post I’ve deleted now as image was not good. Anyway simple RSI and Auto Fib Retrace with only general CRYPTOCAP:BTC market understanding backing this. This isn’t finacial advice at all. It’s pure speculation this post and anything related to it. I’m
Not a finacial advisor and I will not be held accountable for anyone’s actions that I didn’t do.
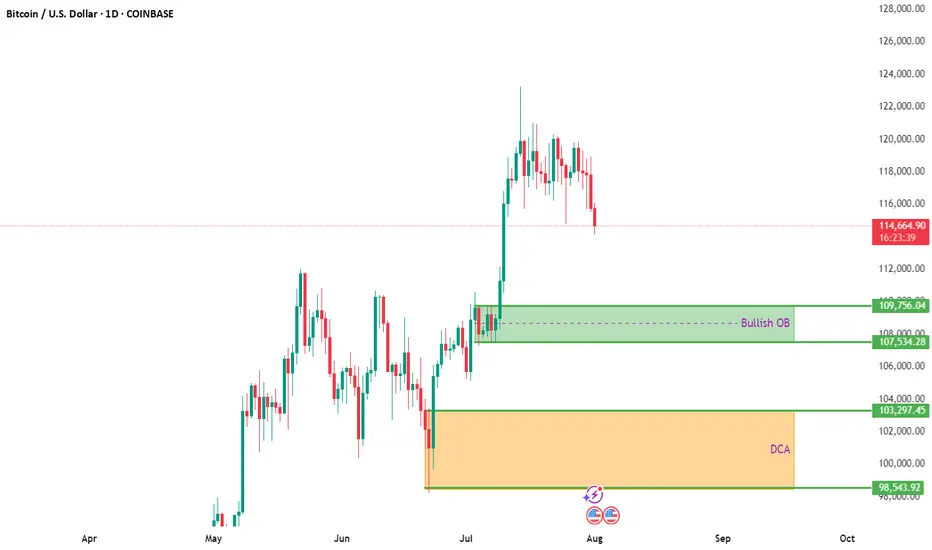
BTCUSD Daily Analysis – Key Entry & DCA ZonesBitcoin is currently pulling back after a strong bullish move, now hovering near $115K. The correction opens a potential window for smart entries based on prior market structure and order block analysis.
🔍 Bullish Order Block (OB):
✅ Zone: $107,534 – $109,756
This area previously served as a breakout zone after consolidation. A retest of this region could act as strong support, making it a prime candidate for short- to mid-term bullish setups.
🟧 DCA Zone (Long-Term Accumulation):
✅ Zone: $98,543 – $103,297
Ideal for long-term investors looking to build exposure gradually. Dollar-cost averaging in this zone allows entry at historically undervalued levels in case of a deeper pullback.
🧠 Trading Insight:
Patience pays. Let price come to your levels rather than chasing. Use alerts and consider scaling into positions with proper risk management.
📌 Chart Context: 1D | COINBASE
📆 August 2025
📈 TA by: @NFX_Solutions
#BTC #Bitcoin #Crypto #BTCUSD #TechnicalAnalysis #OrderBlock #TradingView #CryptoStrategy #DCA #SwingTrade #SupportZone
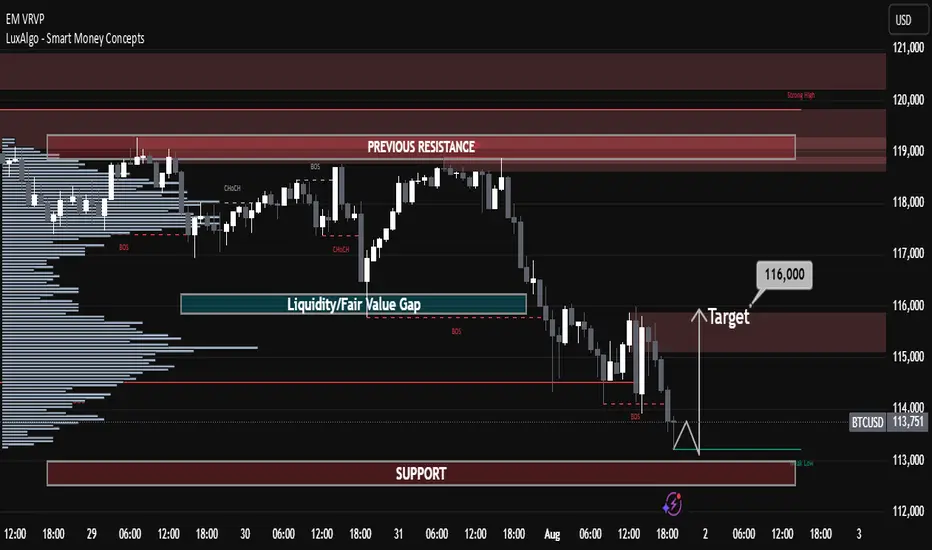
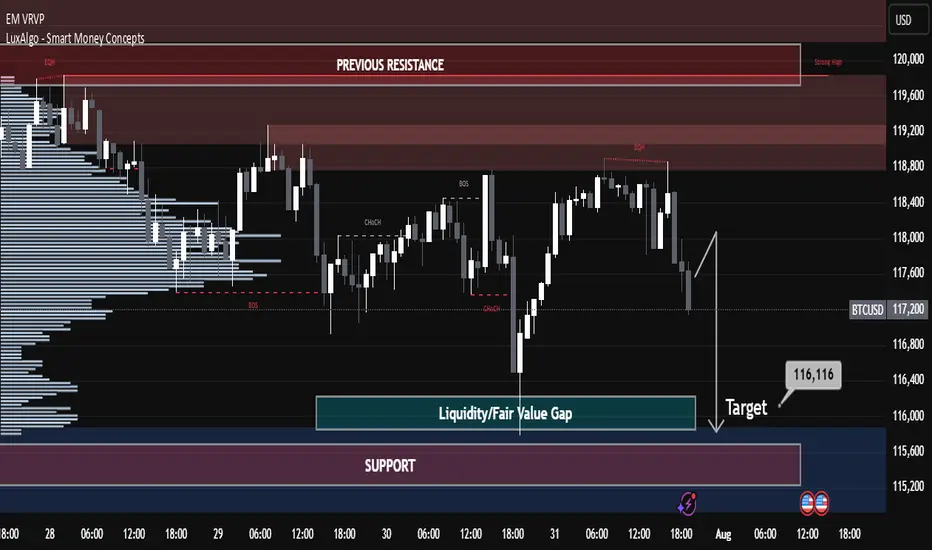
BTCUSD Technical Analysis – Bearish Momentum Towards Fair Value BTCUSD Technical Analysis – Bearish Momentum Towards Fair Value Gap
Bitcoin is showing clear bearish pressure after rejecting from the previous resistance zone around 118,800 – 120,000. The market structure and smart money concepts indicate potential for further downside.
🔍 Key Observations:
Previous Resistance Respected: Price failed to break through the strong resistance zone marked near the 119,200–120,000 level, showing strong institutional selling interest.
Market Structure Breaks:
BOS (Break of Structure) and CHoCH (Change of Character) confirmed bearish shift.
Price has maintained lower highs and lower lows, signaling a bearish trend.
Liquidity/Fair Value Gap Zone: The market is currently targeting the liquidity/FVG zone between 116,400 – 116,100, which aligns with price inefficiency and unfilled orders.
Support Zone Ahead: A strong support zone is visible near 115,600 – 115,200. Expect a potential reaction or consolidation here.
📌 Strategy & Bias:
Short Bias Active until price reaches 116,116 (target).
Watch for possible bullish reversal signs in the support/FVG zone.
Ideal for scalp-to-swing short trades, with tight SL above recent EQH.
📚 Educational Notes:
Fair Value Gaps (FVG) indicate institutional imbalances and are often revisited by price.
CHoCH and BOS are early signals of smart money moves – always monitor them in confluence with volume and zones.
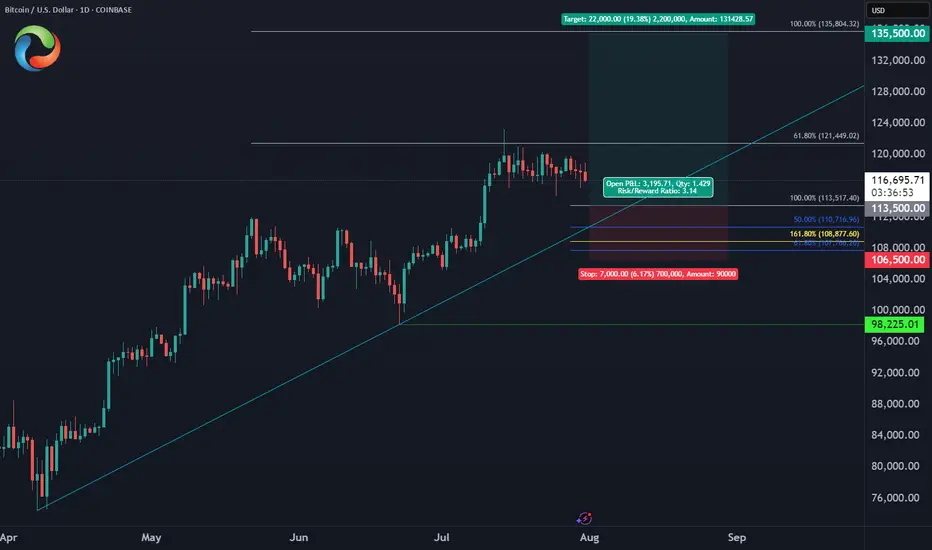
Bitcoin August Trade PlanBINANCE:BTCUSD
✅Entry Zone: $113,500 - $110,700
⛔️Stop: $106,500 (below June low)
🎯Target: $135,500 (ATH liquidity)
🔖Risk/Reward: 1:3
Bart Simpson Pattern Forming? We are in Greed? A possible Bart Simpson pattern is forming, which typically indicates a market top and reversal, with a retest of <$109,000 very likely. This pattern could also create a bearish head and shoulders formation, strongly suggesting a near-term top.
Trading volume continues to decrease, and ETF inflows are now negative, with an increasing volume of BTC on exchanges indicating that sell pressure is mounting. In this situation, a flash crash is also quite likely, so be cautious about where you place your limit sell orders and stop losses..
Both short and long positions are currently low, suggesting there is a lack of direction in the market, whether up or down. This situation often occurs at the end of a bull run. While a push upward is a possibility, based on my analysis, I anticipate that this pattern will break down with an 80:20 probability. However, Bitcoin often challenges expectations and is famously unpredictable. However due to all the media hype and the rolling of capital into Alt coins and the dominance dropping I do believe we are very near the end of the bull run. This is not financial advice (NFA).