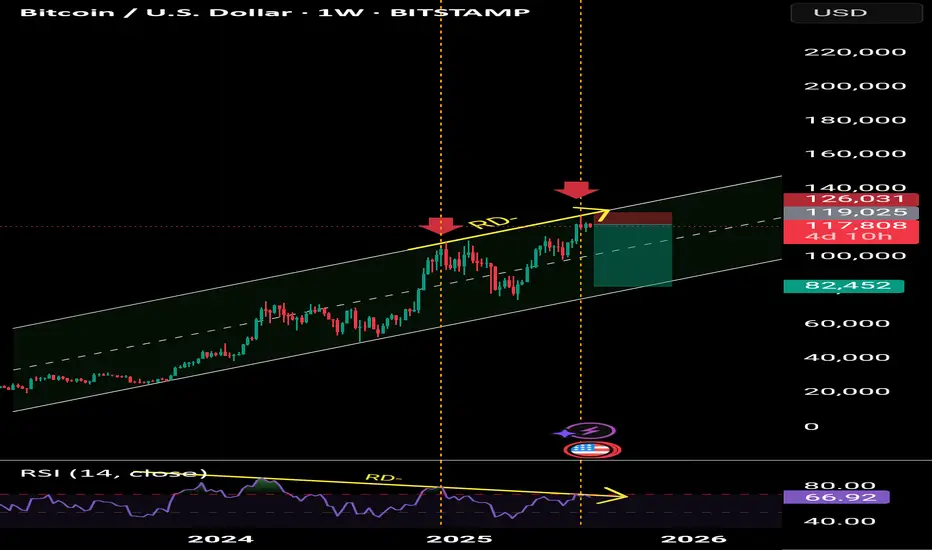
Bitcoin sell short Bitcoin has negative divergence on the weekly timeframe and is suffering. The target is $82,000. It is now the channel ceiling. The market is heavily bearish.
Bitcoin Tp:82000
😘😘😘
BTCETH.P trade ideas
End of the correction and continuation of the drop?Given the recent days of decline, it’s become much harder for Bitcoin to move up. It needs significant volume to break through the resistances ahead, and from a technical perspective, I don’t see that volume. I prefer a bearish scenario for now, as it could offer better short opportunities.
#Bitcoin Sunday Update $BTC bounced from the $112,398 support #Bitcoin Sunday Update
CRYPTOCAP:BTC bounced from the $112,398 support and is now trading above $113,700. If it holds above this level, a push toward $120K is likely. However, if downside continues, next key support sits near $110K — both supports could trigger a rebound toward $120K. Stay alert for range play before breakout.

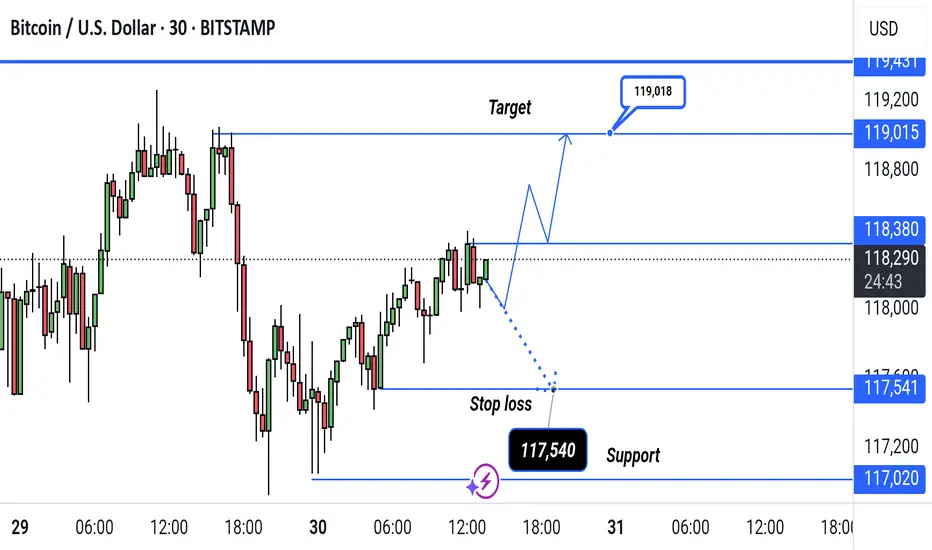
BTC/USD Bullish Breakout Setup – Targeting 119,018BTC/USD 30-Min Chart Setup:
Price is currently at 118,271, approaching resistance at 118,380. A bullish breakout could target 119,018, while a drop below 117,540 (stop loss) may signal downside toward support at 117,020.
bitcoin sell setup.price dropped below previous low and remain down there for a long time, this shows sellers strength and willingness to push down. we expect a sharp move from here

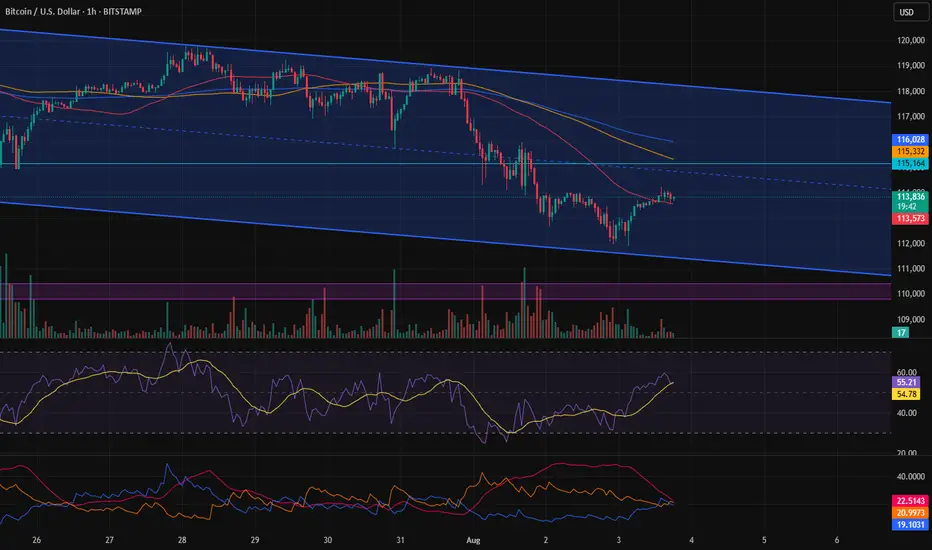
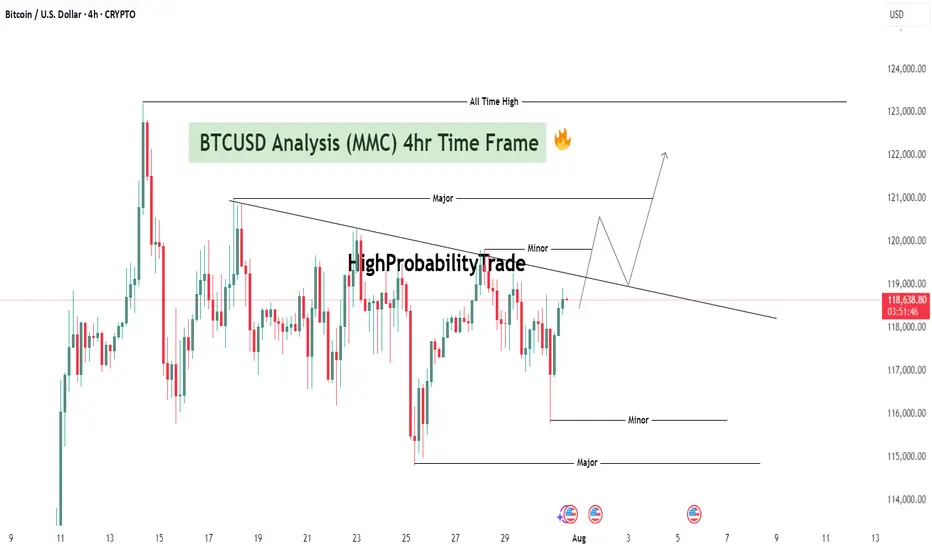
BTCUSD Analysis : Major Breakout Setup | Big Move Loading"Bitcoin Coiling Below Key Resistance – Breakout or Trap?"
🔍 Technical Overview:
Bitcoin is currently trading within a compressed range, sitting just below a key descending trendline that has capped upside movement for multiple sessions. Price is consolidating between minor highs and lows, hinting at a build-up of momentum for the next breakout move.
The setup presents a classic compression inside a bearish wedge, but with increasing bullish pressure evident from higher lows and wick rejections near minor supports.
🧱 Detailed Technical Breakdown:
🔸 1. Descending Trendline Structure
Price has formed a downward sloping resistance line from earlier highs.
This trendline has acted as a dynamic ceiling, rejecting multiple bullish attempts.
Each time price approaches it, the rejection gets weaker, indicating a possible breakout attempt soon.
🔸 2. Multiple Minor & Major Zones
Minor Resistance: Around $118,800–$119,200
A short-term ceiling that has paused bullish rallies.
Price needs a clean break and close above this to initiate momentum.
Major Resistance: ~$121,000–$121,200
This zone aligns with a previous significant swing high.
A break above here could result in strong bullish continuation toward ATH levels.
Minor Support: ~$117,000
Price has repeatedly bounced from this level.
A breakdown would indicate fading bullish strength and open the downside.
Major Support: ~$115,000
A historically strong demand zone.
If BTC fails all bullish attempts, this would be the final defense for buyers.
🧠 Market Psychology Insight:
Price is trapped between aggressive short-term sellers and accumulating buyers.
Buyers are placing confidence in this area by defending higher lows.
Sellers are still protecting the trendline, but with each retest, the defense weakens.
This is a classic equilibrium zone where liquidity is building—once imbalance hits, a strong impulsive breakout (either direction) is likely.
Volume and momentum should be watched closely as a breakout with confirmation may trap the opposite side, leading to a strong move (short squeeze or long liquidation).
🔮 Scenario Forecasts:
📈 Bullish Breakout Scenario:
Price breaks above $119,200 → minor resistance flips to support
Retest of the broken trendline confirms a bullish breakout
Price targets:
First Target: $121,000–$121,200 (major resistance)
Second Target: $122,500+
Third Target: $123,800–$124,000 (All-Time High)
Confirmation Needed: 4H candle close above descending trendline and $119,200 with rising volume.
📉 Bearish Rejection Scenario:
Price gets rejected from the trendline or minor resistance zone
Breaks below $117,000 minor support
Possible targets:
First Target: $116,000 (reaction zone)
Second Target: $115,000 (major support)
A fall below $115,000 could invalidate the bullish buildup and invite strong bearish continuation.
This would signal that bulls failed to reclaim control, and sellers maintain market structure dominance.
📌 Key Levels Summary:
Type Price Range Significance
🔺 All-Time High $123,800–124,000 Final upside target
🔸 Major Resistance $121,000–121,200 Key breakout level
🔹 Minor Resistance $118,800–119,200 Immediate trendline + local supply
🔹 Minor Support ~$117,000 Local demand base
🔻 Major Support $115,000 Last line of defense for bulls
🧭 Conclusion & Strategy:
Bitcoin is approaching a make-or-break zone under a significant descending trendline. Price compression is tightening, and a breakout looks imminent.
Traders should stay patient and wait for confirmation—either a breakout and successful retest for longs or a rejection and trendline defense for shorting opportunities.
Whether it’s a breakout toward $121K and ATH, or a drop toward $115K support, this setup offers a high-probability trade opportunity for both bulls and bears depending on the confirmation.
Bitcoin buy setupHi everyone.
I think this area has a good potential to set an order and take at least 1% profit out of it..
Let's see how it reacts to this level...
Please consider the risk management.
Goodluck

Inflection Zone, Do or Die levelI've drawn up a couple of major pivot points that I expect BITSTAMP:BTCUSD to consolidate at before continuing either up or down.
The market is in my opinion currently feeling a little bit confused and not quite fearful yet but a little bit doubtful anyway. The melt up has been real, and for some painful, as directional movement is at most only half of what matters. So this injection of volatility is welcomed at least by me, and I've been fairly exposed to growth stocks in my port lately.
Based on fibonacci phi channels and other confluences of support locations, it looks like we've turned a corner and are on the way down, but I'd be surprised if we breached 107k and as shown, if that did happen, there is a LOT of underlying supply.
I don't know where we go from here but I wanted to point out this level highlighted in light blue, as its historically been a major line in the sand for BTC.


BTC at Make-or-Break: Rejection or Liftoff to $130K?
Bias/Summary
BTC is at a critical zone between 109K–112K. Price is currently showing hesitation after initial rejection at the Yearly L3 (112K), and I’m leaning short unless we see a strong breakout and hold above that level. However, if bulls reclaim it, we could see a fast move to 130K before many can react.
Technical Context:
Yearly L3 sits around the $112K zone – a historically significant level.
Price faced rejection at $112K and is now hovering near $109K.
Lower timeframe showing indecision, possible bearish bias.
Watching for:
Rejection + lower high below $112K = short setup.
Clean breakout + retest of $112K = shift to long bias.
Trade Idea / Setup:
🟥 Scenario A – Short Bias (Current Leaning):
Entry: 110K–111.5K (if rejection confirms)
Stop Loss: Above 112.5K
Targets:
TP1: 104K
TP2: 99K
TP3: 94K
R:R: Up to 3.5:1 depending on entry and target
🟩 Scenario B – Breakout Long (Contingent Setup):
Entry: 113K+ (after breakout and solid retest)
Stop Loss: Below 111K
Targets:
TP1: 120K
TP2: 130K
R:R: ~3:1 or more if momentum confirms
Risk & Patience Reminder:
⚠️Let price lead. No breakout = no long. No clear rejection = no short. Wait for confirmation, and don’t force entries in the chop.
Patience > Prediction.
NFA. DYOR. Manage your risk.

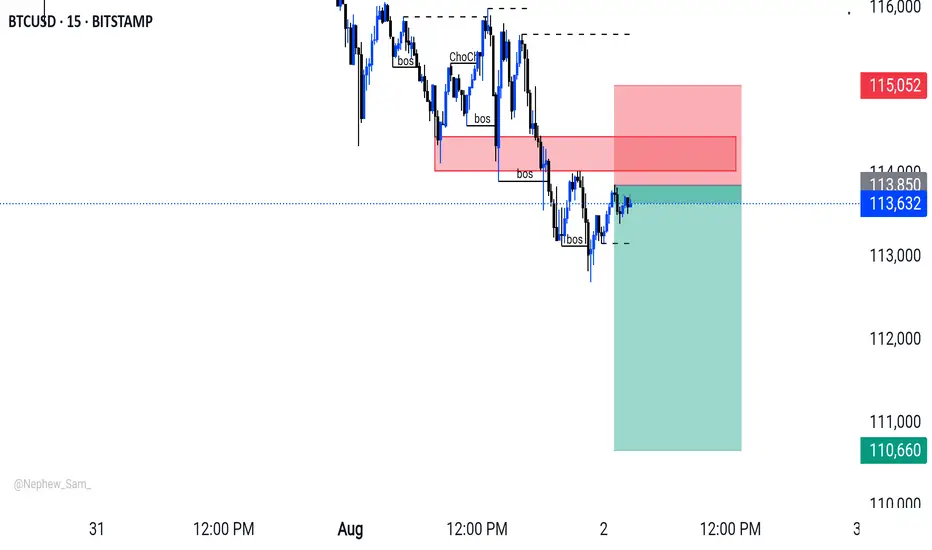
BITCOIN 15-Min Chart – Key Support Retest with Bullish PotentialThis 15-minute BTCUSD chart shows Bitcoin retesting a strong support zone near $112,680 after a clear downward move. The price is currently reacting at a previous demand area, marked in blue, just above the session’s LOW. A possible bullish reversal setup is forming if the support holds, targeting the previous HIGH around $114,000 and a potential TP at $114,200. Traders may look for confirmation signals (e.g., bullish engulfing, order block reaction) before entering long positions.

Bitcoin Long: Completion of wave 4 (5-wave instead of 3-wave)In this video, I updated the wave counts for Bitcoin, primarily the change is in wave 4 where I believed that it has formed in 5-waves instead of 3-waves.
Because of the new low, both our stop loss and take profit are now lowered:
SL: $113,858.
TP: $124,000
Good luck!

BTCUSD - Follow Up AnalysisTaking a look at the daily chart, price action did come down as previously expected in my last article.
Now we're heading into an area of strong support and I expect to see some sideways action until something significant happens next.
How I'm trading this price action?
I believe price action may continue to bounce around from the current price of 113,600 down to 110,000 for at least the next few days. With that said I'm implementing my range trading strategy. The range trading strategy also known as the Bitcoin Scalper scalps on the 1 and 5min timeframe creating sort of like a grid style approach but it's based on candlestick momentum. Since it trades off momentum, it's able to detect breakouts and know when to switch from the ranging strategy to the breakout strategy.

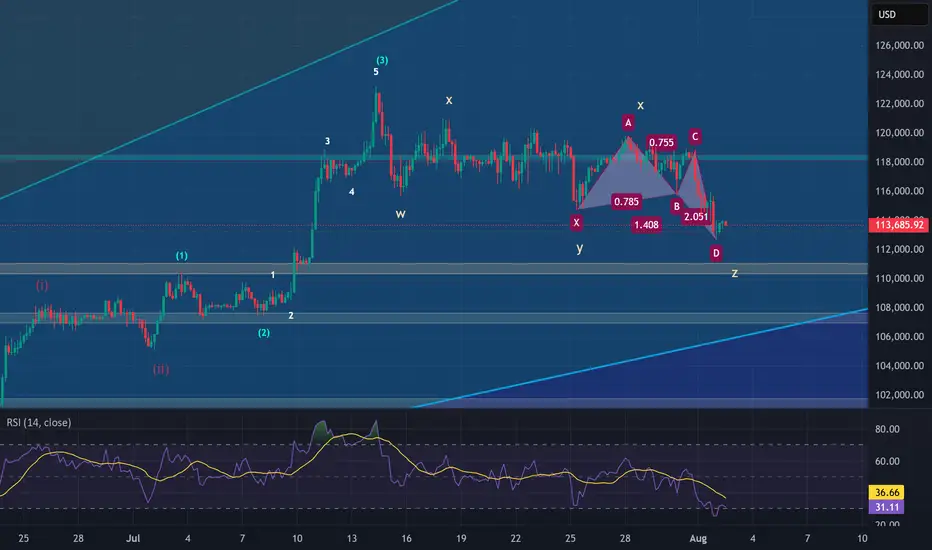
The End of BTC correction? BTC analysis 2/8/2025In my point of view, BTC has completed its correction and is now ready for a strong upward move, potentially targeting the $137,000–$139,000 range, based on the following factors:
1. Confirmation of the Butterfly Harmonic Pattern
The recent reversal occurred within the expected range of the Butterfly harmonic pattern. Typically, the XD leg in a Butterfly harmonic extends to 1.27, but in practice, this can stretch up to 1.414, which is commonly used as a flexible stop-loss zone. After testing the 1.27–1.414 range, a clear 5-wave impulse followed—testing a key trendline and making an attempt to break above the recent high. This sequence, followed by a corrective move, suggests that the broader correction may be complete.
2. Complex WXYXZ Correction Structure
In my previous analysis, I underestimated the duration and depth of the correction. The wave (4) (blue), which is part of the wave (iii), has taken considerable time—likely to allow wave (5) to extend sufficiently to break above the $130,000 level. This would support the assumption that wave (5) (purple) is the extended wave. The overall corrective structure appears highly complex, and can be counted as a W–X–Y–X–Z pattern, supported by the presence of multiple internal corrections within the wave components.
3. 0.618 Fibonacci Retracement of Wave (3)
Wave (4) has now reached the 0.618 Fibonacci retracement level of wave (3), which is significant. Historically, BTC’s corrections rarely retrace beyond the 0.87 level. This deep retracement suggests wave (4) is likely complete—unless price were to fall below that threshold, which would invalidate this assumption.
Btcusd We are expecting a retracment back to the zone then a reversal candle stick on de zone then we sell

Bitcoin Are We Heading to 140K or 80K ??? Here is the Analysis Based on what is happening here is what we currently see with Bitcoin
Idea 1: If we can break 119K then here are the following levels Bitcoin can go to :
122K
126K
135K
140K
Idea 2: If we continue and break further bearish here are the levels BTC can go to
115,600
114,500
112,800
If we go below this level then a larger correction thesis would point us with a deeper bearish level
Happy Trading
Trade Smarter Live Better
Mindbloome Exchange
Kris

Bitcoin – Time to Book Profits?📉 Bitcoin – Time to Book Profits? 📈
Bitcoin (BTCUSD) has had a phenomenal run! On Nov 22, 2022, it bottomed out at around $15,500 — and then, on July 14, 2025, it smashed records by hitting an all-time high of $123,000! 💥
That’s a jaw-dropping gain of approximately 693% in just under 3 years! 🤑📊
🚨 But all that glitters isn't gold...
📉 Technical outlook based on Elliott Wave Theory suggests we might be in either:
An extended Wave 4 correction, or
A fizzling Wave 5 move that’s losing steam.
🔍 Adding to this concern:
Volume is below average – a classic warning sign 🚨
Price action shows weakening momentum
No strong buying confirmation near the highs
👉 The pattern now resembles a potential distribution phase, not a fresh breakout. That means: The smart money might already be booking profits.
💡 What should investors do?
If you’ve ridden the wave up — consider taking some money off the table. This could be a good time to lock in gains and wait for a better re-entry opportunity. Remember, discipline beats excitement in trading.
📛 Caution is advised — especially for late entrants who might get caught in a correction or a prolonged sideways phase.

BTC #This 15-minute chart of Bitcoin/USD shows a symmetrical triThis 15-minute chart of Bitcoin/USD shows a symmetrical triangle breakout pattern. Price recently broke above the upper red trendline resistance, suggesting bullish momentum.
Key highlights:
Breakout candle is strong and closes above the resistance zone (~$119,000).
Next potential target is near the upper grey supply zone (~$119,500), based on the triangle’s height.
Support zones below are marked around $118,400 and $118,000.
This breakout indicates a possible continuation to the upside, provided the breakout holds. Watch for retests and volume confirmation.

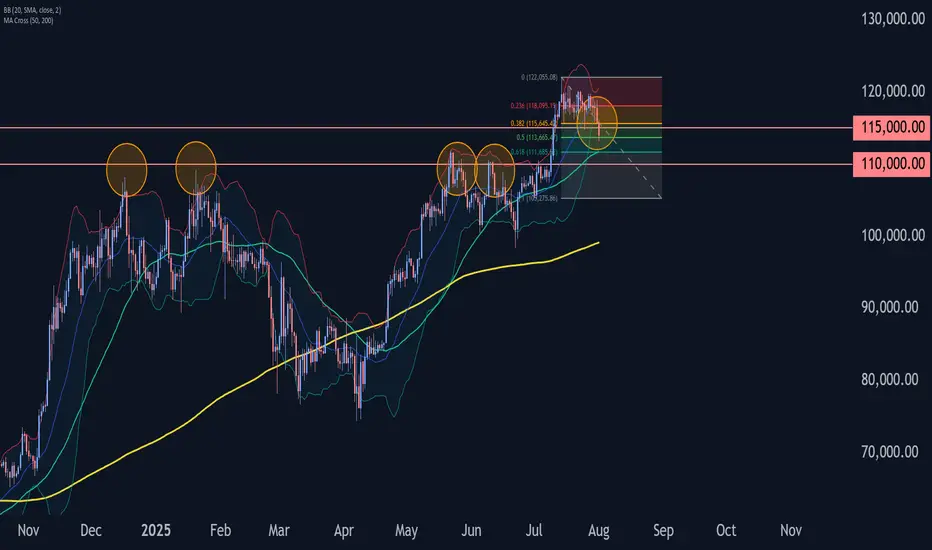
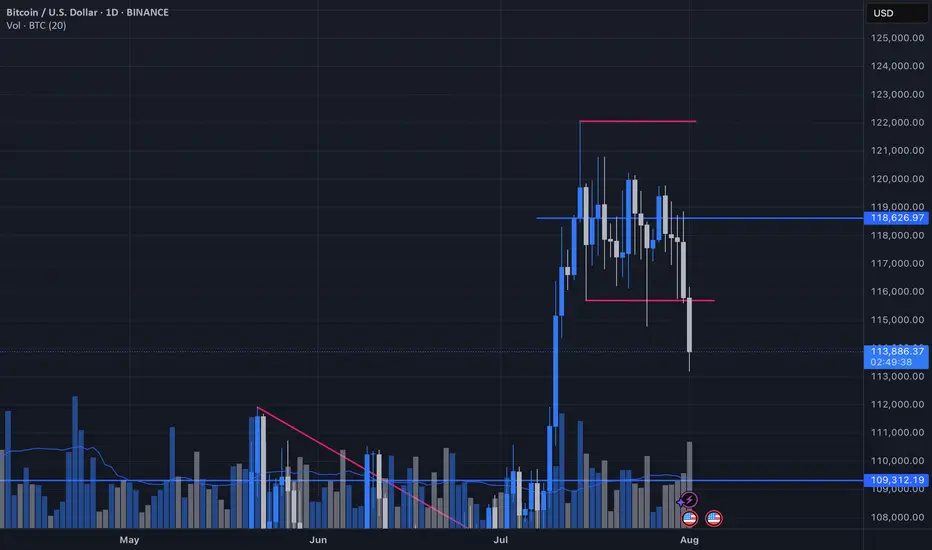
Bitcoin Wave Analysis – 1 August 2025- Bitcoin broke the pivotal support level 115000.00
- Likely to fall to support level 110000.00
Bitcoin cryptocurrency recently broke below the pivotal support level 115000.00, coinciding with the 50% Fibonacci correction of the sharp upward impulse from the start of July.
The breakout of the support level 115000.00 strengthened the bearish pressure on Bitcoin.
Given the bearish sentiment seen across the cryptocurrency markets today, Bitcoin can be expected to fall to the next support level at 110000.00 (former resistance from May and June).
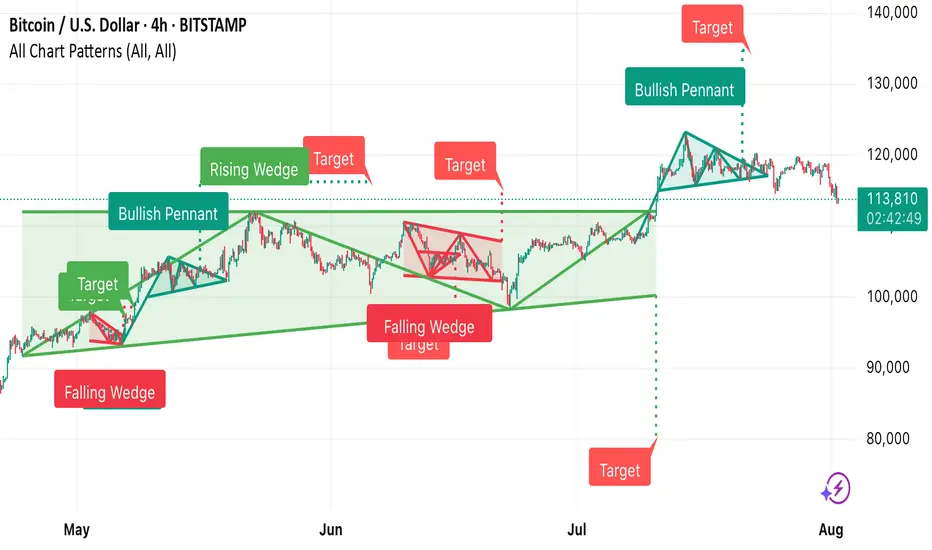
This Bitcoin 4-hour chart from TradingView shows multiple techni • Falling Wedge (early May) → Bullish breakout, target achieved.
• Bullish Pennant → Strong upward continuation.
• Rising Wedge (June) → Bearish breakdown, target met.
• Falling Wedge (mid-June) → Bullish breakout, target achieved.
• Bullish Pennant (late July) → Upward move toward the 140,000 target zone.
Currently, BTC is trading around 113,829, below recent highs, and near the dotted horizontal support zone from the last breakout.
Bitcoin Range Broken?Most likely this range is broken and everybody is right, we chop around/head down... However the daily has not closed so I wonder, what would you do if three hours from now this closes above the $115,700 area?
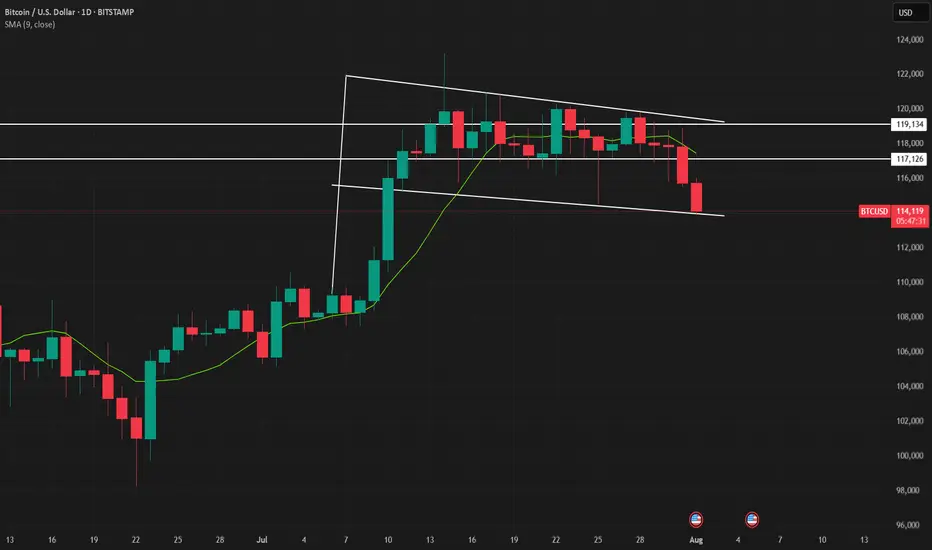
Bitcoin Bull Flag - will it collapse?Bitcoin is currently in a bull flag.
Will it hold — or collapse?
The weekly close will decide.
🔹 If BTC closes above the bull flag support: Possible continuation of the rally.
🔻 If BTC closes below the flag: Expect a deeper correction.
Stay sharp. The weekly close is key IMO.
No FA. DYOR! For educational purpose only.