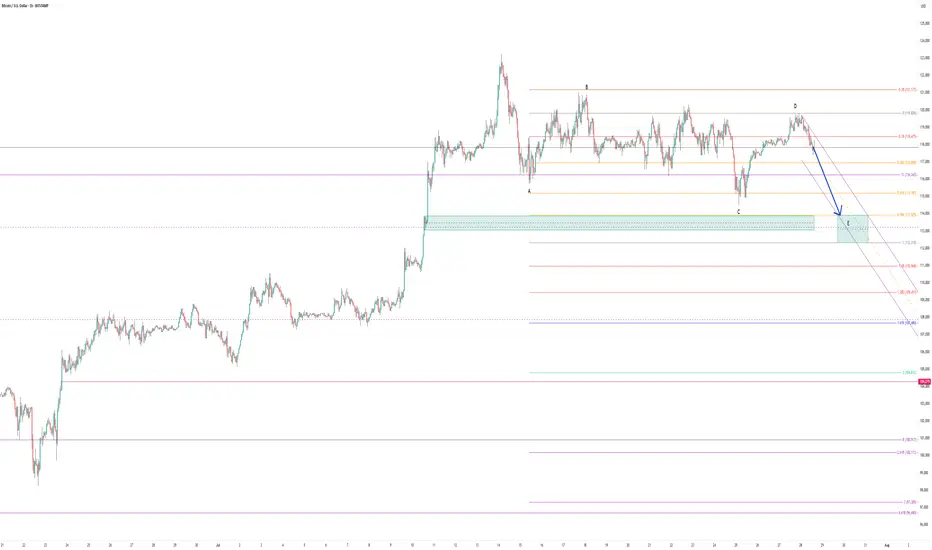
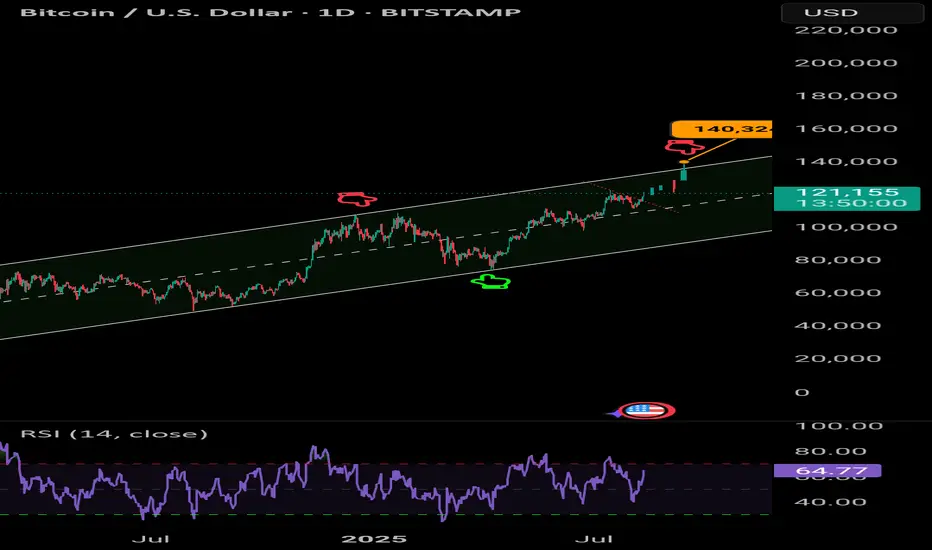
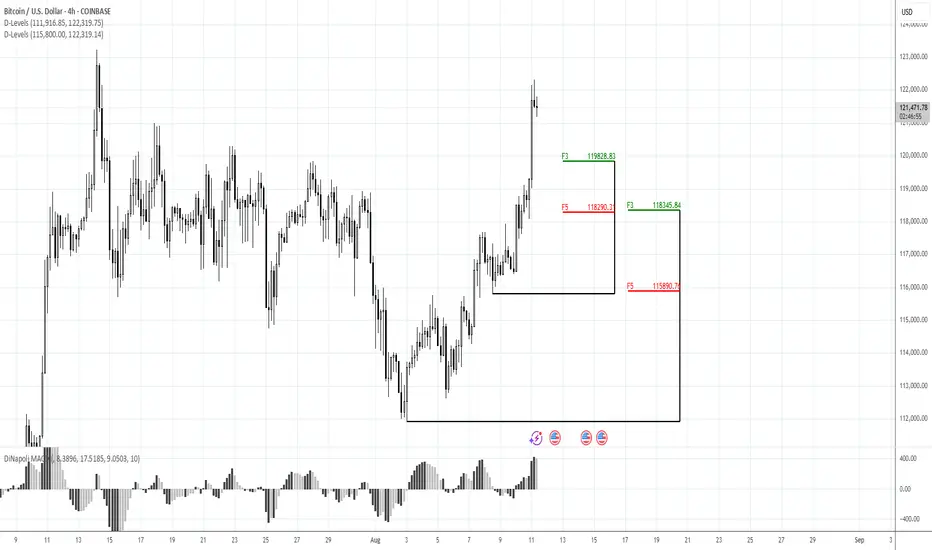
BTCUSD lower toward <113,000-ishI think we are in an Elliotwave A-B-C-D-E pattern, whereas E is delevoping. Price target toward $112,319 - $113,925
From a daily perspective, we can go as lower towards the $95k's...but let see where the next few days takes us.
I'm wrong is we break/close $119,826
BTCETH.P trade ideas
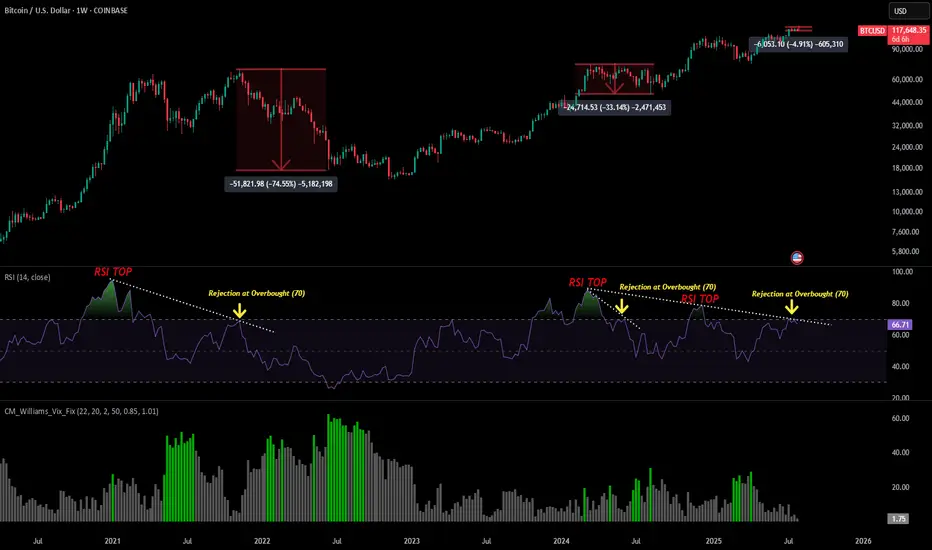
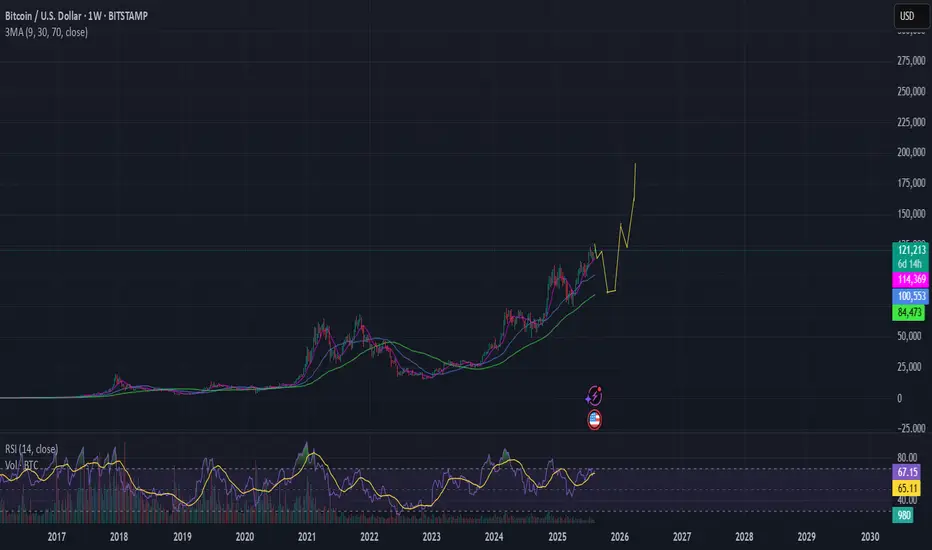
BTC - Weekly Warning SignsAfter seeing a 5% correction from our recent BTC ATH of $123k we are starting to see a few warning signs as momentum starts to decline.
Looking only at our RSI and price I have outline the last 3 time we have seen something similar since 2021. Without going into too much detail normally what we see is an RSI TOP followed by a retest + rejection right at the 70 level (overbought conditions).
We saw it at our market cycle high in 2021 that started the bear market (75% correction).
We saw it at our March 2024 high that started a mid cycle correction (33% correction).
And we are seeing it now after our recent 2025 ATH that has started a very mild correction so far (5%).
This does not mean it is the end of the world but absolutely something market participants need to be paying attention to as this is a make or break signal;.
If we see momentum continue to decline it could lead to our bull market structure being broken and lead us into a bear market that we have historically seen going into the new year.
However this correction can easily be negated to produce a strong bull market continuation move. All we need to see is bulls start to push our strength back above the 70 level (overbought conditions) and we can see the next leg of the bull market really kick off (WITH A CLOSE ABOVE).
For now pay attention to the weekly RSI as of the time of this post our strength has been declining from where we have seen previous tops align with.
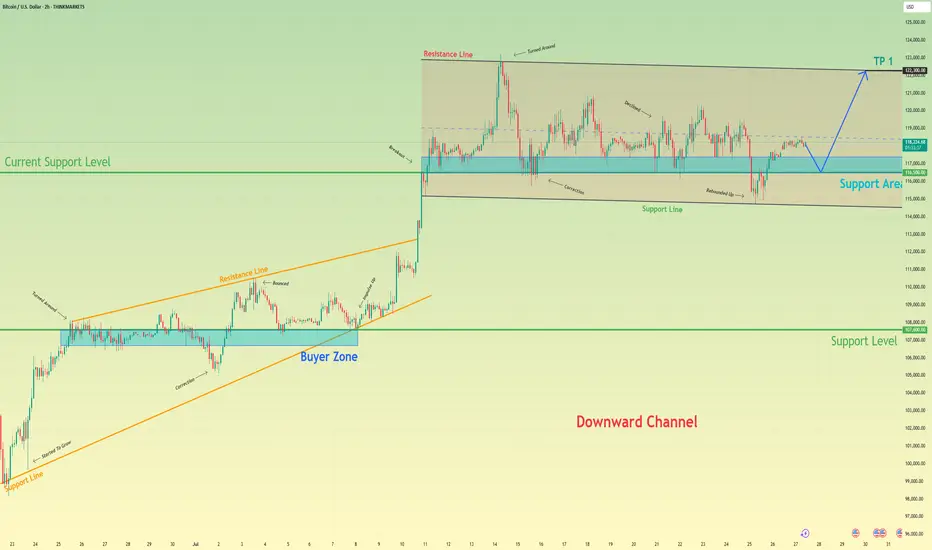
Bitcoin will rebound up from support area to resistance lineHello traders, I want share with you my opinion about Bitcoin. After a strong upward trend that originated from the buyer zone and evolved through an upward wedge, bitcoin executed a decisive breakout, shifting the market into a new, higher-value market phase. This powerful move has since led to an extended period of wide consolidation within a well-defined horizontal channel, a classic sign of the market pausing to absorb the prior impulse and build cause for its next major leg. Currently, the asset's price action is rotating within this structure, defined by a key support area around 116500 and an upper resistance line. Having been rejected from the top, the price is now completing another downward correction and is approaching the channel's foundational support for a crucial test. The primary working hypothesis is a long scenario, predicated on the proven resilience of this support level. A confirmed upward rebound from this 116500 zone would signal that the accumulation within the channel is continuing and likely to resolve upwards. Therefore, the tp is logically and strategically placed at 122300, as this level not only coincides perfectly with the channel's upper resistance line but also represents the completion of the internal rotation, setting the stage for a potential continuation of the larger uptrend. Please share this idea with your friends and click Boost 🚀
Disclaimer: As part of ThinkMarkets’ Influencer Program, I am sponsored to share and publish their charts in my analysis.
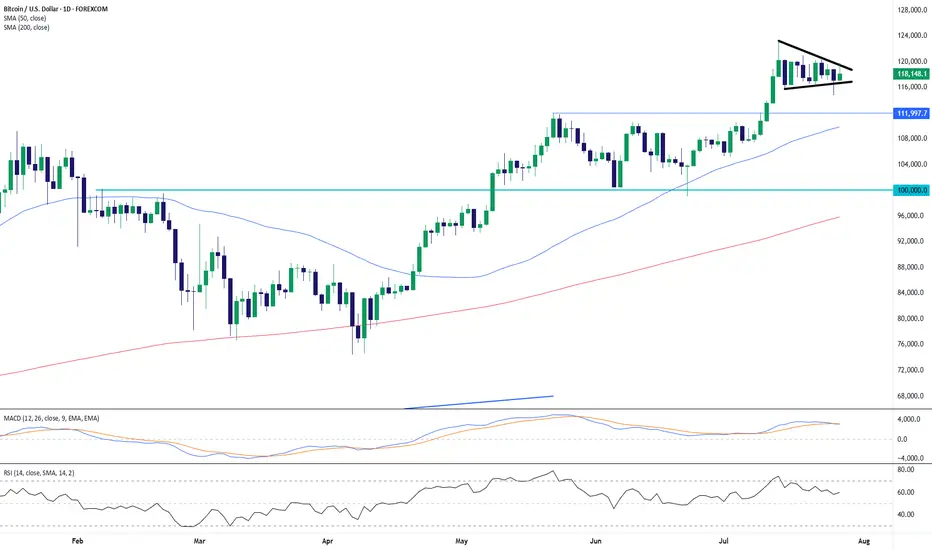
BTC/USD: Bullish Pennant Holds Above Breakout ZoneBitcoin is consolidating within a bullish pennant pattern just below the 120,000 level, following a sharp rally from the June lows. Price action has compressed between converging trendlines, forming higher lows and lower highs — a classic continuation formation in an uptrend.
Importantly, BTC remains well above prior resistance (now support) at 112,000, with both the 50-day SMA (109,837) and 200-day SMA (95,838) trending upward. This suggests strong medium- to long-term bullish structure.
Momentum indicators support the case for continuation:
MACD remains in positive territory, albeit with a slight bearish crossover, hinting at near-term indecision.
RSI is holding around 59.6, just below overbought, reflecting consolidation rather than distribution.
A breakout above the pennant resistance and psychological 120,000 barrier would likely trigger renewed bullish momentum, targeting fresh highs. Conversely, a breakdown below 116,000 could expose 112,000 as a key retest zone.
Bias: Bullish continuation favored while above 112,000. Watch for breakout confirmation from the pennant.
-MW
Very important Economic Calendar 28.07–01.08: FOMC, BTC, tariffsThis Week (July 28 – August 1) — the final week of the month is packed with key events.
Save this post and forward it to 3 friends 😉
📋 High volatility ahead — as the Fed’s key "threelemma" (inflation, labor market, tariffs) comes into focus.
Several important macro releases are scheduled — each one matters on its own, but combined, they can move markets sharply.
🗓 Monday (July 28)
▪️ 12:30 UTC – QRA (Part 1): upcoming US Treasury borrowing needs
▪️ 16:00 UTC – 2Y & 5Y bond auctions – key indicator of market expectations ahead of FOMC
🔗 Strong demand = stronger rate cut expectations
🗓 Tuesday (July 29)
▪️ 12:30 UTC – US GDP (Q2 estimate)
▪️ 16:00 UTC – 7Y bond auction
🗓 Wednesday (July 30)
▪️ 12:15 UTC – ADP employment report – early signal ahead of NFP
▪️ 12:30 UTC – QRA (Part 2): breakdown of Treasury borrowing
▪️ 18:00 UTC – FOMC rate decision (no change expected – 4.5%) + Powell’s press conference
🗓 Thursday (July 31)
▪️ 12:30 UTC – PCE inflation (June) – Fed’s favorite inflation gauge
🗓 Friday (August 1)
▪️ 12:30 UTC – Nonfarm Payrolls (employment)
▪️ 13:00 UTC – ISM Manufacturing Index (July)
▪️ 13:00 UTC – Univ. of Michigan Consumer Sentiment Index
▪️ All day – July auto sales data
🚨 LIBERATION DAY 2.0
Potentially the most impactful event of the week: the Trump administration will begin sending “tariff letters” to ~200 countries.
This marks the end of the temporary tariff relief (April 8 – August 1).
Markets expect a new wave of global trade tension — timing is still uncertain.
💡 Summary:
Every day brings a new potential driver.
Markets are nervous and highly reactive — sharp moves are likely...
CRYPTOCAP:BTC is currently being held above $117K, but Wednesday and Friday bring high risk of "news bombs".

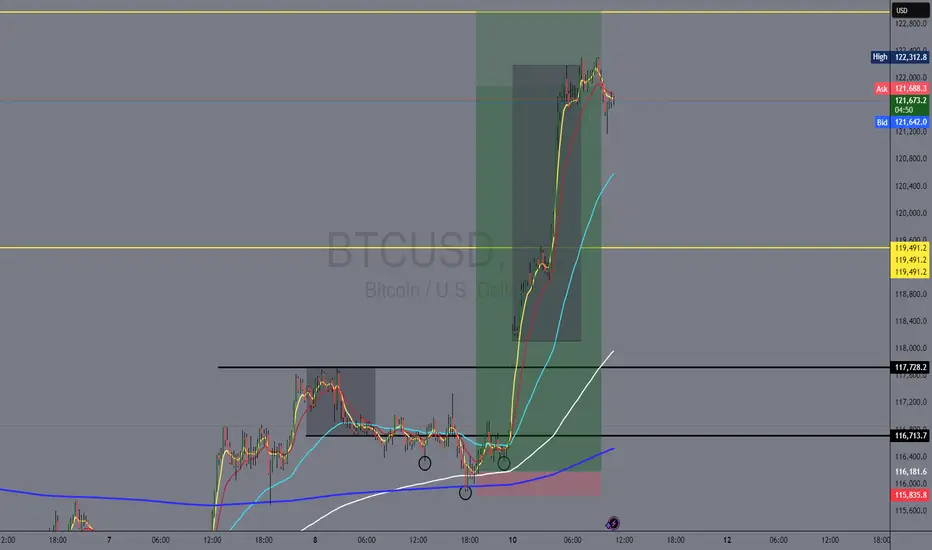
BTCUSD +$500 in the next few candles/sessionsBitcoin (BTCUSD) is showing strong bullish momentum, and current price action indicates a potential move upward by the next $500 in the short term.
BTCUSD TO THE LAST PUSHWe are looking to finish the last push to the upside for the completed circle.

Realized Price / 200 SMAThe realized price has crossed above the 200 SMA. The last time that this happened was November 2020. BTC then went on a tear in the following 90 days gaining 212%. Even if BTC gains only 50% of that 212% this time we will see the BTC price hit 250k.
We aren't bullish enough.

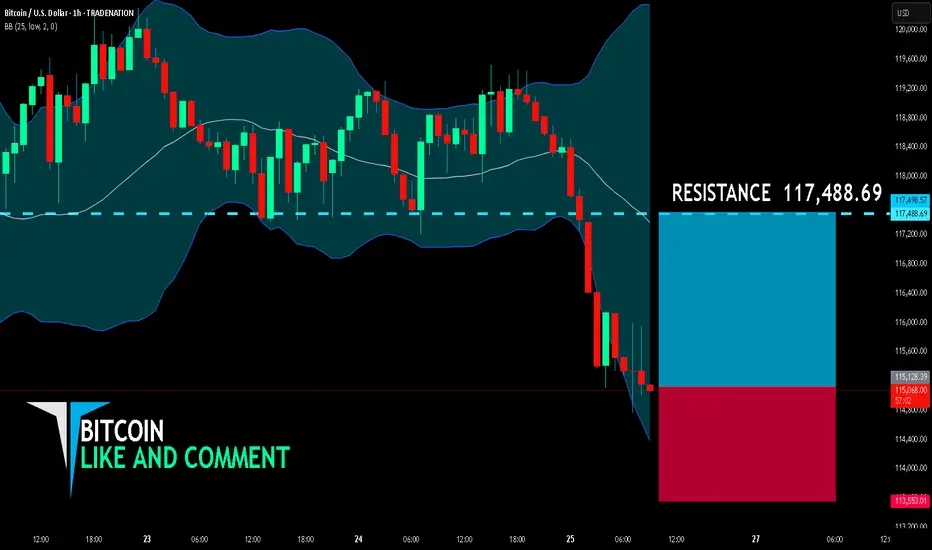
BITCOIN BULLS ARE GAINING STRENGTH|LONG
BITCOIN SIGNAL
Trade Direction: long
Entry Level: 115,128.39
Target Level: 117,488.69
Stop Loss: 113,553.01
RISK PROFILE
Risk level: medium
Suggested risk: 1%
Timeframe: 1h
Disclosure: I am part of Trade Nation's Influencer program and receive a monthly fee for using their TradingView charts in my analysis.
✅LIKE AND COMMENT MY IDEAS✅
BTC is heading to $130k+After 4 weeks of consolidation and strong liquidity grab from the weekly support BTCUSD started to rise to the upside with a bullish trend continuation showing possible upside bias. As 4h bull flag has broken the support and price started to trend, we may see this instrument reaching to $130k+?
A possible bullish trade is high probable!!

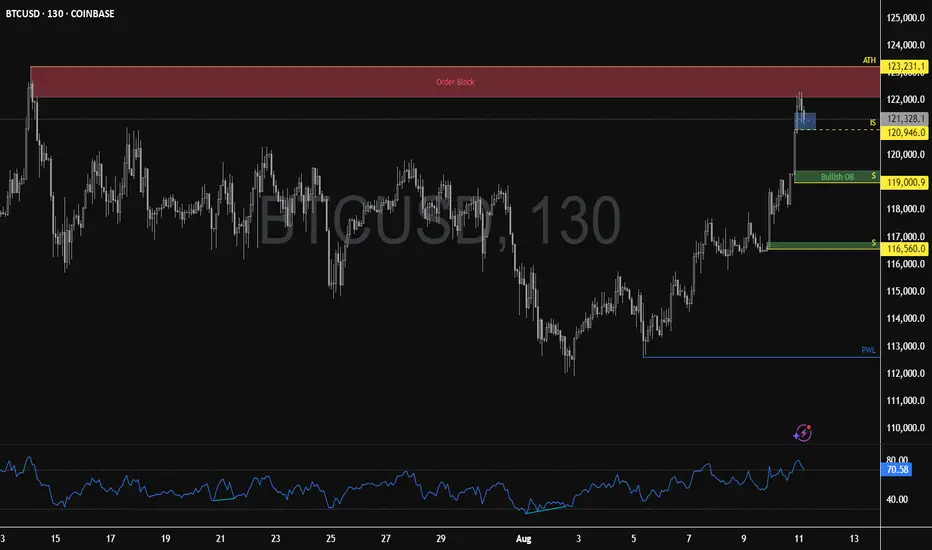
Bitcoin Pulls Back After Testing Bearish BlockFenzoFx—Bitcoin hit the bearish order block and pulled back as expected. RSI 14 dropped below the overbought zone to, signaling increased selling pressure.
Immediate support lies at $120,946. A close below this level could extend the downtrend, targeting the bullish order block at $119,000.00. No bullish setup is expected until price consolidates near discount levels at $119,000.00 and $116,560.00.
Bitcoin 140k The bit is in an ascending channel and is ready to launch to the ceiling of the channel, the range is 140,000.
a long term outlooknobody can deny we are in a macro cycle.
this fractal is from the 2019 run which was cut short due to covid
BTC perfectly hits $120K, latest BTC analysis and operations#BTCUSD
After nearly a week of volatile consolidation, BTC once again touched around 120,000. I have already made it clear to everyone before that once BTC stabilizes above 116,500, it may first touch 118,000 and then challenge the macro resistance level of 120,000. I think anyone who had carefully reviewed the strategy and thought seriously about the ideas behind it would have made substantial profits. Currently, BTC maintains an overall upward trend, but may face the risk of an overbought pullback in the short term. Those with sufficient funds in their accounts can consider shorting with a light position. BTC may reach 118,000-117,000 and stabilize before rebounding.

BTC USD LONG RESULT Bitcoin Price has been trading inside a falling flag pattern and held the support range before creating a minor "W" pattern indicating signs of reversal to the upside and why I took the long position from the next support and demand zone as I indicated and from there price moved even better than I anticipated hitting our TP 🔥
_THE_KLASSIC_TRADER_.

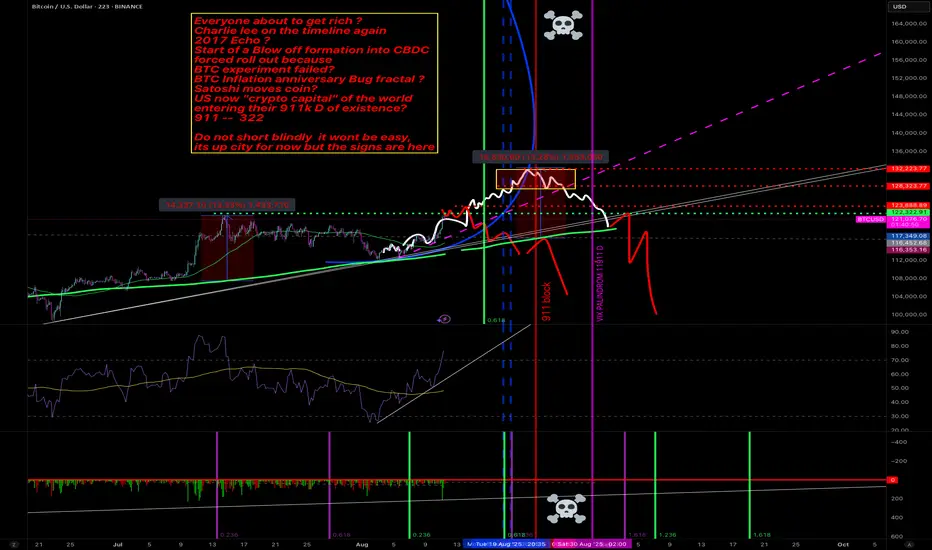
BTC P&D of the century, TOP call blow off formation911-322
use of proprietary logic to determine this outcome.
Hanslanda369
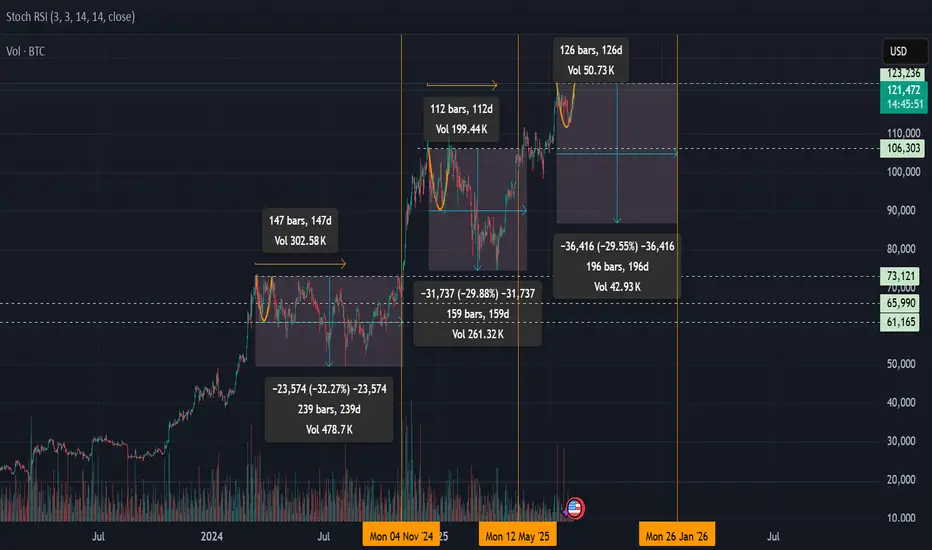
Bitcoin outlookBitcoin has potentially reached its double top pull back of about 30%. Could see a bottom in late oct or nov. new trend toward new ath in jan 2026 is possible.
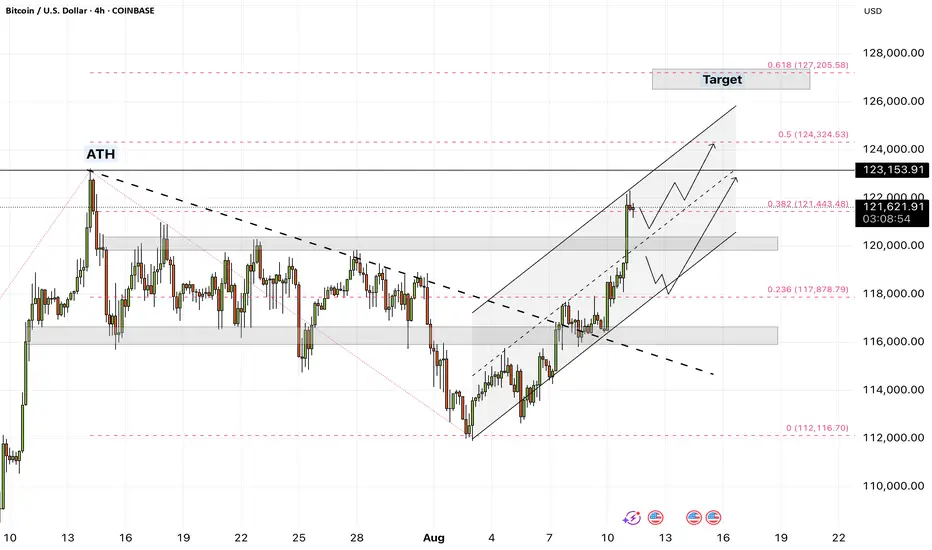
118.5K and 120K For Long EntryMorning folks,
Not too much to say now. Most important thing - BTC was able to stay above vital 110-112K support. So the upside reversal that we traded last two weeks with minimal target around 116K was correct. Now BTC stands much higher, but in a moment when we started the trade - it was impossible to say.
Now we're watching two support areas of 120K and 118.5K for potential long entry. Nearest upside target is 127K
Take care.
bitcoinmoved in the right direction as predicted. market can change direction as new sessions brings new targets to the market.
Bitcoin - Will Bitcoin reach $130,000?!Bitcoin is above the EMA50 and EMA200 on the four-hour timeframe and is in its short-term ascending channel. In case of a downward correction, we can look for Bitcoin buying positions from the channel bottom or the specified support area.
It should be noted that there is a possibility of heavy fluctuations and shadows due to the movement of whales in the market and compliance with capital management in the cryptocurrency market will be more important. If the downward trend continues, we can buy within the demand range.
In 2025 so far, global investors have experienced a continuous swing in market sentiment between two distinct modes:
• Risk-on
• Risk-off
In such an environment, assets like gold and Bitcoin have drawn significant attention as safe havens and portfolio diversification tools. Recent data shows that Bitcoin exchange-traded funds (ETFs) have attracted nearly the same amount of new capital as gold ETFs—a development whose significance goes far beyond a mere statistic.
According to a recently published chart, Bitcoin ETFs have managed to draw almost equal inflows to gold ETFs so far this year. This trend suggests that Bitcoin is gradually securing a position similar to gold within the portfolios of both institutional and retail investors. While the two assets are fundamentally different—one being a physical, traditional commodity and the other a digital, emerging asset—the market’s behavior toward them has been strikingly similar.
At the top of the capital inflows ranking, U.S. equities are far ahead, having attracted over $90 billion in new investment. U.S. bonds hold second place with roughly $50 billion in inflows. Gold and Bitcoin follow closely in third and fourth place, each with around $25–30 billion in new capital.
Ethereum, although trailing behind, is growing rapidly and could soon strengthen its position among the market’s primary assets.
Charles Edwards, founder of Capriole Investments, stated in a recent analysis that Bitcoin’s “fair value” should be around $167,800. This valuation is based on the “Energy Value” metric—a model that considers network energy consumption, supply growth rate, and the dollar value of energy as key factors in determining Bitcoin’s true worth.
Following a record-high Bitcoin network hashrate on August 4—reaching 1.031 zettahashes per second—this model estimates the average price at roughly $145,000 and the potential value close to $168,000. According to Edwards, Bitcoin is currently trading at a 31% discount relative to its energy value. He further noted that even in September 2020, when Bitcoin was priced around $10,000, the deviation from its energy value was smaller than it is today.
Capriole’s data indicates that sustained price growth over the long term typically leads to increased network processing power and improved energy efficiency, ultimately boosting Bitcoin’s energy value. However, if price gains are driven purely by speculation without a corresponding rise in energy capacity, the market tends to revert back to the energy value level.
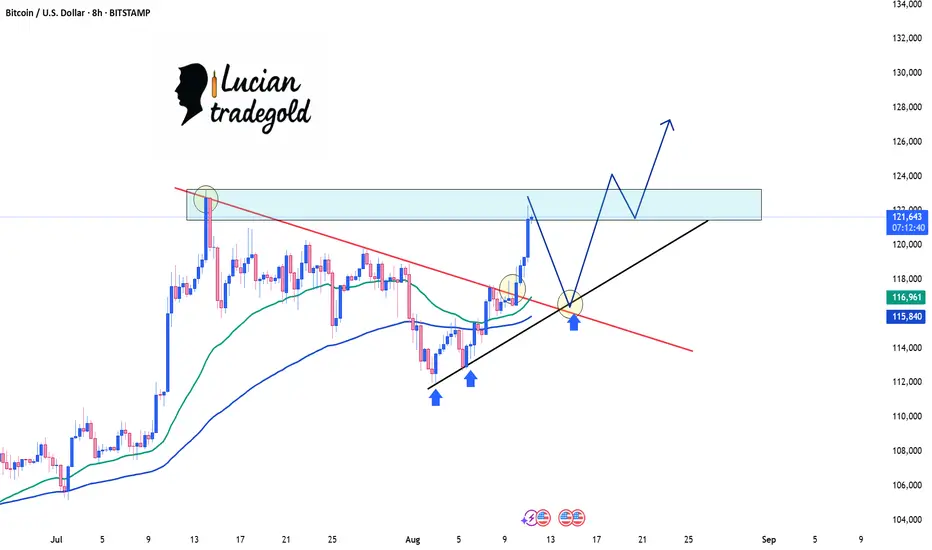
Bitcoin Price Update: A Potential Breakout in Play!Looking at Bitcoin (BTC/USD) on the 8-hour chart, we’re witnessing some exciting action as BTC edges closer to a critical resistance zone, just below $122,000. This level has previously seen rejection, but the bulls are making a strong push with increasing momentum.
Key Levels to Watch:
Resistance Zone: $121,500 - $122,000 (previous rejection area)
Support Trendline: The strong black diagonal line, providing solid support since mid-July.
What’s Happening Now?
Bitcoin has just broken above the crucial trendline, suggesting a possible continuation of the bullish momentum.
The price action around the $121,500 zone is crucial: a clean breakout above this level could trigger a surge towards $124,000 and beyond.
What’s Next?
If BTC breaks and closes above the $122,000 level, we can expect a continuation towards new highs.
Watch out for potential pullbacks to the trendline for a retest before jumping in for long positions.
Trading Strategy:
Look for a breakout confirmation above $122,000, with potential targets at $124,000 and even $130,000 in the longer term.
Stop-loss should be placed just below the trendline support ($116,500) to manage risk efficiently.
Key Takeaway: Bitcoin is gearing up for a potential breakout, but patience is key! Let’s keep an eye on the market as we approach that critical resistance zone.
💬 What’s your take on Bitcoin's next move? Will it break the resistance, or is this just another fakeout? Drop your thoughts in the comments below!