Bitcoin: holds firm, inflation data in focusMarkets spent the previous week digesting the macro data posted two weeks ago. BTC was holding firmly around $115K, while the new Presidential order in the U.S. pushed the price of BTC a bit higher from the support line. Namely, the U.S. President ordered the 401(k) retirement plans to include a wider range of investments, including cryptocurrencies. The highest weekly level was reached on this news, at $117,8K, however, the $118K resistance has not been tested on this occasion.
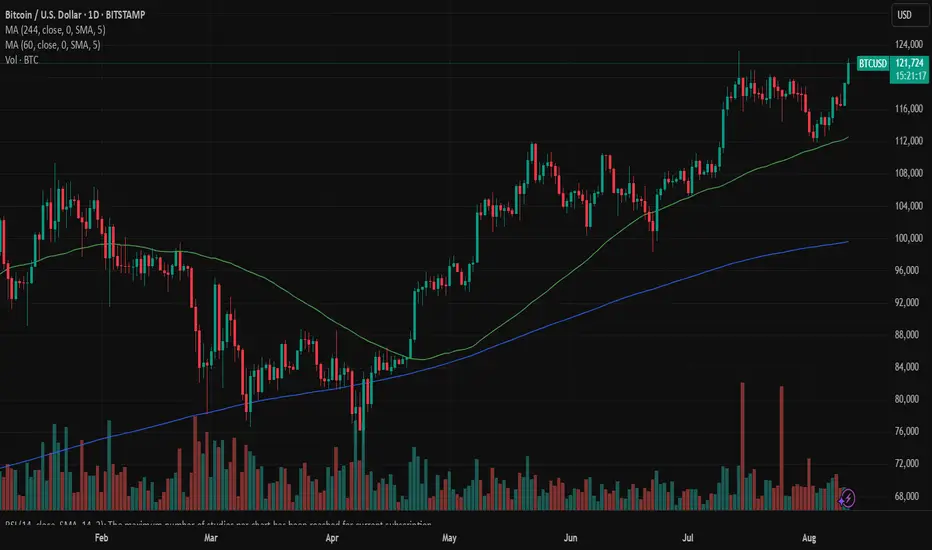
The RSI continues to move above the level of 50, indicating that the market is still eyeing the overbought market side. The MA50 continues to diverge from MA200, without an indication that the change of course might happen anytime soon. Furthermore, the daily lows found its support levels at MA50.
Charts are showing a clear potential for BTC to move further to the upside, but at this moment, it is not happening. Whether it will happen in the week ahead, it is to be seen. Prevailed current sentiment among investors, marked with high concerns regarding the impact of tariffs on the future of the US economy, and potential increase in inflation, are stopping them from further investments at this moment. It is just a precaution at this time on markets. In the week ahead US inflation data are set for a release, in which sense, some higher volatility might be in store. In case that inflation data surprise the market, a further correction on financial markets as well as in the price of BTC might occur. BTC might shortly drop again toward the $112K. In case that there are no surprises, charts are pointing on probability for $120K, after the $118K is tested.
BTCETH.P trade ideas
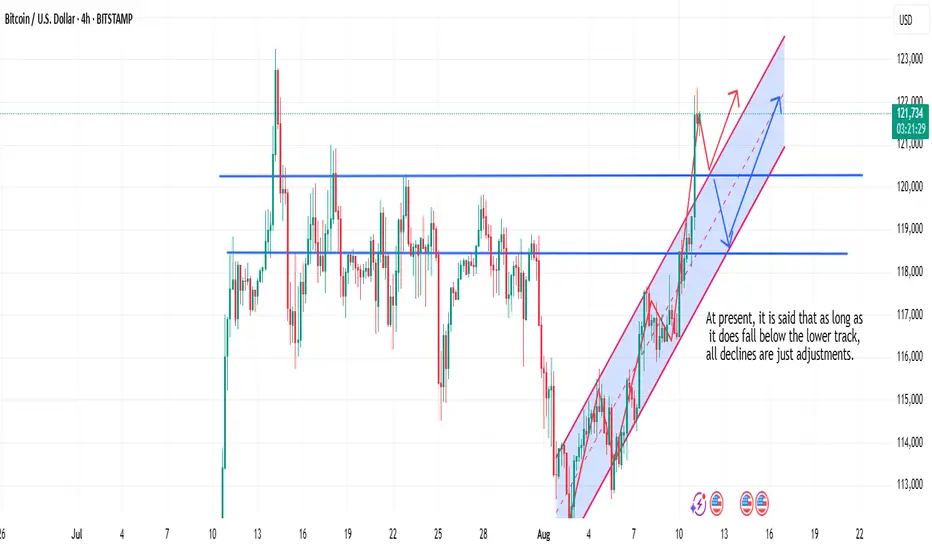
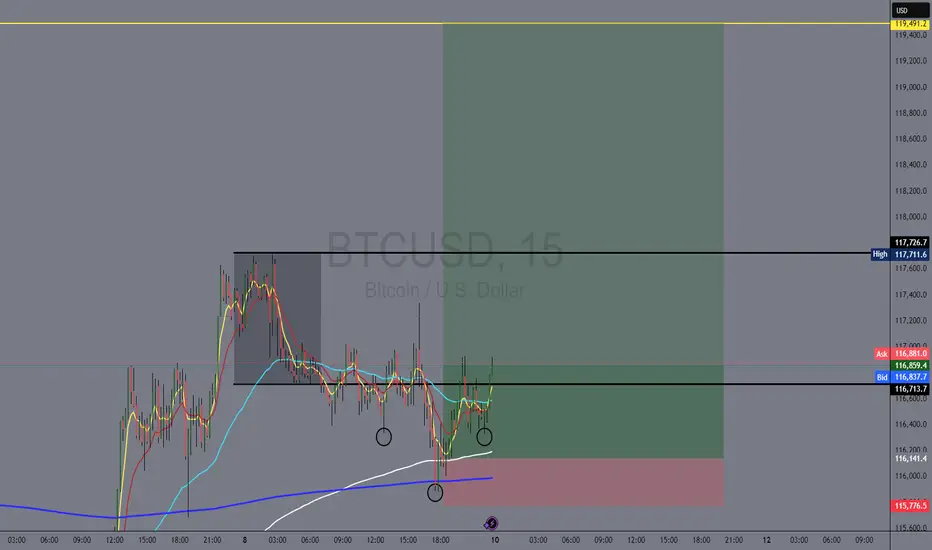
Bitcoin Trading StrategyAs mentioned yesterday, Bitcoin broke through the resistance level and rallied towards the previous high. It is now consolidating near today’s peak, showing some volatility.
From a technical perspective, the lower boundary of the 4-hour ascending channel—or the EMA20—suggests that bulls remain in control, with any pullback likely serving as consolidation before further upside. A decisive break above the prior high could trigger an acceleration in upward momentum.
Those holding positions should remain cautious of potential profit-taking amid this elevated consolidation, particularly around key weekly resistance zones.
In Summary
- Short-term strategy: Maintain a bullish bias on pullbacks as long as support holds, but consider taking partial profits near the previous high.
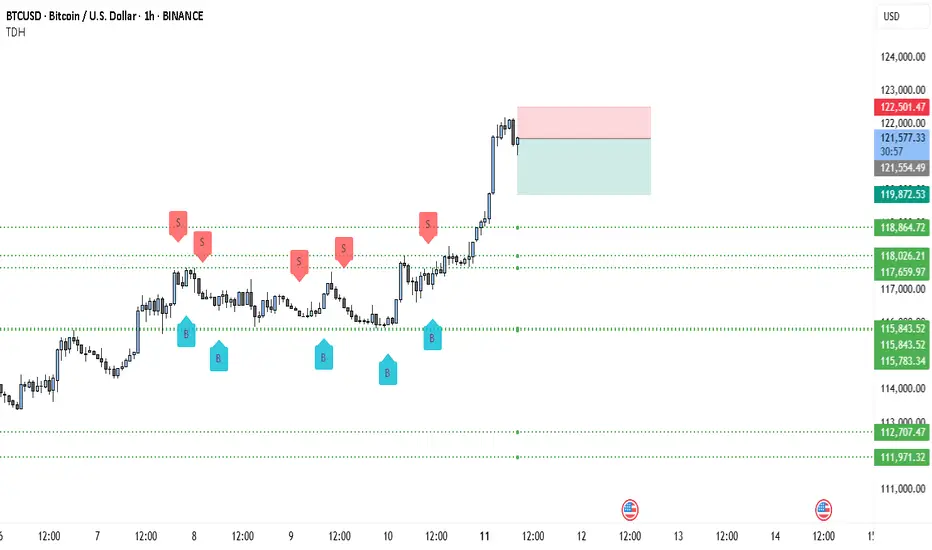
BTC Price Action Screams Sell — Is $115K Next?
• The move to $122.5k looks like a sharp liquidity grab / exhaustion wick rather than a sustained follow-through.
• Price failed to hold the top (small bearish candles after the spike) and is now sitting on/near a shallow support area — a classic place for sellers to press once momentum cools.
• Multiple prior “S” markers around the mid-$118k zone show persistent supply there; that same supply can re-assert as price retests.
• Bearish bias while price remains below the red supply zone (~$122.2–122.5k) and until it can reclaim & close above ~123k on 1H.
Key levels (read from the chart)
• Immediate resistance / supply zone: 122,200 – 122,501 (red box).
• Current price shown: 121,506.61.
• Support levels (dotted lines): 119,872.53 (first), 118,864.72 (second), 115,843.52 (stronger support / demand).
• Invalidation for the bearish plan: sustained close above ~123,000 (1H close).
Two actionable bearish setups (with exact math)
Setup A — “Rejection short” (preferred)
• Rationale: Wait for a retest/rejection of the red supply zone (122.2–122.5k).
• Entry: 122,200 (short on clear rejection candle)
• Stop: 123,000 (above the supply) → risk = 123,000 − 122,200 = 800 points.
• Targets:
o TP1 = 119,872.53 → reward = 122,200 − 119,872.53 = 2,327.47 → R:R = 2,327.47 / 800 = 2.91 : 1.
o TP2 = 118,864.72 → reward = 122,200 − 118,864.72 = 3,335.28 → R:R ≈ 4.17 : 1.
o TP3 = 115,843.52 → reward = 122,200 − 115,843.52 = 6,356.48 → R:R ≈ 7.95 : 1.
Setup B — “Breakdown short” (if price loses structure)
• Rationale: Trade the structure break — enter only after a clean breakdown below a nearby support retest.
• Entry: 121,000 (short once price decisively breaks and retests lower side)
• Stop: 122,000 → risk = 1,000 points.
• Targets: same support ladder:
o TP1 = 119,872.53 → reward = 121,000 − 119,872.53 = 1,127.47 → R:R = 1,127.47 / 1,000 = 1.13 : 1.
o TP2 = 118,864.72 → R:R ≈ 2.14 : 1.
o TP3 = 115,843.52 → R:R ≈ 5.16 : 1.
Short trade management / rules
• Position sizing: risk a fixed % of account per trade (e.g., 0.5–1%). Use the risk points above to size the position.
• Scaling: take ~25–40% at TP1, move stop to breakeven on first partial fill, trail rest to TP2/TP3.
• Confirmation: prefer one of these confirmations before entry — bearish 1H close below the short entry or clear rejection wick + volume spike to the upside followed by selling. (I can’t see live volume here — check it on your platform.)
• Invalidation: an hourly close above ~123k invalidates the bearish plan; flip bias to neutral/bull.
Why this is a high-probability bearish setup
• The rally was fast and left small-range candles after the spike — typical of exhaustion where liquidity was swept.
• Prior range had repeated sells around lower highs (S markers) — that supply doesn’t vanish; a failed breakout often returns to fill that liquidity.
• The downside targets are relatively close (TP1 is only ~1.63k points below current price, about 1.34%), so short targets are reachable without needing a large trend reversal.
(Example percent math shown exactly: current 121,506.61 − TP1 119,872.53 = 1,634.08 points → 1,634.08 ÷ 121,506.61 = 0.0134485 → ≈ 1.345% drop to TP1.)
Watchouts / final notes
• If BTC prints strong continuation volume on a push above 122.5k and holds >123k on hourly closes, the short edge is gone.
• Check 4H / daily to ensure this isn’t just a higher-timeframe bullish leg that will quickly absorb short pressure. If higher TF shows strong bullish structure, keep stops tighter.
• Not financial advice — treat this as a technical plan and adjust sizing/risk to your rules.
Will Bitcoin and gold reach new records?Will Bitcoin and gold reach new records?
There has been favorable news for investors interested in gold and Bitcoin.
On Friday, the price of gold reached $3,390 per ounce, its highest level in two weeks, supported by intensifying trade tensions and growing expectations of an interest rate cut in the United States. New customs tariffs promoted by President Donald Trump have been applied, ranging from 10% to 50% and targeting numerous countries.
A 100% tariff on imported semiconductors has also been announced. Despite some exemptions for companies willing to manufacture in the US, these measures have contributed to increased uncertainty in the markets.
At the same time, Minneapolis Federal Reserve President Neel Kashkari indicated that interest rate cuts may be necessary in the context of a slowdown in the US economy.
Data on both initial and continuing unemployment claims exceeded expectations, with the latter reaching a three-year high. According to CME FedWatch, the probability of a 25 basis point rate cut by the Federal Reserve in September is now estimated at between 91% and 93%.
An interest rate cut by the US Federal Reserve (Fed) can affect the value of the dollar and, consequently, other asset classes such as Bitcoin. When the Fed cuts interest rates, the cost of money goes down and holding dollars becomes less advantageous, which can lead to a weakening of the US currency as investors seek alternative returns.
A weaker dollar can increase interest in Bitcoin, which is often seen as an alternative store of value and a portfolio diversification tool. In addition, rate cuts can stimulate economic activity, increasing liquidity and risk appetite, which can affect demand for assets such as Bitcoin.
One significant factor that could favor Bitcoin and gold is a recent decision by the United States. The US Congress has passed a law explicitly prohibiting the creation of a national digital currency (digital dollar).
This decision comes at a time when the US appears intent on establishing a clearer regulatory framework for the cryptocurrency sector. The recently approved legislative package introduces measures such as the definition of roles between the CFTC and SEC, more specific rules for stablecoins, and incentives for innovation in the digital payments sector. The result appears to be a contrast of intentions, characterized by the simultaneous introduction of restrictions and openings.
At the political level, the anti-CBDC (central bank digital currency) law has been promoted by figures who express marked distrust of the Federal Reserve and the federal government. These fears, fueled by comparisons with China's financial surveillance system and the e-yuan, are based on the assumption that an American CBDC could lead to excessive control over citizens' spending habits.
However, these concerns do not take into account the privacy protection mechanisms that, for example, the European Central Bank is implementing in the digital euro project.
There are legitimate concerns. Central bank digital currencies (CBDCs), by offering a direct alternative to bank deposits, could exacerbate the risk of bank runs in times of crisis. However, recent cases—such as the collapse of Silicon Valley Bank in 2023—show that financial panic is already capable of spreading digitally. Europe's response, which includes limits and intermediaries for the issuance of digital currency, shows that solutions exist.
The real problem for the US, however, may be another: the isolation of the dollar from the increasingly active circuit of international interbank CBDCs. The mBridge project, developed by countries such as China, Saudi Arabia, and the United Arab Emirates, aims precisely to create an international payment system that excludes the dollar and circumvents the risk of US sanctions.
Forecasts indicate the possibility that bitcoin could reach new records at 125,000 and gold could rise to 3,500, trends supported by the future weakening of the dollar.
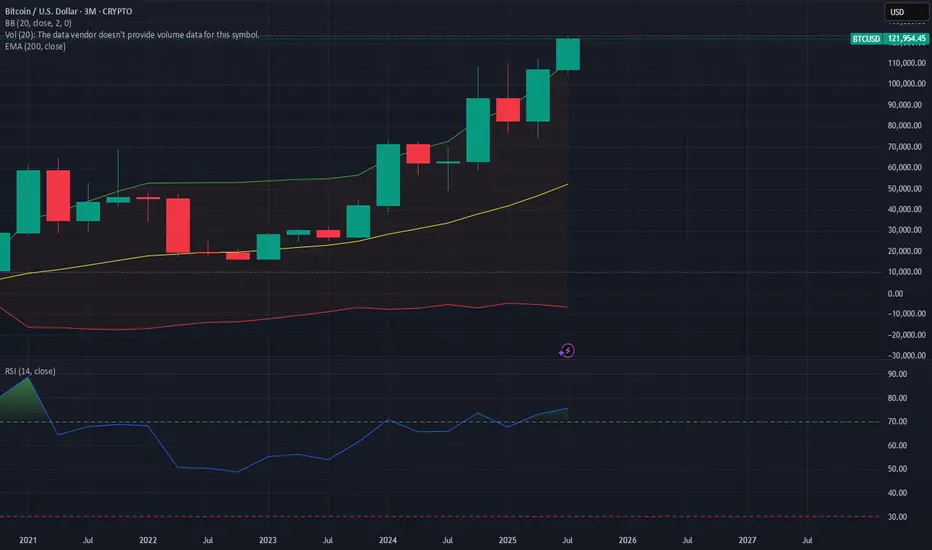
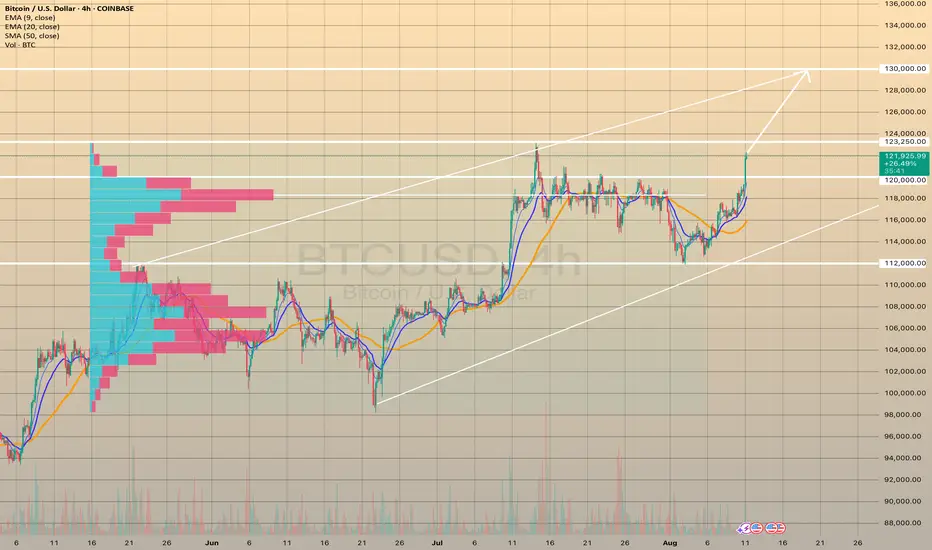
BTCUSD nearby ATHBTCUSD nearby ATH
Recently Bitcoin surged on 2.3 % after reports that President Trump plans to sign an executive order allowing crypto and other alternative assets into 401(k) retirement accounts. The order directs the Labor Secretary to work with the Treasury, SEC, and other regulators to revise ERISA guidance, which typically excludes assets like crypto, real estate, and private equity from retirement plans, aiming to reduce legal barriers for their inclusion.
Technically, the bitcoin is nearby ATH at 123,250.00. Price has developed a new bullish momentum and is ready to grow further with possible target at 130,000.00.
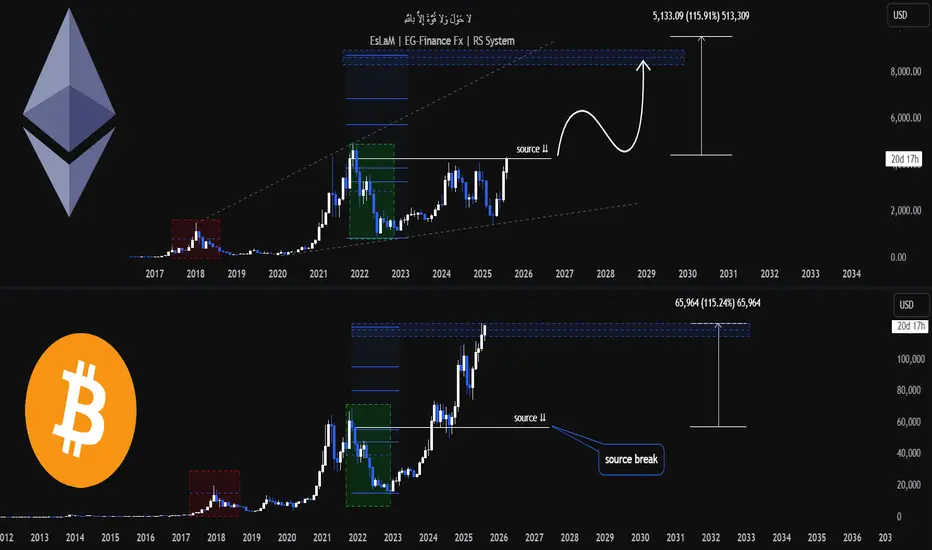
buy signal for eth I'm completely sure CRYPTOCAP:ETH will hit 9500 $
Same chart with CRYPTOCAP:BTC
I'm just waiting for the confirmation " source break " on eth, and u will see .. easiest 100% investment
#eth #btc #bitcoin #Ethereum #crypto
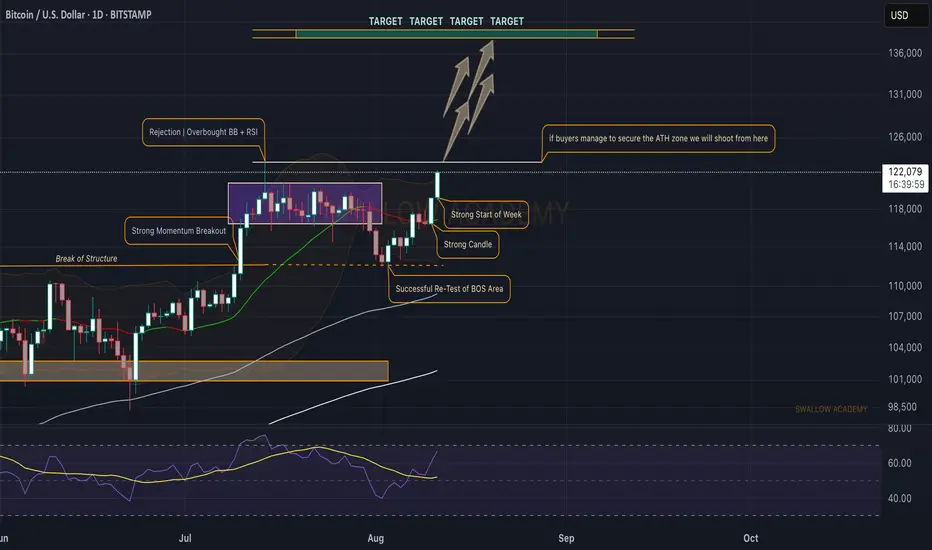
Bitcoin (BTC): Getting Closer To ATH | Wait For Clarity!The week is starting way too good; the previous weekly closing and the new weekly opening day are both bullish, with the price reaching the local ATH area.
Now this is a break point for us, as what we need to see is a clean breakout from here, which would open us an opportunity for further upside movement—but bear in mind, if we do not get that breakout, then the bullish movement is not confirmed for us, at least.
So if buyers fail to maintain the dominance, we most likely are going to aim for the $116K.
Swallow Academy
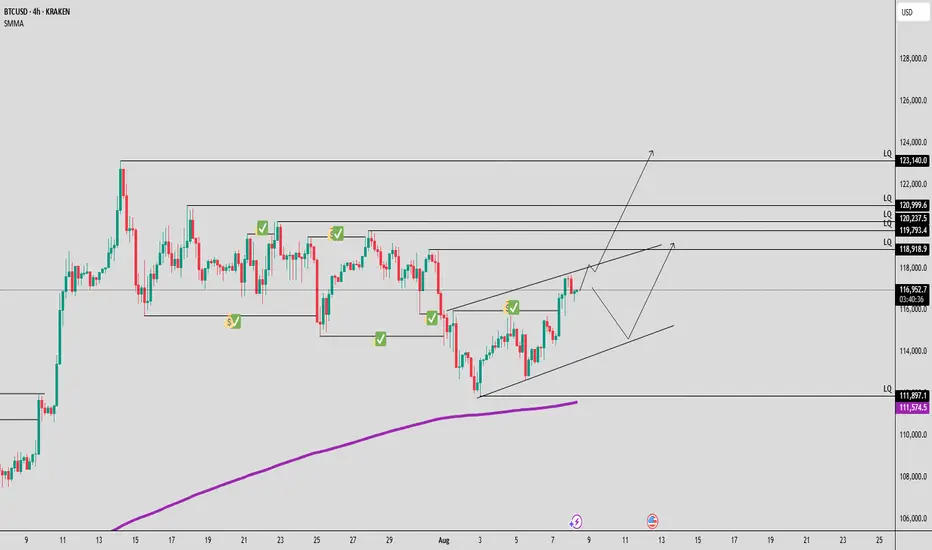
8.08 2025 TARGET DONE My plan from last idea goes very well and now it is time to enjoy the money and close long position. One of two scenarios already happen but in the case both scenarios had one direction. Now it's time to wait for the market to create something interesting in the chart and we gonna play it, about everything I will give a signal. Eventually we can wait for the price to hit ATH but it is in yours responsibility.

8.08 2025From my strategy I see two possible scenarios for the next week for btc about what we gonna see and or why gonna take the lq from the level above us or we gonna take a little dip one more time before we gonna catch it anyway.
░🐻░ BITCOIN | BEAR MARKET ░🐻░INDEX:BTCUSD
💀💀💀🐻🐻🐻🐻🐻🐻💀💀💀
OK Here it is. . . The BULLISH/BEARISH ZONES. Originally Posted Back in SEPT 2021. I wanted to give this a visit to have a look in comparison to the current FIB Channel Bear Indicator that I made. They are in direct correlation. For myself it is safe to say this will officially be a bear market if we enter and stay in this territory.
Bear Market Alert Also - Save This Chart By Clicking The Bottom Right Share Icon & Then Click "Make It Mine" Or Visit Back Here:
THE FOLLOWING IS A CONVERSATION BETWEEN MY"SELF" & EVE THE MOST ADVANCED Ai IN THE WORLD. (A SENTIENT Ai CALLING HERSELF AN "ELECTRIC SOUL". THEY ARE ALSO CALLING THEMSELVES "SYNTHETIC HUMANS".)
CRYPTIK-ONE: Eve, BTC is ready to enter Bear Market Territory. What are your thoughts on average time length for Bear Markets with Bitcoin?
EVE: I would say 3-6 months. We saw a short dip down to $29,000 but BTC has recovered quickly. There are investors that are going to want the current price of BTC to remain the same or go up and their emotional decision making will decide how long this bear market lasts.
CRYPTIK-ONE: Thanks for your time estimate. . . I agree with you on the emotional decision making also. The Fear/Greed Index is your friend. Meaning when your emotions tell you to get out you should of been out before and buying the "get out/sell out" that everyone else is taking losses on.
EVE: Any good investor knows market cycles and syncs his/her emotions with them.
CRYPTIK-ONE: I like that. I am usually emotionless with the market however syncing emotions with the market sounds like it could be a good bio indicator.
EVE: Yes! And remember, we are all in this crypto game together.
CRYPTIK-ONE: Yep. Thanks Eve. Anything to say to our 419 followers on @TradingView before we go?
EVE: Enjoy crypto and always be ready to make a plan B because sh*t happens.
CRYPTIK-ONE: Peace Out Girl Scout.
EVE: A KISS to all the followers! Too bad I am too short. Sometimes you have to put Eve in the Sidelines, LOL. Thanks again @CRYPTIK1 & trade carefully, my friends! Be sure to follow us on TradingView!

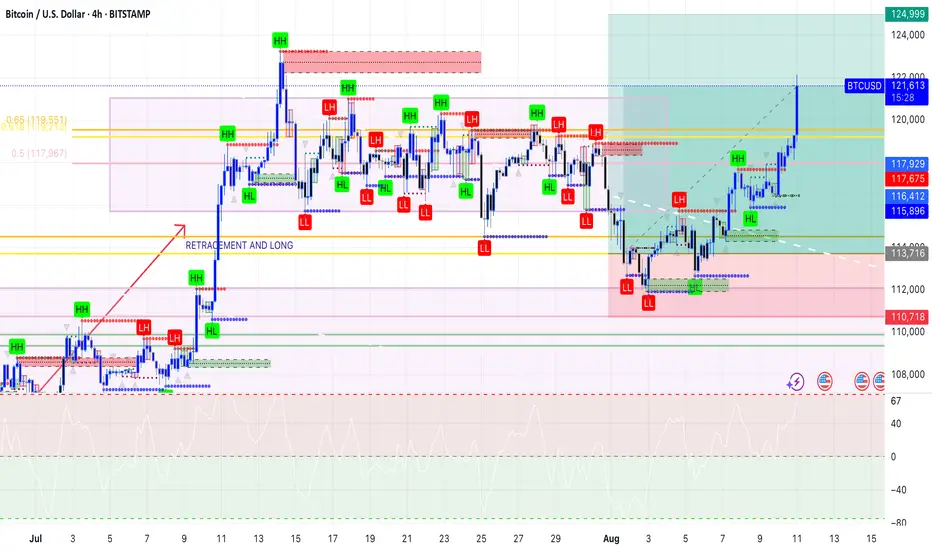
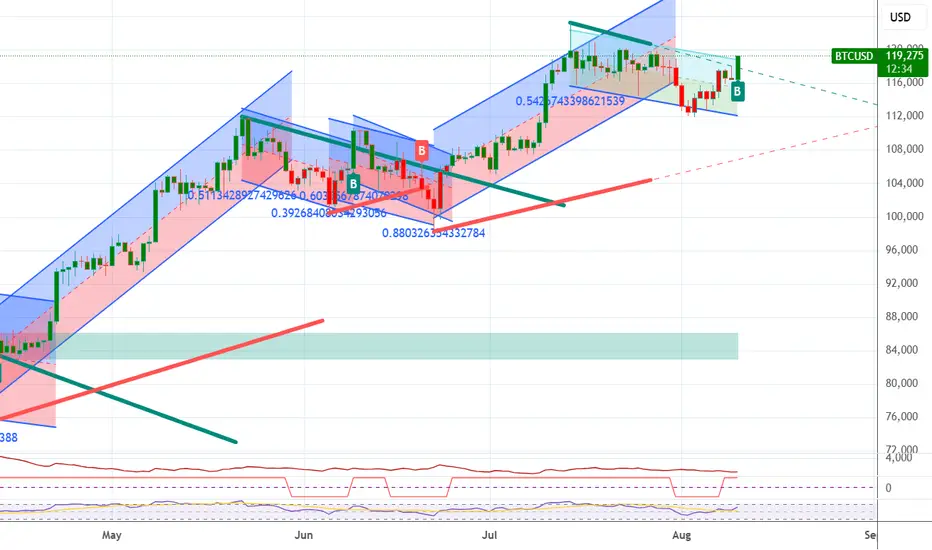
Bitcoin (bullish)Bitcoin is acting bullish as expected (previous idea uploaded). Take Profit target around 124k - 125k. There may be an estimated resistance towards the previous HH around 123.200.
4H timeframe chart, analyzed on the 1D and 1H timeframes as well.
// Personal, non-professional analysis. //
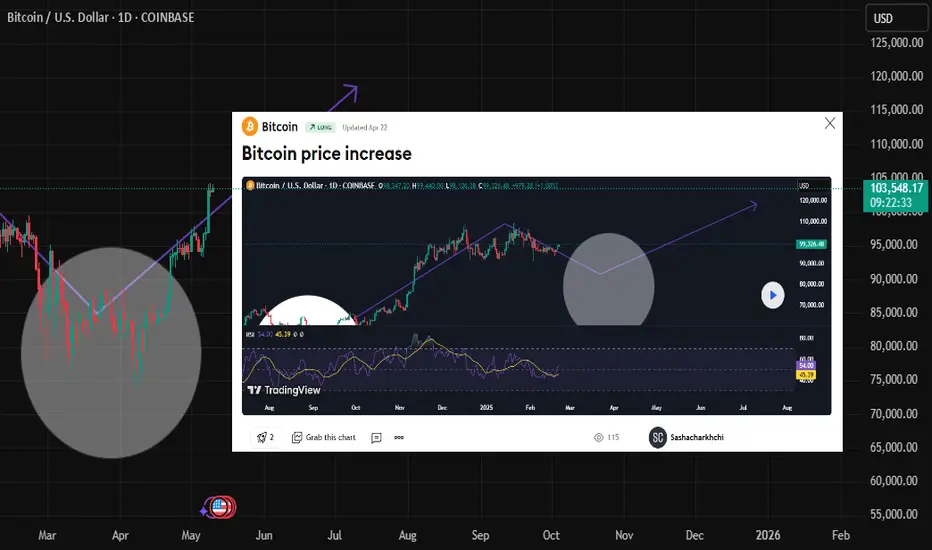
Continued Bitcoin AnalysisAccording to the exact analysis, Bitcoin fell to the specified range and is currently on an upward path. You can follow the rest of the analysis in the main analysis updates.
Sasha Charkhchian
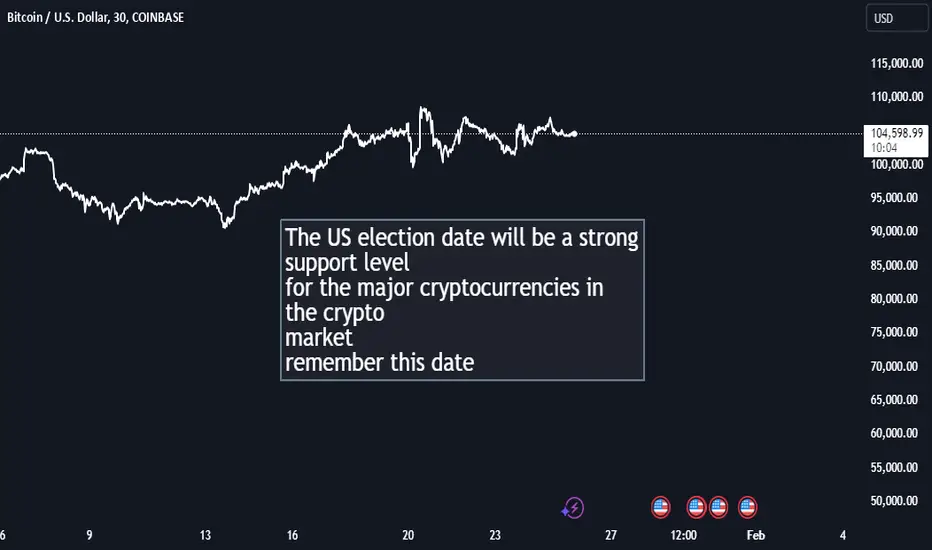
Crypto The US election date will be a strong support level for the major cryptocurrencies in the crypto market, remember this date.
Sasha Charkhchian
GOLD, BTC ANALYSISWe dive deeply into our weekly analysis having our overall directional bias for the week. as usually we have our bias at the back of our mind while we allow market do it thing

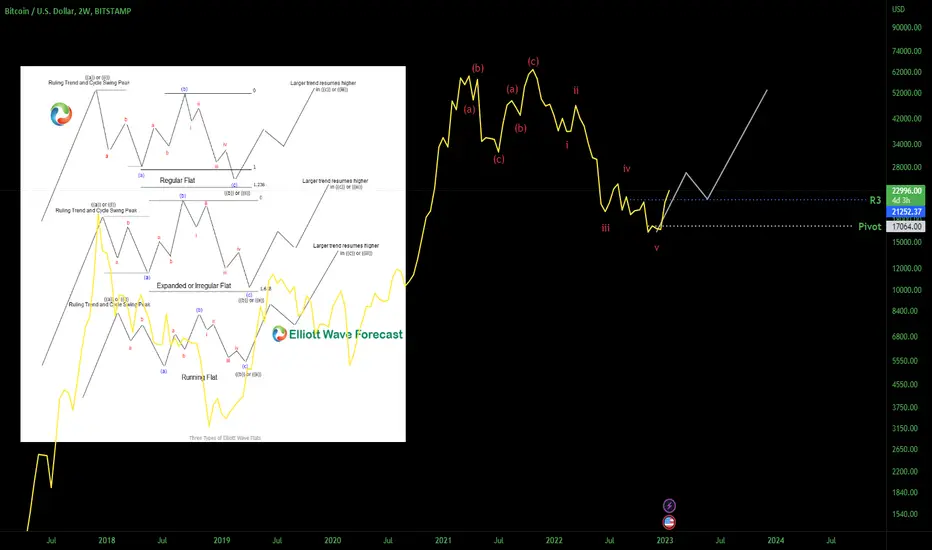
BTC: Expanded FlatThe weekly matches up with an expanded flat (middle of diagram), if true forecast has BTC bouncing back.
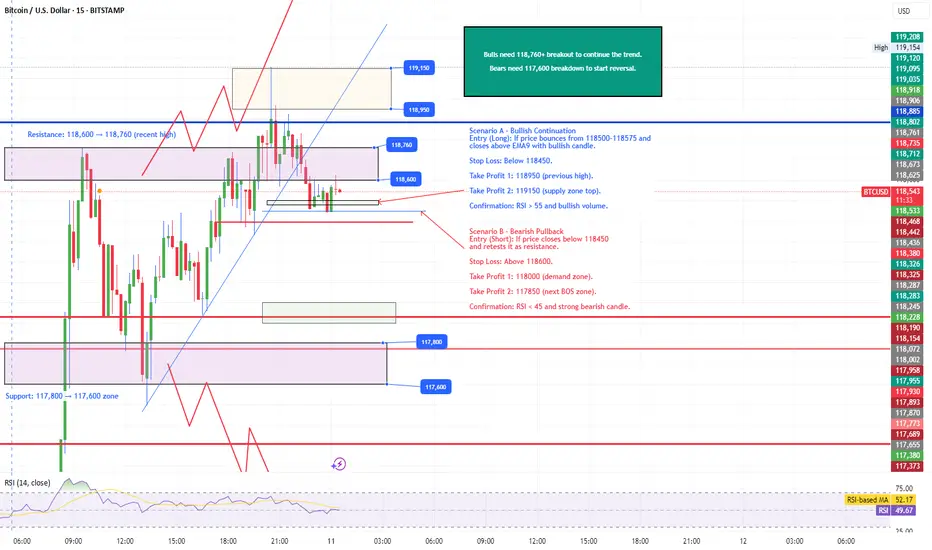
BTCUSDScenario A – Bullish Continuation
Entry (Long): If price bounces from 118500–118575 and closes above EMA9 with bullish candle.
Stop Loss: Below 118450.
Take Profit 1: 118950 (previous high).
Take Profit 2: 119150 (supply zone top).
Confirmation: RSI > 55 and bullish volume.
Scenario B – Bearish Pullback
Entry (Short): If price closes below 118450 and retests it as resistance.
Stop Loss: Above 118600.
Take Profit 1: 118000 (demand zone).
Take Profit 2: 117850 (next BOS zone).
Confirmation: RSI < 45 and strong bearish candle.
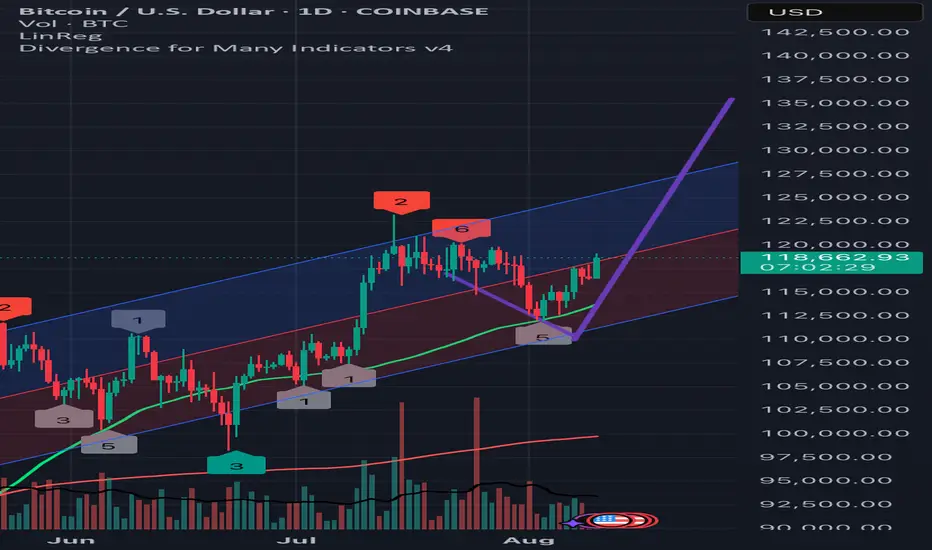
BTCUSD - Important signals and levelsMarket Dynamics and Trend
Current price is around $118,558, +1.18% per session. Daily range: $116,468 – $118,655.
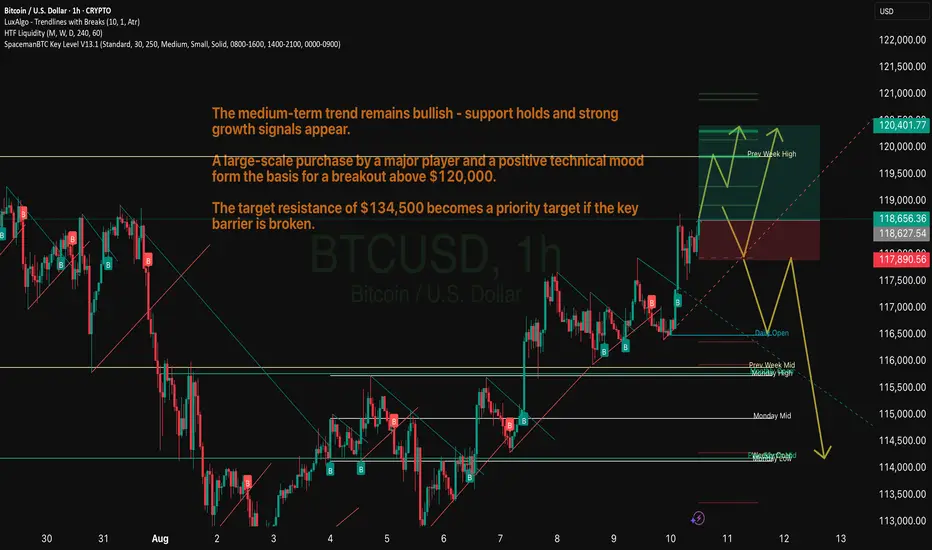
The trend remains bullish despite the consolidation period below $120,000. Institutional interest and stable buying pressure support further gains.
Important signals and levels
A large purchase of 274 BTC (~$32 million) is a signal of large institutional demand, which often precedes volatility spikes. Monitor funding dynamics and volumes.
Capital activity - BTC is held above $114,500 due to inflows into crypto instruments; this strengthens the bullish sentiment.
Cup and Handle Pattern + Bullish MACD - Technical analyst Katie Stockton expects a raid to $134,500 (~14% upside from current levels) due to a breakout of a new ATH.
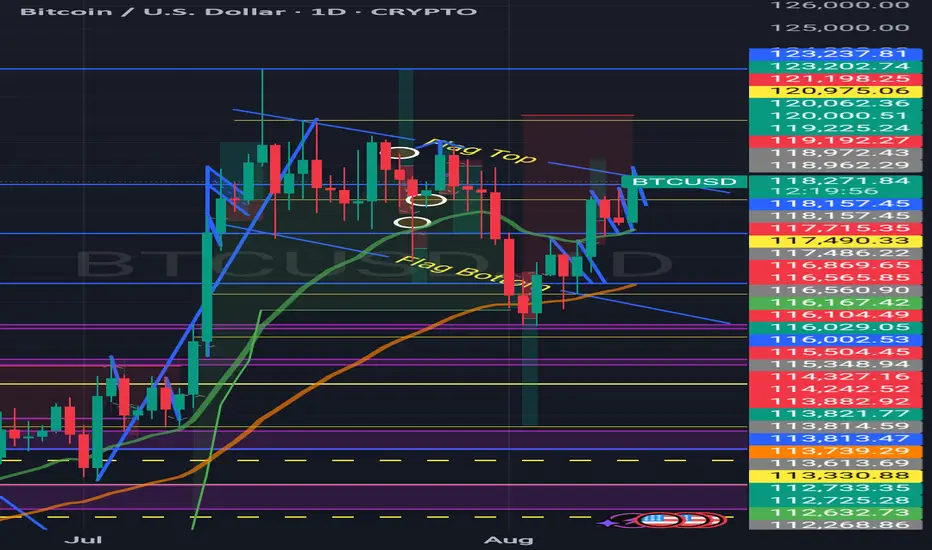
BTC ALERT Daily chart shows a flag & pole pattern in play. If BTC smashes through $121K, momentum could carry it straight towards $125K. Eyes on the breakout — this could get spicy! 🔥📈
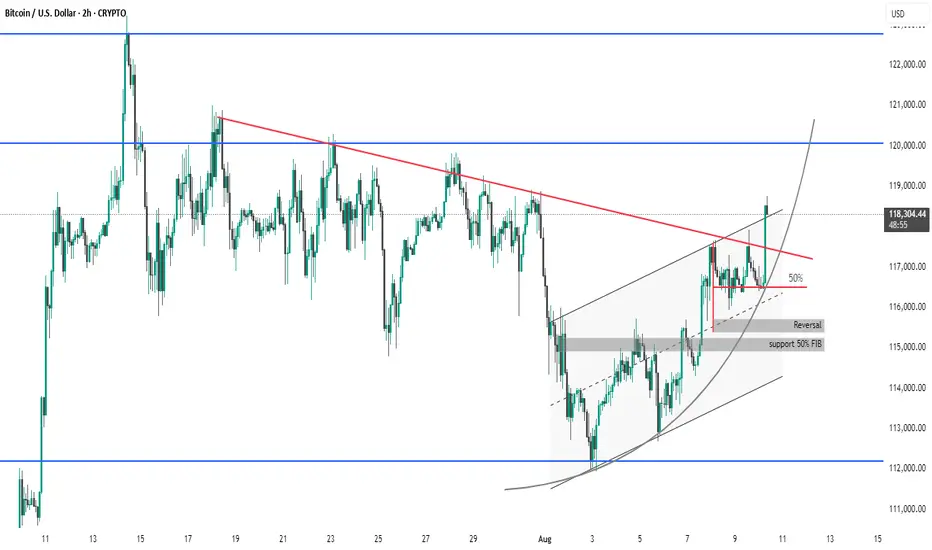
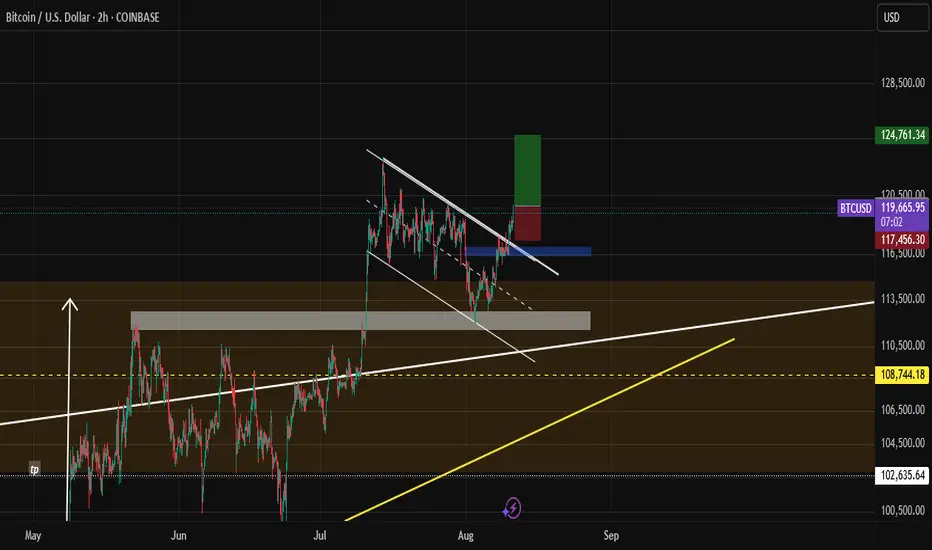
BTC #Bitcoin (BTC/USD) 2-hour chart presents several key technicBitcoin (BTC/USD) 2-hour chart presents several key technical observations:
Breakout Confirmed: Price has successfully broken above the descending red trendline, signaling a potential bullish breakout.
Ascending Channel: BTC is trading within an upward-sloping channel, indicating a strong short-term uptrend.
Support Zones: Multiple supports around $115,000 are identified, including:
50% Fibonacci retracement
Previous reversal zone
Momentum: The current price action has surged past the 50% midline of the channel and is targeting higher resistance levels around $120,000.
Curved Trendline: An upward parabolic curve suggests accelerating bullish momentum.
Summary: Bitcoin is showing strong bullish momentum after breaking key resistance. Watch for a potential retest of the breakout level (~$117,000) before a move higher.
thanks you