BTCETH.P trade ideas

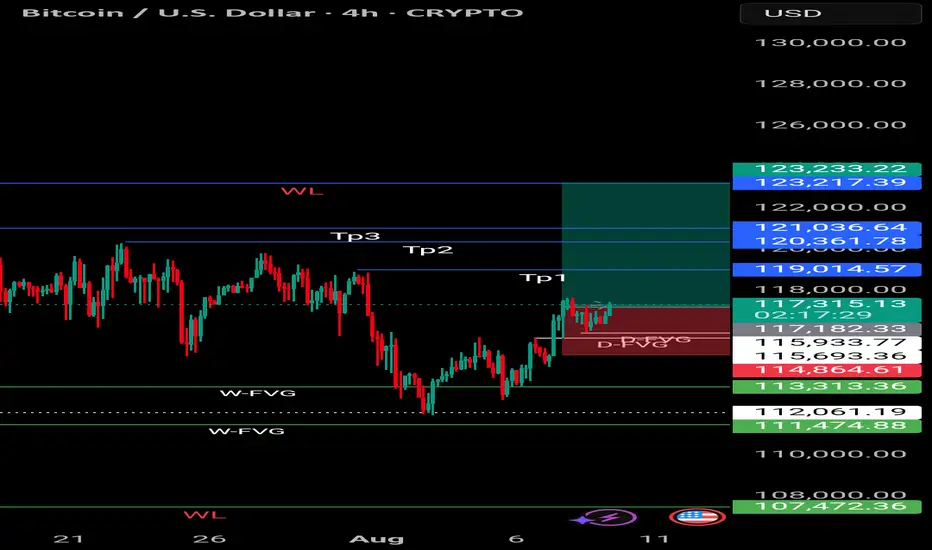
Bitcoin analysisBitcoin tapped in weekly FVG and we had rejection from it, so we can clearly see no bearish signs on Bitcoin
My target is long towards the untaken liquidity
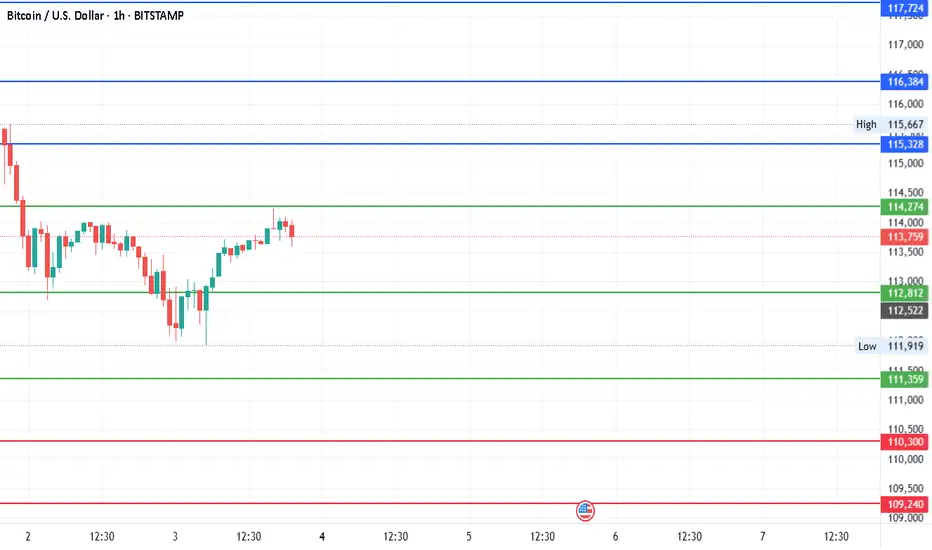
#BitcoinDate: 03-08-2025
#Bitcoin Current Price:113646
Pivot Point: 112812 Support: 111359 Resistance: 114274
Upside Targets:
🎯Target 1: 115329
🎯Target 2: 116384
🎯Target 3: 117724
🎯Target 4: 119063
Downside Targets:
🎯Target 1: 110300
🎯Target 2: 109240
🎯Target 3: 107901
🎯Target 4: 106561
#TradingView #Nifty #BankNifty #DJI #NDQ #SENSEX #DAX #USOIL #GOLD #SILVER
#BHEL #HUDCO #LT #LTF #ABB #DIXON #SIEMENS #BALKRISIND #MRF #DIVISLAB
#MARUTI #HAL #SHREECEM #JSWSTEEL #MPHASIS #NATIONALUM #BALRAMCHIN #TRIVENI
#USDINR #EURUSD #USDJPY #NIFTY_MID_SELECT
#SOLANA #ETHEREUM #BTCUSD #MATICUSDT #XRPUSDT
#Crypto #Bitcoin #BTC #CryptoTA #TradingView #PivotPoints #SupportResistance
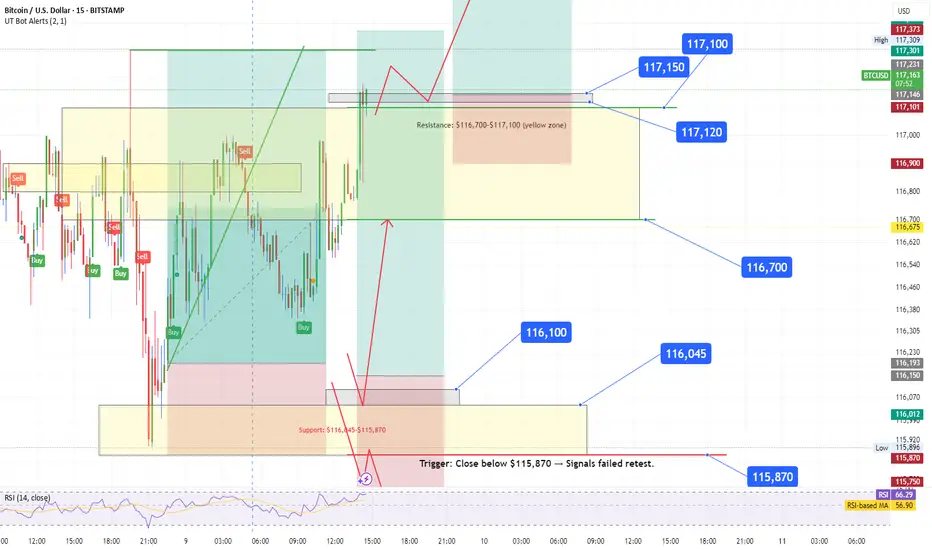
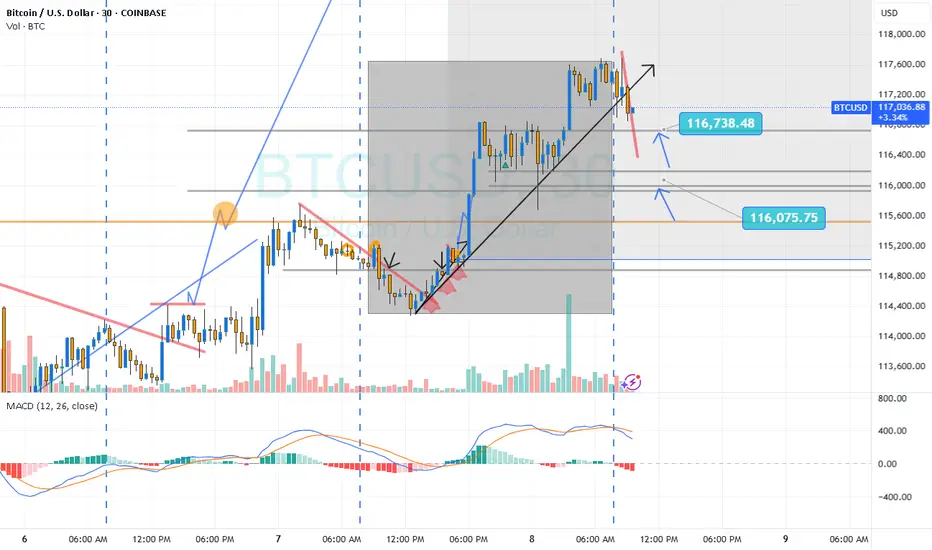
BTC USD✅ Validated Trade Plan Adjustments:
Immediate Action (Current Price: $116,808)
Price is testing resistance ($116,700–$117,100).
DO NOT BUY here – risk of rejection is high.
Watch for:
🟢 Breakout confirmation: Close above $117,100 → Long to $118,000+.
🔴 Rejection signal: Bearish candle + RSI drop → Short target $116,100.
Updated Scenarios
Breakout Above $117,100 (New Entry):
Trigger: 15-min close > $117,100 + volume surge.
Entry: $117,120–$117,150.
Stop Loss: $116,900.
Target: $118,000 (scalp), then $118,415–$118,820.
Rejection at Resistance (Short Setup):
Trigger: Bearish pin/reversal candle at $116,700–$117,100 + RSI < 45.
Entry: $116,650–$116,700.
Stop Loss: $117,150.
Target: $116,100 (support), then $115,870.
Support Bounce Trade (Unchanged):
Trigger: Dip to $116,045–$116,100 + bullish reversal candle.
Stop Loss: $115,750.
Target: $116,700–$117,100.
🚨 Critical Notes:
Ignore $118,415–$118,820 "Squouts":
This appears to be a data error (likely mislabeled resistance). Support cannot be above current price.
Monitor RSI: Currently neutral (51.64) → Breakout/rejection will clarify direction.
Key Risk: Close below $115,870 invalidates bullish structure → Target $115,500.
📊 Execution Summary:
"Wait for breakout above $117,100 (long) or rejection at resistance (short). Original support ($116,100) remains valid for longs, but avoid buying near current resistance."
Verify volume on breaks – false breakouts are likely in this zone
Thank me later buoysMore magical lines I have drawn for all to bear witness, praise me.
Follow for more wizard prophetics. I was homeschooled
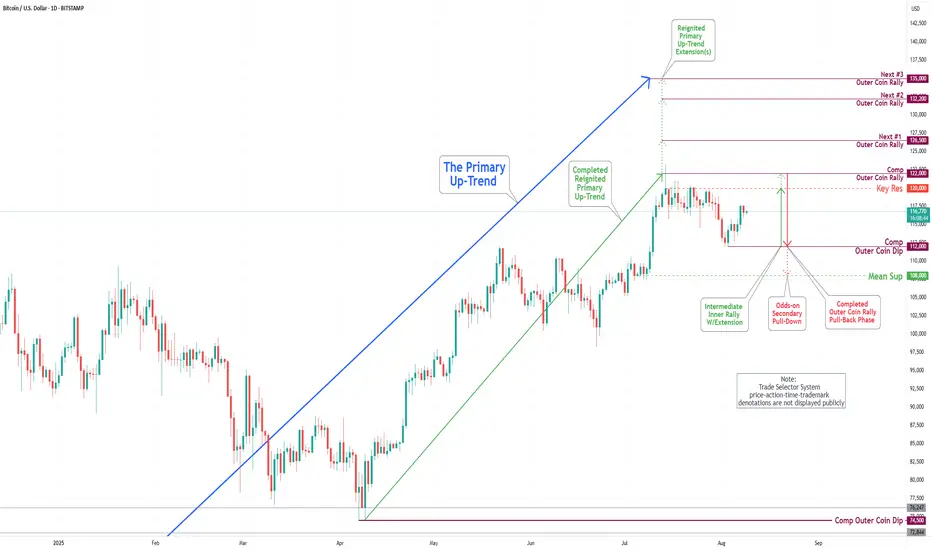
Bitcoin(BTC/USD) Daily Chart Analysis For Week of August 8, 2025Technical Analysis and Outlook:
During this week's trading session, the Bitcoin market demonstrated significant resilience, recovering from our Mean Support level at 113,000 and completing the Outer Coin Dip at 112,000. Current analysis also suggests that the cryptocurrency is attempting to retest the completed Outer Coin Rally at 122000 and the critical Key Resistance level at 120000. Conversely, on the downside, Bitcoin may seek to revisit the completed Outer Coin Dip at 112000, with the potential to extend toward the Mean Support level of 108000 before continuing its bullish trajectory.
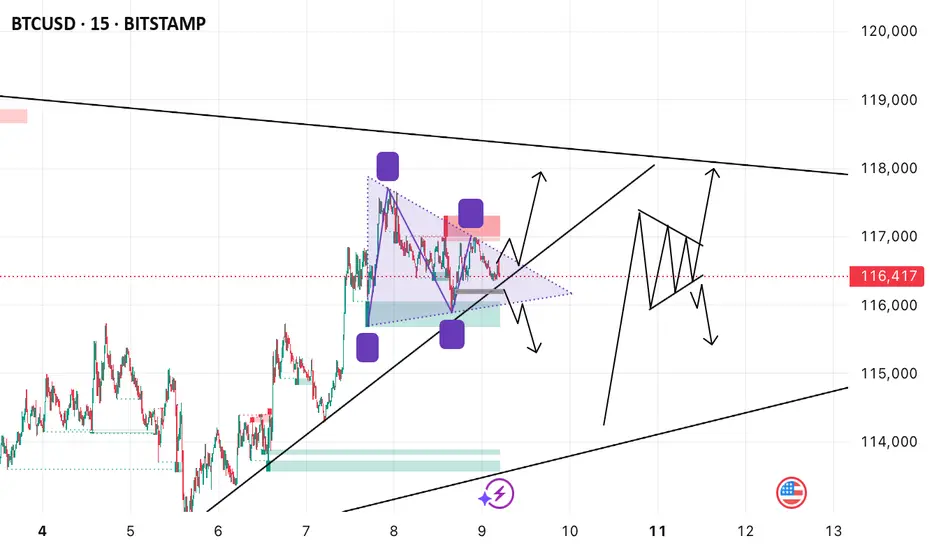
MovementsBTC is at a binary point on the weekly chart consolidating at oversold levels and bearish divergence. But here on the lower timeframe there is possibly a bullish consolidation in the form of an ascending triangle. Bulls need to maintain the trendline and clear 117,000 price area, the bears ultimately want 115,900 prices.
Please be careful of fakeouts and be patient. Please observe key levels and always do your own TA. Thank you for hitting the like and your positive feedback.

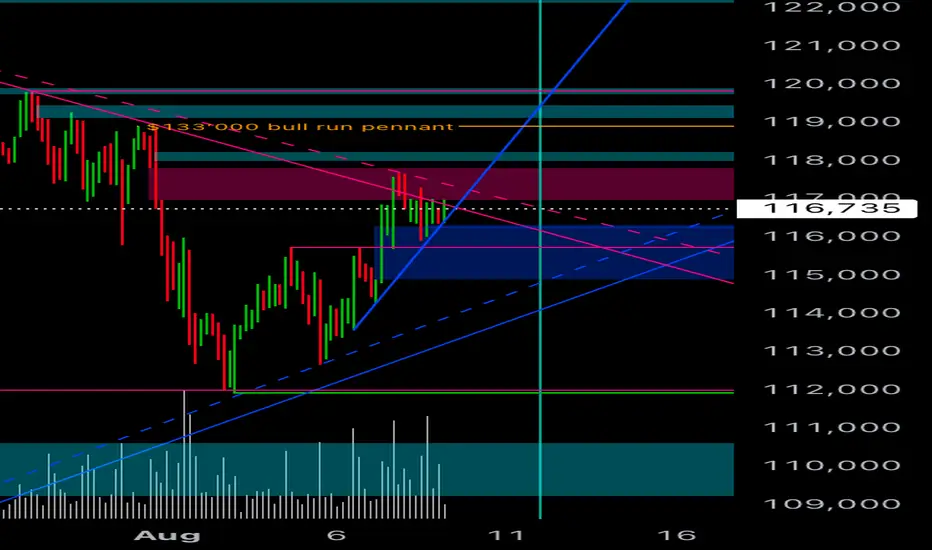
Highway Star$133’000 bull run pennant above $119’000.
Shift above all time accurate trend lines. We are at the beginning of exponential vertical segment. Strong rising front at $115’700.
Bitcoin institutional demand continues to outpace new supply, with 545,579 CRYPTOCAP:BTC purchased year-to-date compared to only 97,082 CRYPTOCAP:BTC in new supply.
The volumes were bought on July 15 and 25 for 116,000 and 115,000 respectively. So I think we are waiting for 119,000 to launch above all time high.
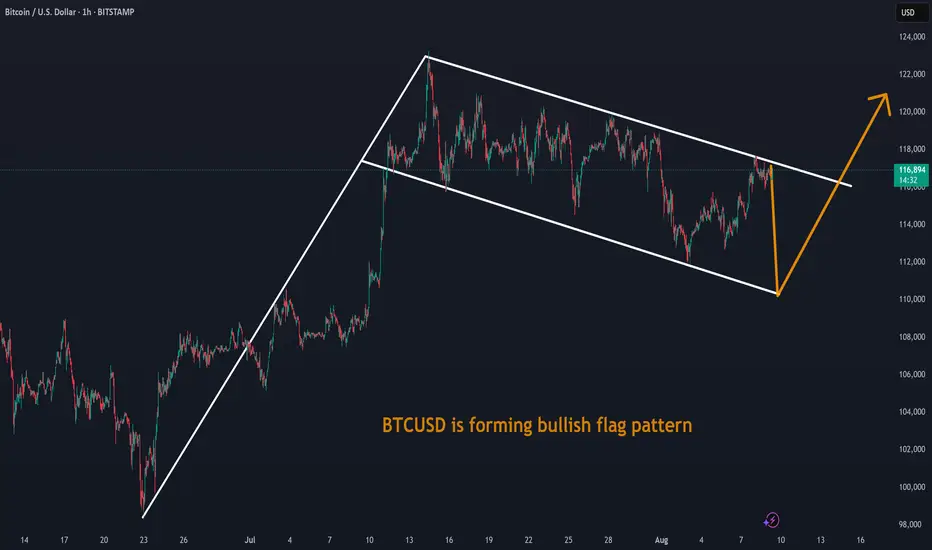
BTCUSD is forming bullish flag patternBTCUSD is forming bullish flag pattern. Any postive news will be Triiger for its upside breakout
BTCUSD at point of decision Bitcoin on the 15-minute timeframe is moving within a broad ascending channel. Price is currently around $116,331 and consolidating inside a symmetrical triangle, sitting near the channel’s lower support. There are signs of a potential bullish move, with a possible breakout aiming toward the $118,800 area, which aligns with the channel’s upper boundary. The chart also marks previous demand around $114,000, suggesting it could act as support if price drops. While the main idea leans bullish, there is a possibility of a fake breakout before moving lower, showing caution that momentum might fail.
Let’s see a breakout on either side before taking a trade.
BTCUSD: Critical Consolidation Zone - Bulls vs Bears Battle at 1
📊 Market Structure Overview
Bitcoin is currently trading in a critical consolidation zone around 115,488-117,679 after experiencing a significant pullback from recent highs. The price action suggests we're at a pivotal decision point that could determine the next major directional move. ⚖️
🎯 Key Levels Analysis
🔴 Supply Zones (Resistance)
Primary Supply Zone: 120,954.84 - 122,094.66 🚫
Secondary Supply Zone: 117,606.55 - 118,664.22 ⛔
🟢 Demand Zone (Support)
Major Demand Zone: 111,971.32 - 113,179.33 💪
🔄 Current Consolidation Zone
Range: 115,488.540 - 117,679.520 📦
📈 Technical Outlook
🐂 Bullish Scenario (Probability: 45%)
Conditions for upside breakout:
✅ Hold above 115,500 support level
✅ Break and close above 117,700 (consolidation high)
✅ Volume confirmation on breakout
🎯 Bullish Targets:
Target 1: 118,500 (near secondary supply zone)
Target 2: 121,000 (primary supply zone test)
Target 3: 125,000+ (new highs if supply breaks)
🐻 Bearish Scenario (Probability: 55%)
Conditions for downside break:
❌ Break below 115,400 with volume
❌ Failed bounce from current levels
❌ Rejection at 117,600 resistance
🎯 Bearish Targets:
Target 1: 113,000 (demand zone top)
Target 2: 112,000 (demand zone middle)
Target 3: 110,000 (demand zone break)
💰 Trading Strategies
🟢 Long Setup (Breakout Play)
📍 Entry: Break above 117,700 with volume
🎯 Target 1: 118,500
🎯 Target 2: 121,000
❌ Stop Loss: Below 116,800
🔴 Short Setup (Breakdown Play)
📍 Entry: Break below 115,400 with volume
🎯 Target 1: 113,000
🎯 Target 2: 112,000
❌ Stop Loss: Above 116,500
⚖️ Range Trading Setup
🟢 Buy: 115,500-115,800 (support bounce)
🔴 Sell: 117,400-117,600 (resistance rejection)
❌ Stop: Outside the range (114,800 / 118,200)
📊 Technical Indicators Analysis
Moving Averages: Currently mixed signals with price between key MAs 🌊
Volume Profile: Watching for volume confirmation on any breakout 📊
Market Structure: Consolidation after sharp correction suggests accumulation/distribution 🔄
🌍 Market Sentiment Factors
📰 Ongoing regulatory developments
🏦 Institutional adoption trends
💵 Dollar strength/weakness impacts
⚡ Network fundamentals and adoption
📈 ETF flows and institutional interest
👀 Key Watch Points
📊 Volume Surge: Any breakout needs volume confirmation
🕒 Time Factor: Longer consolidation often leads to bigger moves
💹 Correlation: Watch traditional markets for risk sentiment
📅 Event Risk: Any major crypto news or regulatory updates
🎯 Conclusion
Bitcoin is at a critical juncture with equal probability for both bullish and bearish scenarios. The consolidation zone between 115,488-117,679 is the battleground where bulls and bears are fighting for control.
Key Strategy: Wait for a clear breakout with volume confirmation rather than trying to predict direction. The next move could be significant given the tight consolidation and clear supply/demand levels. 🚀⚡
⚠️ Risk Management:
Use tight stops on breakout trades
Position size appropriately for volatility
Consider waiting for retests of broken levels
⚠️ Risk Warning: Cryptocurrency trading involves substantial risk and high volatility. Always use proper risk management and never invest more than you can afford to lose.

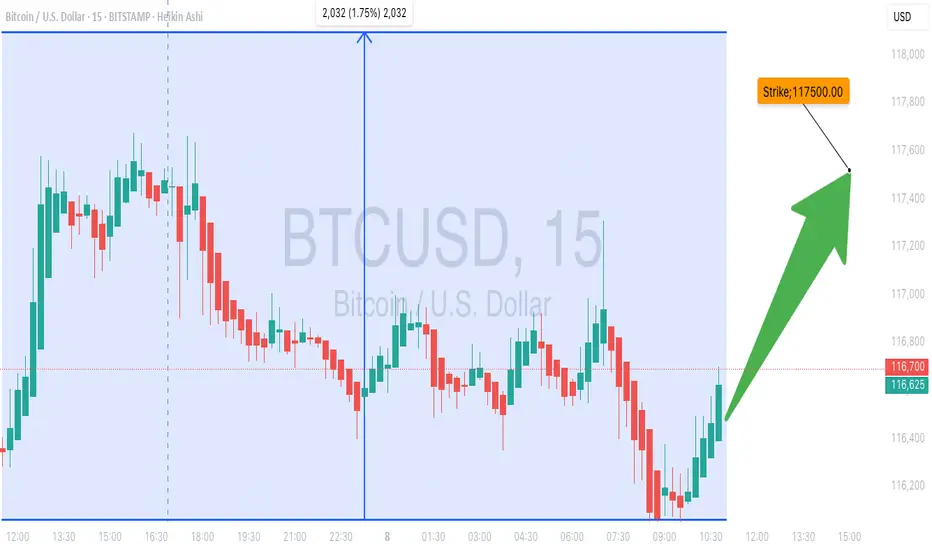
BTC At Key Support! Will Bulls Breakout From $116K? Don’t Miss **💎 BTC TRADE SETUP — HOLDING SUPPORT FOR NEXT LEG UP**
📈 **Market Bias:** Mixed → Short-term pressure, long-term bullish
🔍 **Key Level:** Price holding near **50-SMA** support
⚡ **Potential:** Consolidation could fuel breakout toward **\$117.5K**
**🛠 Setup:**
* **Direction:** LONG
* **Entry:** \$116,132.70
* **Stop Loss:** \$114,500 (below support)
* **Take Profit:** \$117,500
* **Size:** 1 contract (1x leverage)
* **Confidence:** 70%
* **Timing:** Market open
📌 **Why Long?**
* BTC above major moving averages — bullish trend intact
* RSI & MACD hint at possible upside momentum
* Favorable risk-reward near key support zone
⚠ **Risk Note:** Breakdown below **\$113,069** (50-SMA) flips bias bearish. Volatility can cause sharp swings — position sizing matters.
---
**#BTC #Bitcoin #Crypto #BTCUSD #CryptoTrading #Cryptocurrency #CryptoSetup #DayTrade #SwingTrade #PriceAction #CryptoSignals #TechnicalAnalysis #BitcoinPrice #BreakoutTrading #SupportAndResistance #BTCAnalysis #MovingAverages #RSI #MACD #CryptoInvesting #BullishSetup #CryptoMarket**
My Bitcoin ChartFor some time, I have noticed Bitcoin and the spy following this slightly inclined horizontal line at certain levels. Most likely their just psychological levels. I call them ghost levels.
These levels have been holding up pretty well so far.
Here's what it looks like.
STILL SHORT Similar Bias, nothing has changed. Following previous setup with moves that continue to show my outlook.

BITCOIN BTCUSD PROFITBitcoin has been respecting its trend and has shown that it will continue to the upside with, short sell opportunities before heading back upwards

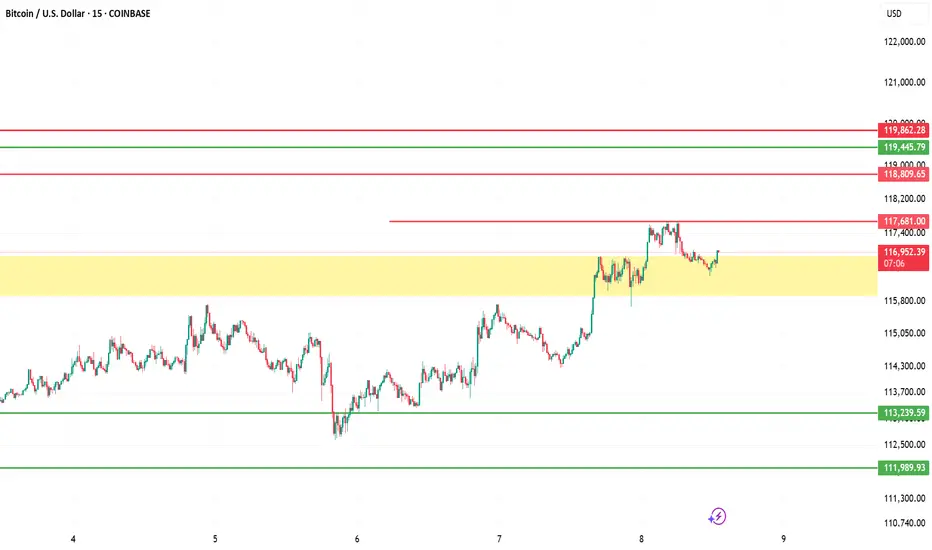
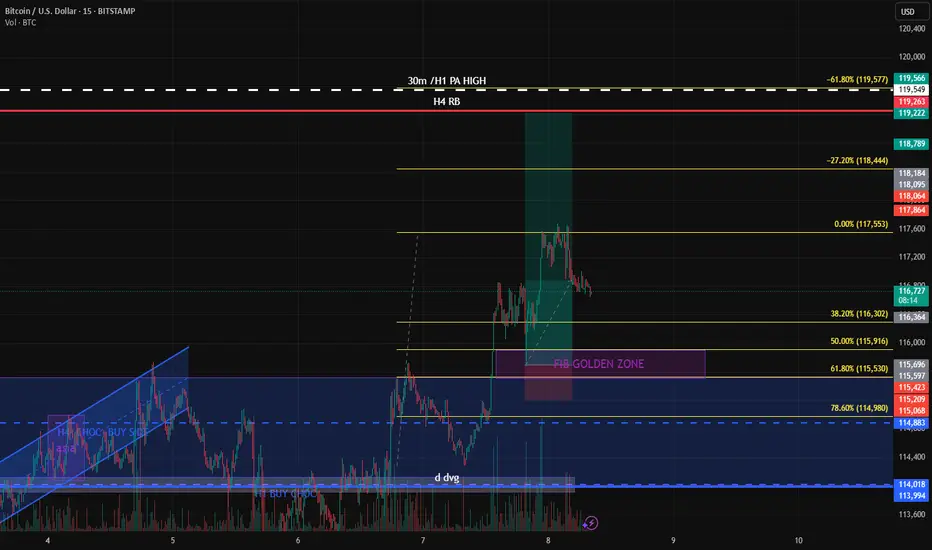
Bitcoin (BTC/USD) – 15M Chart Analysis | Aug 8, 2025
Current Price Action:
BTC is trading at $116,953, hovering inside the yellow demand zone ($115,800–$117,000), showing short-term consolidation.
Immediate Resistance:
$117,681 is the key intraday resistance; repeated rejections here signal strong seller presence before the $118,800 zone.
Support Levels:
The yellow zone’s lower boundary near $115,800 is crucial; below this, the next major supports are $113,239 and $111,989.
Momentum Outlook:
After a sharp rally, price is ranging with reduced volatility — indicating a potential breakout setup in either direction.
Trading Bias:
Bullish: Break & hold above $117,681 → targets $118,809 and $119,862.
Bearish: Drop below $115,800 → downside toward $113,239 likely.
btc ANOTHER LONG ENTRY (see chart)BTC another long entry and its targets...
my lasy BTC trade went hits target with around 3700 points do wath that too
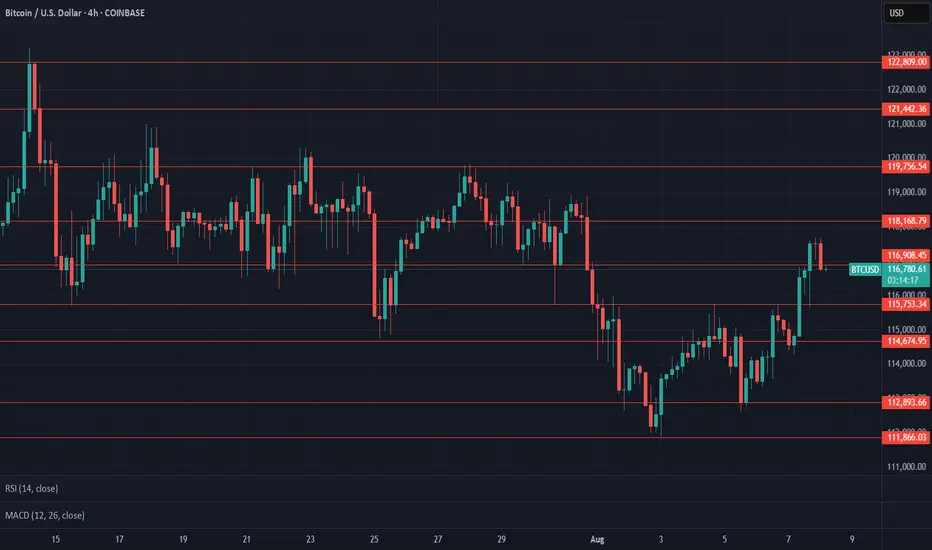
$BTC Daily Update - Short TermCRYPTOCAP:BTC $118,168 test, $116,908 support testing with weak chances of holding as previous 4H closed with bearish engulfing, expect $115,753 test if followed thru. Current support at $115,753. $118,168 resistance holding. Watch Given S/R
BTC intra? Success
Hi,
Good day.
Yest was a strong move day.
I feel there will be continuation further..
Remember you are free to decide your entries.
Will give you hints/ ideas
Ask questions to yourself okayy.
Where was the strongest point or price yest?
Don't guess it.. find it ( volume transacted )
If the price comes back to that level?
We buy or sell
May you always success & profit.
Not a guru
GOLDA quick look at yesterday price action and our setup, then we did our normal ritual of daily analysis. we are totally bearish on Gold. we will wait on price movement and validation before we eventually jump on the train for a sell


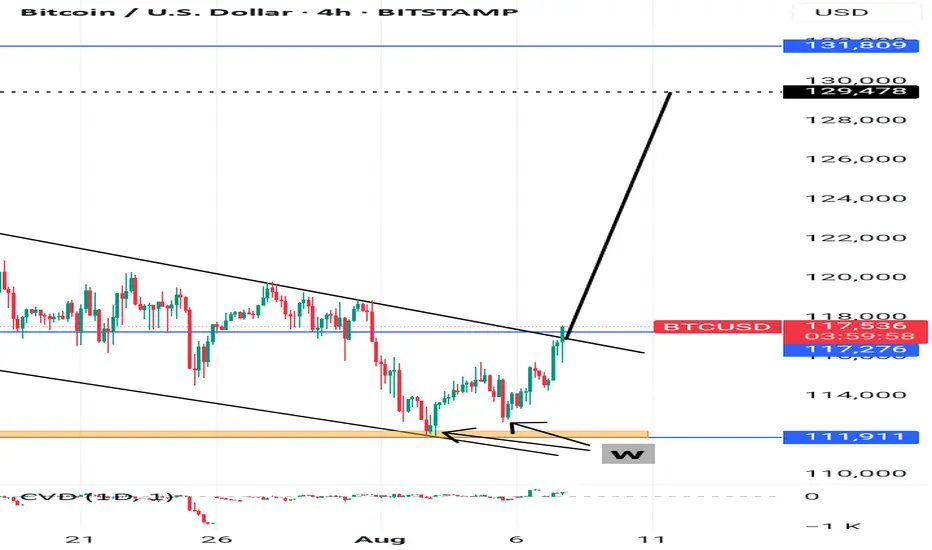
BTC BUYBtc has a lovely bullish flag and a breakout beyond 117,354 after a wonderful W formation.
The entry level being at 117,354 and the TP at 129,478.
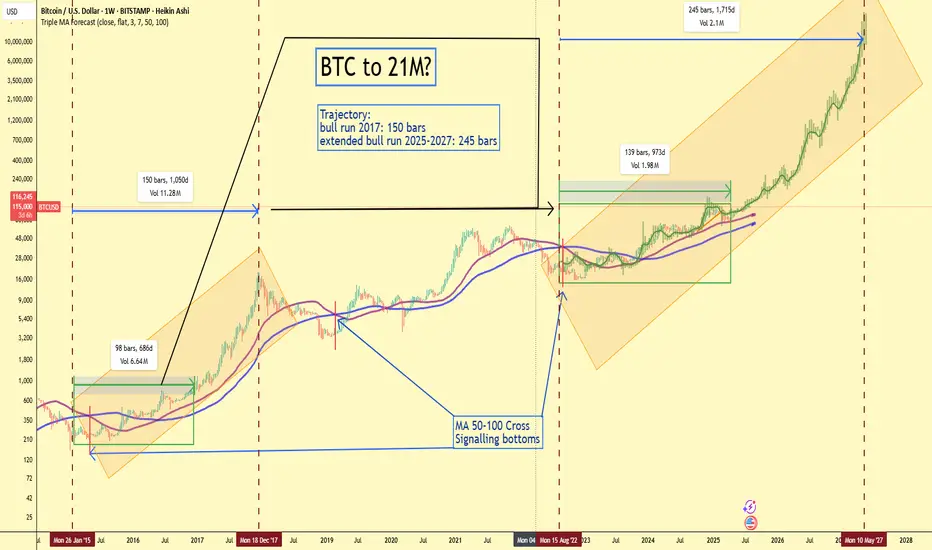
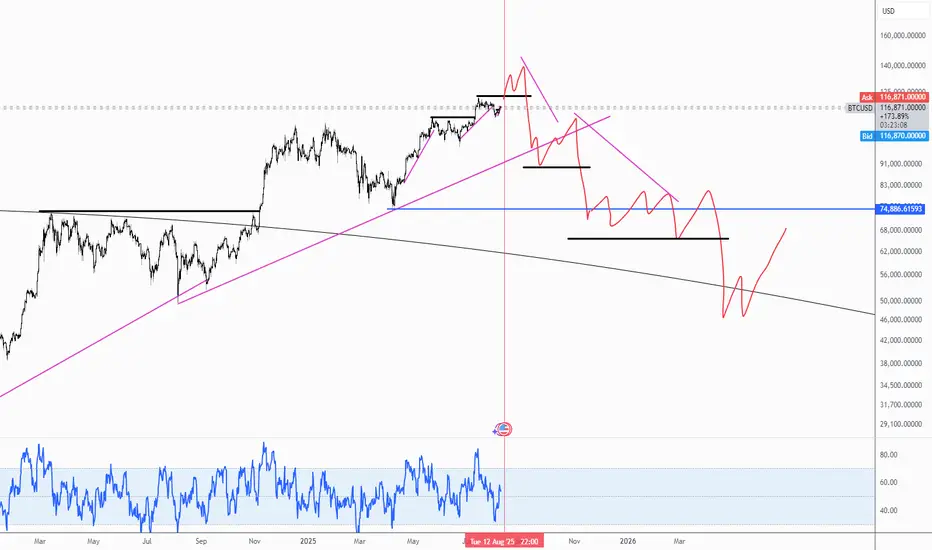
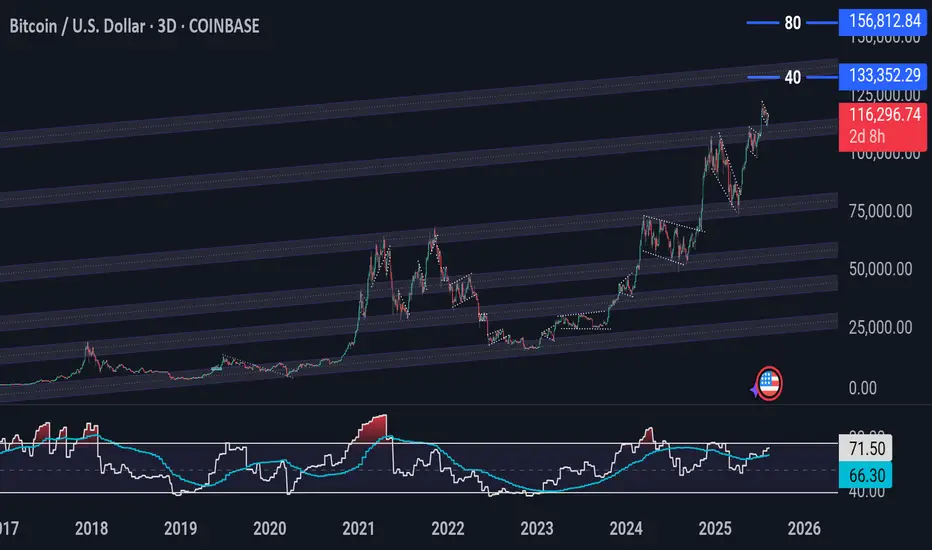
BTC to $21,000,000? Mirroring 2017 With Institutional Firepower.📈 Chart Thesis:
By duplicating the trajectory of the 2017 Bitcoin bull run and stretching it over the current cycle (2022–2027), we observe a surprisingly clean fit — both structurally and temporally.
2017 Bull Run: 150 bars (1,050 days)
Current Cycle: 245 bars (1,715 days)
Target: $21M by May 2027 (logarithmic trajectory within an ascending channel)
🧠 Technical Setup
Heikin Ashi Weekly candles show a strong parabolic continuation.
MA 50–100 cross (August 2022) signaled the macro bottom — historically reliable across cycles.
Volume profile reveals accumulation at the base of the current bull channel (similar to 2015–2016 and 2020).
Extended time window (245 bars) suggests a longer, more mature bull market compared to 2017, driven by institutional entry.
🧩 Fundamental Support for a $21M BTC
The bullish structure isn't just technical — the fundamentals are the strongest they’ve ever been:
✅ Bitcoin ETFs Approved
Spot Bitcoin ETFs (e.g. BlackRock, Fidelity) were approved in early 2024.
This unlocks trillions in institutional capital that previously had no secure gateway to Bitcoin exposure.
We’re seeing sustained inflows from IRAs, pensions, and conservative funds.
🇺🇸 Trump and Pro-Crypto Policy
Donald Trump openly endorsed Bitcoin during his 2024 campaign and has called it "America’s last defense against CBDCs."
His “401(k) Bitcoin bill” allows Americans to allocate retirement savings into BTC via regulated products (ETFs & trusts).
This could redirect hundreds of billions in retirement funds toward BTC.
💼 Michael Saylor’s Corporate Bitcoin Standard
MicroStrategy, led by Saylor, has doubled down — now holding over 250,000 BTC.
His strategy is being mimicked by mid-sized firms and even nation-states.
The corporate treasury narrative is back in full force — and this time, institutional CFOs have regulatory clarity.
🔗 Scarcity Meets Demand
With the 2024 halving behind us, daily issuance is now less than what MicroStrategy alone buys monthly.
Combine this with ETF demand and sovereign interest: the available float is evaporating.
As the final 2 million BTC approach circulation, the “digital gold” thesis becomes “digital diamond.”
🎯 The Case for $21 Million BTC
Some say $1M BTC is the ceiling — but consider this:
Global M2 money supply: Over $100 trillion.
Gold market cap: ~$14 trillion.
Global real estate & debt: >$600 trillion.
A $21 million Bitcoin price would give BTC a ~$420 trillion market cap — absurd at first glance, but not if BTC becomes the base layer collateral of the digital economy.
As fiat confidence erodes, a neutral, incorruptible, programmable monetary asset will gain exponential value.
🕰 Timeline Alignment
MA cross and macro bottom: August 2022
Consolidation and early breakout: 2023–2024
ETF & political momentum: 2024–2025
Acceleration and final parabolic phase: 2026–2027
Peak projection: May 10, 2027
🚀 Conclusion: Bitcoin’s Final Form?
This is not just a chart projection. It’s a convergence of:
Perfect technical structure,
Historical precedent,
Unprecedented institutional alignment,
Political support,
And hyper-monetary demand.
$21M sounds impossible… until it becomes inevitable.
🔗 Follow for updates as this cycle unfolds.
🧠 Stay irrationally rational.