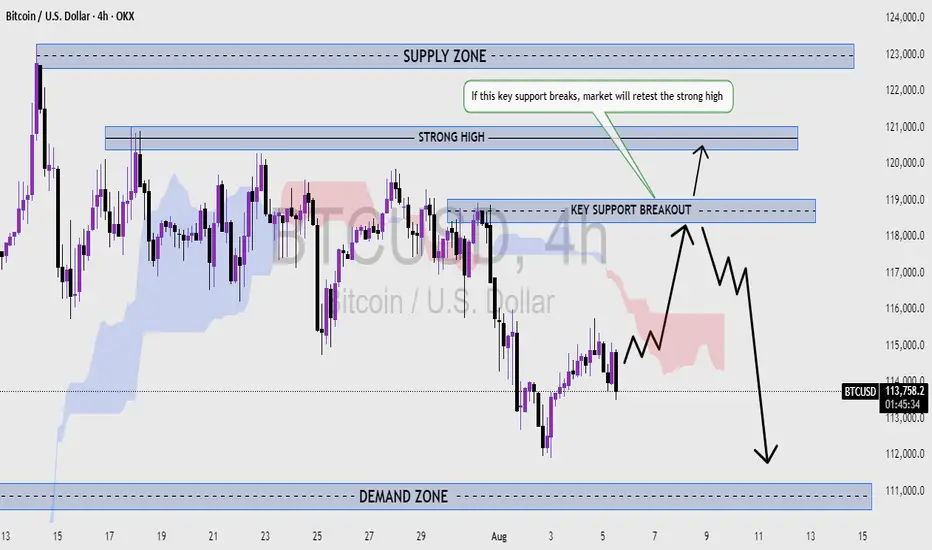
BTC/USD - KEY SUPPORT BREAKOUT IN FOCUS!Bitcoin is currently trading near a critical support level, and price action is setting up for a decisive move.
📉 Bearish Scenario (Primary Bias):
Key support at ~$117,800 has broken, signaling a shift in market sentiment.
If the breakdown holds, we could see a strong bearish continuation toward the demand zone around $111,000.
Price may retest the broken support before the next leg down.
📈 Bullish Scenario (Alternate):
If buyers regain control and reclaim the broken support, BTC could retest the strong high at $120,700, and possibly push toward the supply zone near $123,000.
🔎 Structure Highlights:
Supply Zone: $122,000 – $123,000
Demand Zone: $110,000 – $111,500
Key Resistance/Support: $117,800
Strong High: ~$120,700
📌 Watch Closely:
Price behavior on the retest of the broken support
Bearish confirmation for downside continuation
Bullish reclaim for short-term recovery
A decisive move is near – be ready for both scenarios with tight risk management!
BTCETH.P trade ideas
Charting Synesthesia🏛️ Research Notes
There are known phenomena in physics that continues to remind me about markets, which partially influenced my perception of price action and reflected in topology.
In space, speed itself doesn’t cause discomforts — only acceleration does. In markets, trend direction isn’t what stresses traders, it’s the rate of change (volatility spikes, momentum surges). A slow, constant uptrend can feel comfortable, but sudden thrusts (news shocks, liquidity squeezes) presses them against the seat.
No matter how hard you accelerate, you can’t exceed light speed. Markets also have practical velocity limits such as liquidity constraints, margin requirements, volatility halts which contribute to proportions in movements). Beyond certain speeds, moves become self-limiting because liquidity providers back away or exchanges impose breakers.
Aberration of Light → Focus Shift in Market Attention
As you accelerate, stars seem to shift forward in view. In markets, as momentum builds, your perception of what matters narrows. What I mean is liquidity, news, and setups ahead dominate, while the “sky behind” (past fundamentals or long-term signals) fades. The market narrative contracts into a single front-facing beam: what’s next, not what’s past.
Doppler Effect → Price Action Distorts Information
Moving away from Earth, you see time slow down behind you; moving toward something, time speeds up. In markets, when price runs away from fundamentals, old data feels stale and irrelevant (red-shifted). In fast rallies or panics, information feels accelerated and urgent (blue-shifted) — traders act as if the clock is ticking faster. (Has nothing to do with the color gradient I use on chart.)
Terrell–Penrose Rotation → Illusion
At high speed, objects don’t look contracted, they look rotated due to delayed light arrival. In markets, patterns rarely appear exactly as the textbook shows because we’re always looking at “delayed” sentiment. What looks like a simple breakout might just be a rotated perspective of deeper structure.
Time Dilation → Compression of Trading Horizon
Travelers age slower, as from their view, a distant journey seems shorter. In markets, when immersed in high-frequency movement, traders experience time compression (dozens of opportunities in minutes). From outside (a swing trader’s view), that same period looks like a small blip in a larger trend.
Length Contraction → Path Shortening During High Momentum
Near light speed, distances shrink in the direction of travel. In markets, when momentum is extreme, the “distance” to a target level (Fibonacci, prior high) feels shorter, so price reaches it much faster than normal expectation.
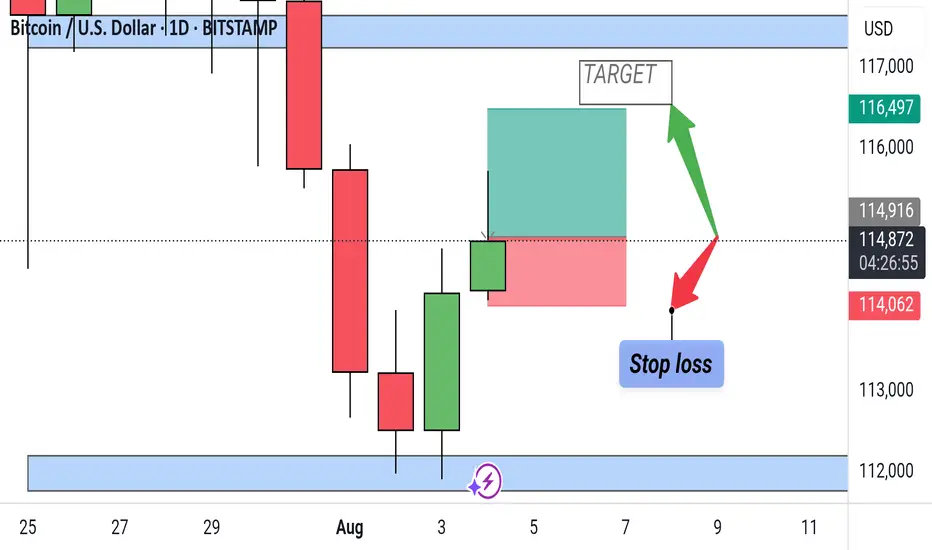
Bitcoin Bullish Reversal Setup – Daily TimeframeBTC/USD Daily Chart Setup
Price shows a bullish reversal from a demand zone, forming a potential long setup. Entry is near $114,873 with a target at $116,497 and a stop loss below $114,062. Green candle confirms buyer strength after previous downtrend.
BTCUSD Short-Term ScenariosIn this video, I have explained why I believe that in the short-term I expect bitcoins price to correct to 107000-108000 zone before gaining power and momentum to see new ATH. Note that the invalidation levels explained in the video are to be closely monitored.

BTCUSD Short (Update)BTCUSD is still short at this time. Summer has arrived in USA and Europe and the markets are stuck for a good directional trend.
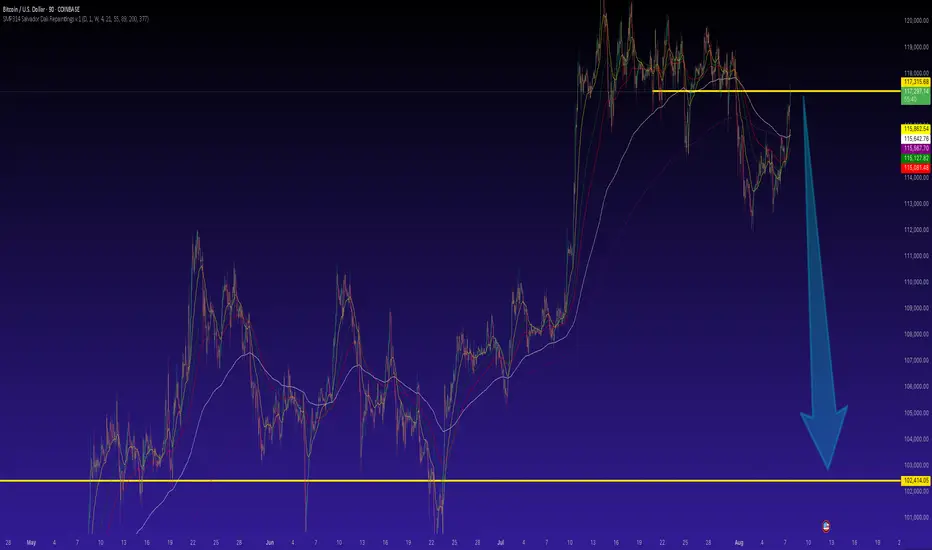
Thus saith the Crypto-Profit Prophet BTCThus saith the Crypto-Profit Prophet:
Mount Sinai Pivot Points
– As Moses beheld the tablets, so do we mark Bitcoin’s sacred highs. At 117,315, the seventh commandment of resistance is engraved—our signal to unsheathe the short sword.
Oracle of On-Chain Sentiment
– From the urn of wallet flows and the scrolls of Twitter prophets, we divine that greed waxes fat. When murmurings declare “the Promised 100K,” we take heed and prepare to descend.
Genesis Candle Filter
– On the third day Bitcoin created the candles, and only those closing on the weekly Sabbath (Friday close) bear true witness. Any mid-week heresy is swept away like chaff in the wind.
Noah’s Flood Volume Veil
– When trading volume swells beyond 20,000 “ark-ounces”, the floodgates open. Such deluges portend the great deluge of price—and baptize our position in profits.
Parting of the Red Sea Trend Confirmation
– We draw trendlines as Moses drew the sea: from the High of Deliverance to the High of Exile to the High of Redemption. Once that “Red Sea Downtrend” parts before us, we march forth into the bearish wilderness.
Divine Execution Plan:
Enter Sell BTC/USD: 117,315
Heavenly Stop: 120,000 (beyond the Mount Hermon Summit)
Promised-Land Target: 102,414
Go forth and multiply thy gains—lest the locusts of leverage lay waste!
Bitcoin - The cycles are playing out!⚔️Bitcoin ( CRYPTO:BTCUSD ) just repeats another cycle:
🔎Analysis summary:
Following all of the previous all time high breakouts, Bitcoin will now further extend the rally. After some simple calculation, we can see that Bitcoin will rally another +50% in order to reach the overall price target. However there will be volatility along the way so make sure to remain calm.
📝Levels to watch:
$200.000
SwingTraderPhil
SwingTrading.Simplified. | Investing.Simplified. | #LONGTERMVISION

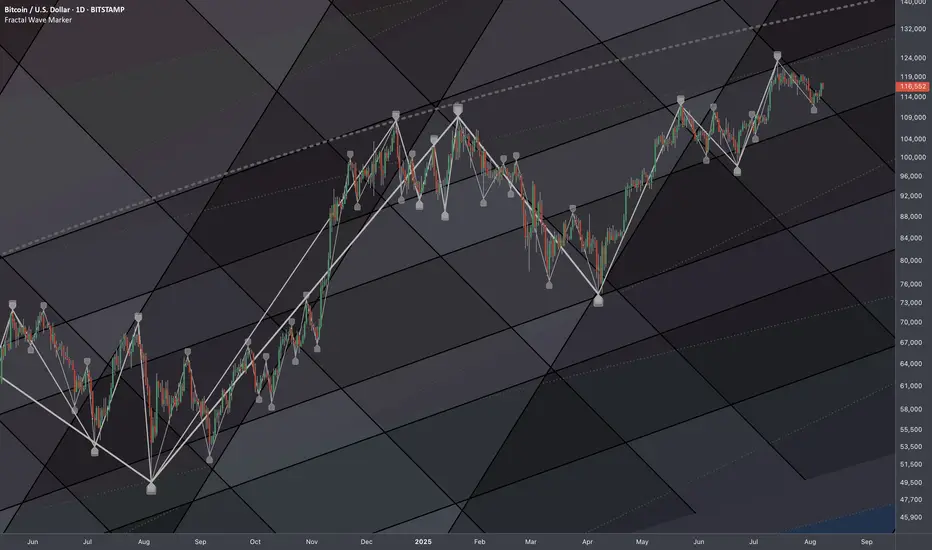
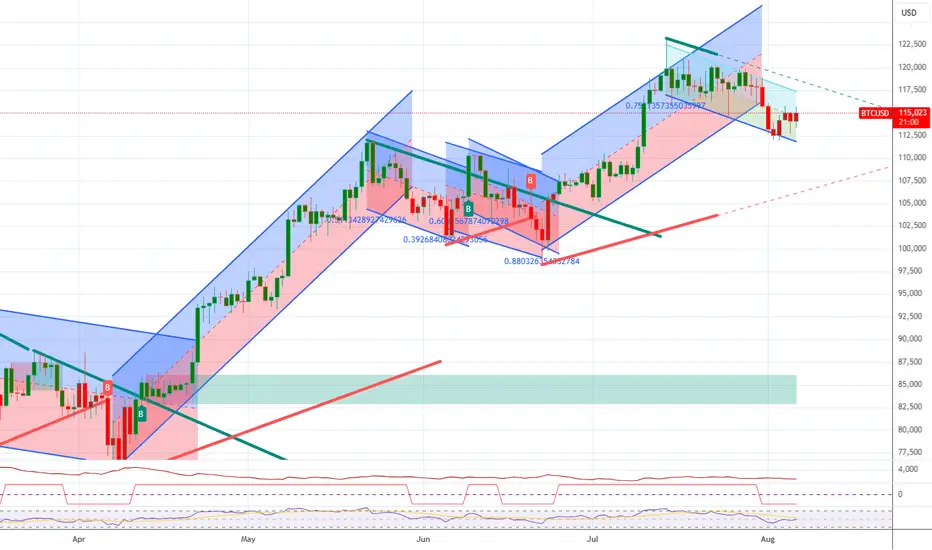
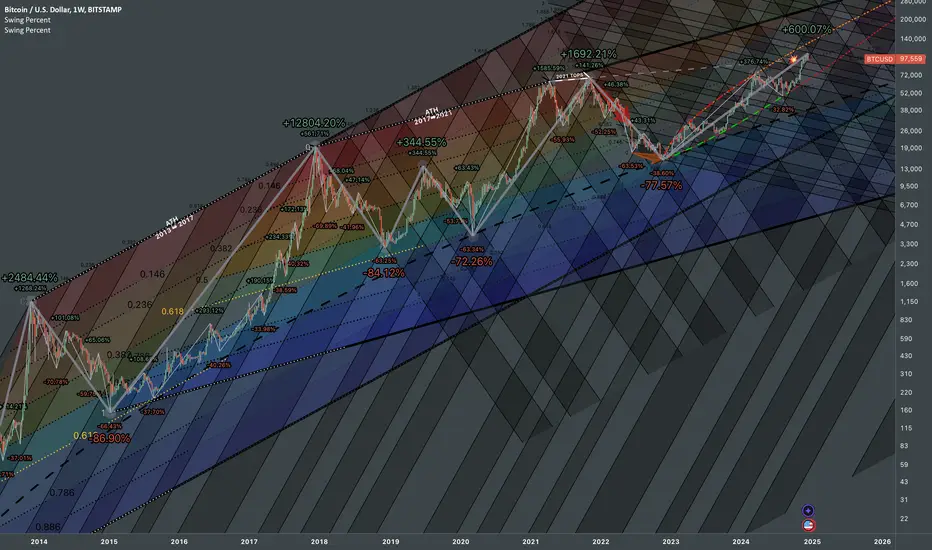
Bitcoin: Interconnectedness of Defining CyclesJust a followup analysis on scalable structure from "Natural Patterns & Fractal Geometry" ed idea.
Additional Regularities:
2018 Downtrend Phase Fib Resonation:
Fibonacci ratios are not just mathematical abstractions; they manifest in Bitcoin's market structure due to human behavior and market psychology.
2020 Uptrend Phase Fib Resonation:
Unconventional use of Fibonacci ratios highlights areas where price has shown significant reactions. These levels act as dynamic support and resistance zones, underscoring the fractal and cyclical nature of Bitcoin's price movements.
2021 - Late 2022 Crash Metrics More detailed breakdown of emerging randomness:
The repetitive alignment of market cycles with Fibonacci levels underscores Bitcoin's tendency to oscillate between predictable extremes, offering insights for timing entries and exits.
Distinct cycles are clearly visible, separated by major tops (e.g., ATH in 2013, 2017, and 2021) and bottoms (e.g., the 84.12%, 72.26%, and 77.57% corrections). Each cycle adheres to Fibonacci retracement and extension levels, demonstrating a self-similar structure .
Price expansions align with Fibonacci extensions (e.g., 1.618 and beyond), showing that Bitcoin’s growth phases are not random but rather guided by harmonic principles.
The ascending channels mapped through Fibonacci ratios capture both the bullish and corrective phases, showcasing the market's bounded yet fractal rhythm .
The percentage swings (+2484.44%, +12804.20%, +1692.21%, +600.07%) highlight the explosive nature of Bitcoin during expansion phases, followed by steep corrections. These as well align with Fibonacci proportions, providing a blueprint for market rhythm.
BTC Long – Bullish Divergence 1H Looking for long from 114300 zone
1H chart showing bullish divergence
also price broke short downtrend with nice momentum
Timeframe: 1H
Entry: 114300
Target (TP): 116850
Stop (SL): 111700
Only sharing my view, not any financial advise, thx

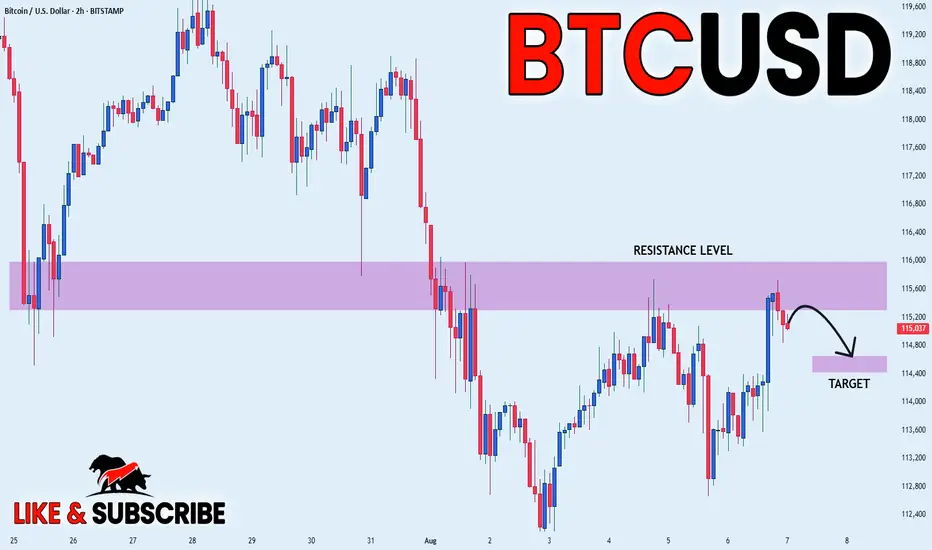
BITCOIN PULLBACK FROM SUPPLY AREA|SHORT|
✅BITCOIN price grew again
To retest the resistance of 116k
But it is a strong key level
So we are seeing a bearish reaction
And we will likely see a
Further bearish move down
SHORT🔥
✅Like and subscribe to never miss a new idea!✅
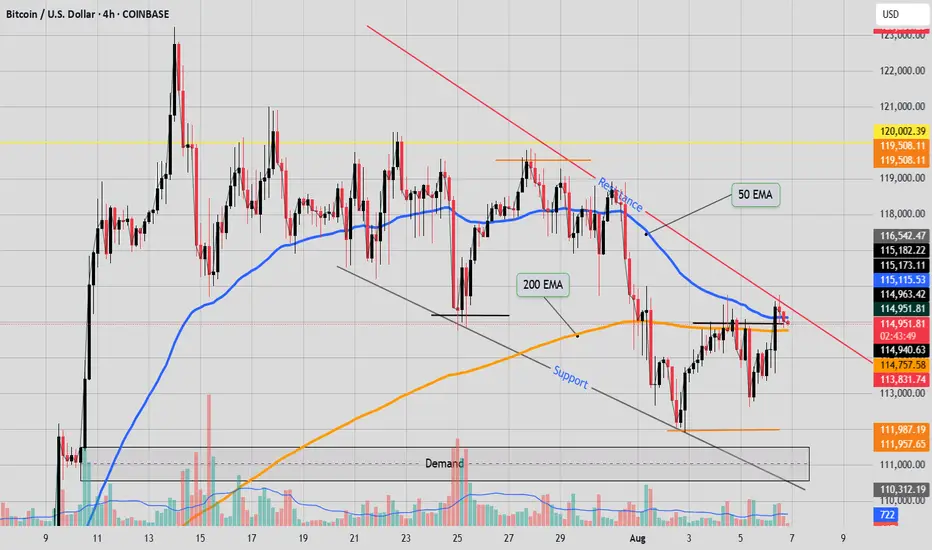
Breakout neededtechnical analysis (TA) on this Bitcoin/USD 4-hour chart highlights several key elements:
- **Trendlines & Structure**: There is a prominent descending red trendline marking current resistance, showing that price has been consistently rejected at lower highs.
- **Moving Averages**: the plotted the 50-period (blue) and 200-period (orange) moving averages. The price recently attempted to break above both, which typically signals a test of momentum; however, rejection suggests bearish pressure still dominates.
- **Support & Resistance**: Horizontal levels are marked for resistance (~115,173-115,114) and support below (~113,832). These zones align with previous price reactions.
- **Demand & Supply**: the labeled demand zone between roughly 110,312 to 111,957, where buying interest has previously stepped in, evidenced by higher trading volumes in that area.
- **Volume**: Enhanced volume is seen around the demand zone, supporting its strength. Decreasing volume during recoveries hints at weakening buyer conviction on upswings.
- **Market Structure**: Price is trading under the major moving averages and below both the structural resistance and trendline, indicating bears remain in control unless a breakout occurs above these levels.
In summary, the chart analysis conveys that Bitcoin is still in a bearish structure, struggling to regain momentum above key resistance and trendlines, with strong demand only expected in the lower highlighted box. Bulls need a decisive breakout above the descending red trendline and major moving averages to shift the narrative. (Perplexity and me)
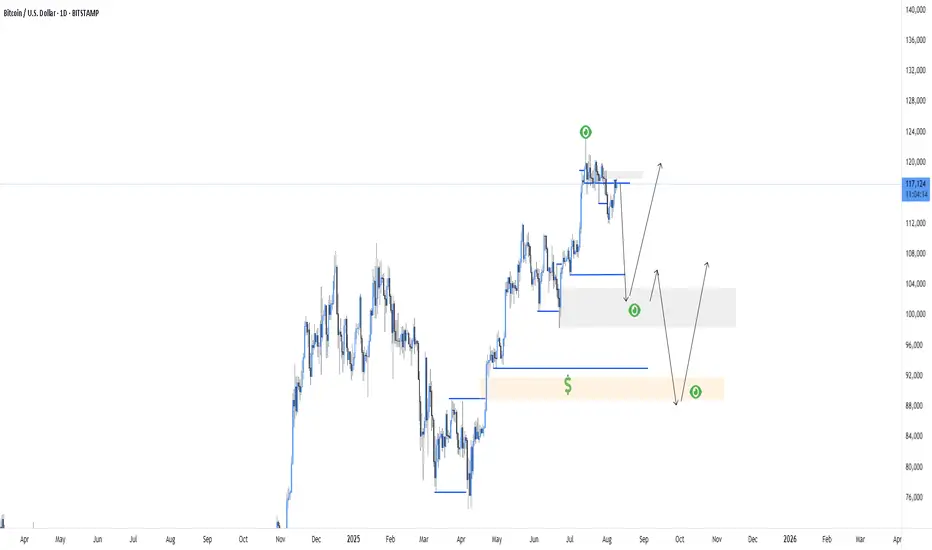
Title: BTC/USD – Short-Term Liquidity Play Using CRT & Turtle SoAnalysis & Trade Plan:
On the higher time frame, BTC remains in a broader bullish structure but recently formed a consolidation range after printing new highs. During the last impulsive leg, we saw a break of structure that created a short-term low, followed by another high. This sequence has left unprotected liquidity sitting below the market.
Above price, we recently swept a prior high, triggering my Turtle Soup (TBS) criteria — a false breakout designed to trap breakout traders before reversing. This aligns with my Central Reference Theory (CRT) expectation of price reverting to internal liquidity before resuming a larger move.
My plan is to capitalize on the short-term liquidity grab by entering short only after confirmation of a re-entry into the CRT zone. I will use Fair Value Gaps (FVGs) as precision entry and target zones.
Execution Steps:
1. Trigger: Liquidity sweep above the recent high (Turtle Soup confirmation).
2. Entry: After price closes back inside CRT reference levels and taps into the nearest FVG on the lower time frame.
3. Stop Loss: Just above the liquidity sweep high.
4. Target 1: Short-term low created after the last break of structure.
5. Target 2: Deeper liquidity pool in the 92k zone, overlapping with higher-timeframe demand and an unmitigated FVG.
Risk Management:
• Position size based on a 1–2% risk allocation.
• Partial profits at Target 1 to reduce risk exposure and secure gains.
• Let remaining position run toward Target 2 if price continues into the deeper liquidity pool.
Market Logic:
• The recent high sweep is a liquidity trap that often signals the start of a short-term reversal.
• Unprotected lows below are magnets for price, especially when aligned with imbalance zones.
• This setup combines liquidity theory, market structure, and imbalance fills for a high-probability short-term play within a larger bullish context.
Crypto-specific:
#BTC #Bitcoin #BTCUSD #CryptoTrading #CryptoAnalysis
Strategy-specific:
#PriceAction #LiquidityHunt #OrderBlock #SmartMoneyConcepts #ICTTrading
General trading exposure:
#Trading #Forex #DayTrading #SwingTrading #TechnicalAnalysis
Elliott Wave Science: Bitcoin Steadily Chases $400KAfter some back and forth, I have located the needed confirmations to find high confidence that Bitcoin stretches toward the $400K mark by September-December 2026. I will continue to track the waves day by day, week by week, while applying the unbiased science of Elliott Wave Theory.
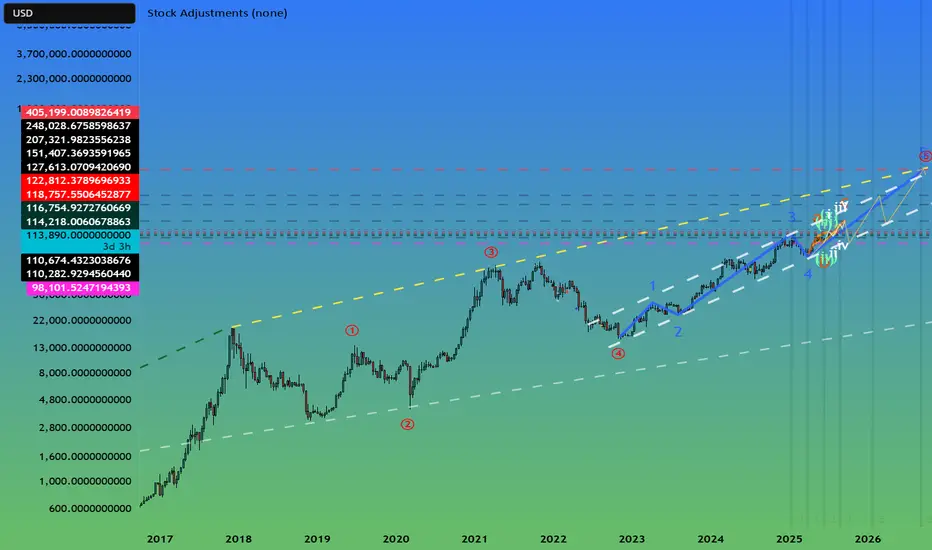
BTC Faces Rejection at POC – Trendline Retest LikelyBTC appears to be getting rejected at the POC (Point of Control) levels, suggesting a potential retest of the trendline in the coming week before the uptrend continues. However, even if the rally resumes, the price action may form a choppy, diagonal structure rather than a clean impulsive wave.
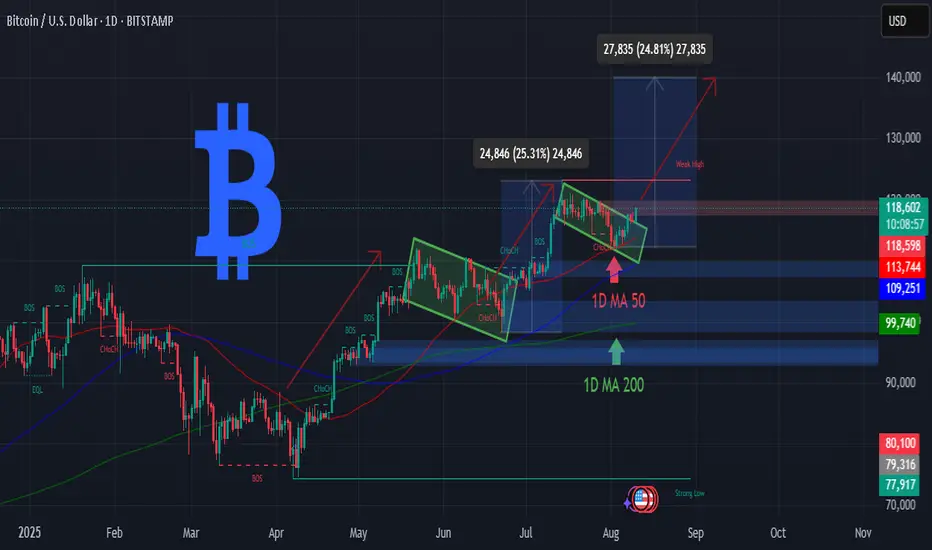
BTC BOUNCED 1D MA50 BTC DAILY
3 candles 🔒 holding tight, price ready to explode from top of Channel Down! Break this channel = Bull Flag confirmed, just like May-June!
MACD bullish cross loading… but 1/3 can be traps — stay sharp! ⚠️
🎯 Targets:
• $140K short-term 🚀
• $148K medium-term 🚀🚀
This move is LOADED — don’t blink!
Subscribe ✍️, share 🙌 & join the hype wave NOW!
Bitcoin Range for August?Historically August has been a tough month for crypto in the past with mostly flat to negative returns. For that reason, although not a perfect science, I would not be surprised if we see a rangebound environment continuation for BTC.
So what would that look like? Structurally there are three thirds to the range, currently price is looking to break through into the upper third after bouncing off the bottom third bullish orderblock.
Trade setups will naturally present themselves as rotational plays both bullish and bearish at the extremes of each of the thirds but much larger trades from the range top and bottom.
Altcoins are lagging behind BTC structurally so where BTC has been choppy for a few weeks, most large cap alts have hit their highs and are now looking to settle into a range before the next leg up.

BTC 1D OBV shows deviation, reclaim and bounce. Higher!Bitcoin CRYPTOCAP:BTC 1D OBV shows deviation, reclaim and bounce. Higher!
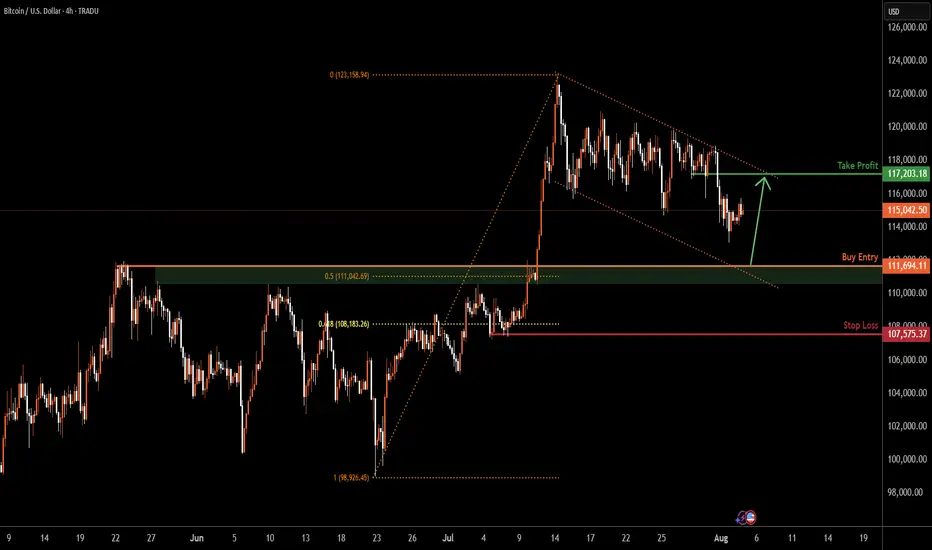
BITCOIN H4 | Bullish bounce offBTC/USD is falling towards the buy entry, which is a pullback support that is slightly above the 50% Fibonacci retracement and could bounce from this level to our take profit.
Buy entry is at 111,694.11, which is a pullback support that is slightly above the 50% Fibonacci retracement.
Stop loss is at 107,575.37, which is a pullback support that is slightly below the 61.8% Fibonacci retracement.
Take profit is at 117,203.18, which is a pullback resistance.
High Risk Investment Warning
Trading Forex/CFDs on margin carries a high level of risk and may not be suitable for all investors. Leverage can work against you.
Stratos Markets Limited (tradu.com ):
CFDs are complex instruments and come with a high risk of losing money rapidly due to leverage. 65% of retail investor accounts lose money when trading CFDs with this provider. You should consider whether you understand how CFDs work and whether you can afford to take the high risk of losing your money.
Stratos Europe Ltd (tradu.com ):
CFDs are complex instruments and come with a high risk of losing money rapidly due to leverage. 66% of retail investor accounts lose money when trading CFDs with this provider. You should consider whether you understand how CFDs work and whether you can afford to take the high risk of losing your money.
Stratos Global LLC (tradu.com ):
Losses can exceed deposits.
Please be advised that the information presented on TradingView is provided to Tradu (‘Company’, ‘we’) by a third-party provider (‘TFA Global Pte Ltd’). Please be reminded that you are solely responsible for the trading decisions on your account. There is a very high degree of risk involved in trading. Any information and/or content is intended entirely for research, educational and informational purposes only and does not constitute investment or consultation advice or investment strategy. The information is not tailored to the investment needs of any specific person and therefore does not involve a consideration of any of the investment objectives, financial situation or needs of any viewer that may receive it. Kindly also note that past performance is not a reliable indicator of future results. Actual results may differ materially from those anticipated in forward-looking or past performance statements. We assume no liability as to the accuracy or completeness of any of the information and/or content provided herein and the Company cannot be held responsible for any omission, mistake nor for any loss or damage including without limitation to any loss of profit which may arise from reliance on any information supplied by TFA Global Pte Ltd.
The speaker(s) is neither an employee, agent nor representative of Tradu and is therefore acting independently. The opinions given are their own, constitute general market commentary, and do not constitute the opinion or advice of Tradu or any form of personal or investment advice. Tradu neither endorses nor guarantees offerings of third-party speakers, nor is Tradu responsible for the content, veracity or opinions of third-party speakers, presenters or participants.
BTC AnalisysI just wonder how it will turn out!
I think if BTC can't break the support line I drew (the "red line"), it will be bullish.
But if BTC breaks the support, the bullish session will end.
It's not a good time to buy BTC.
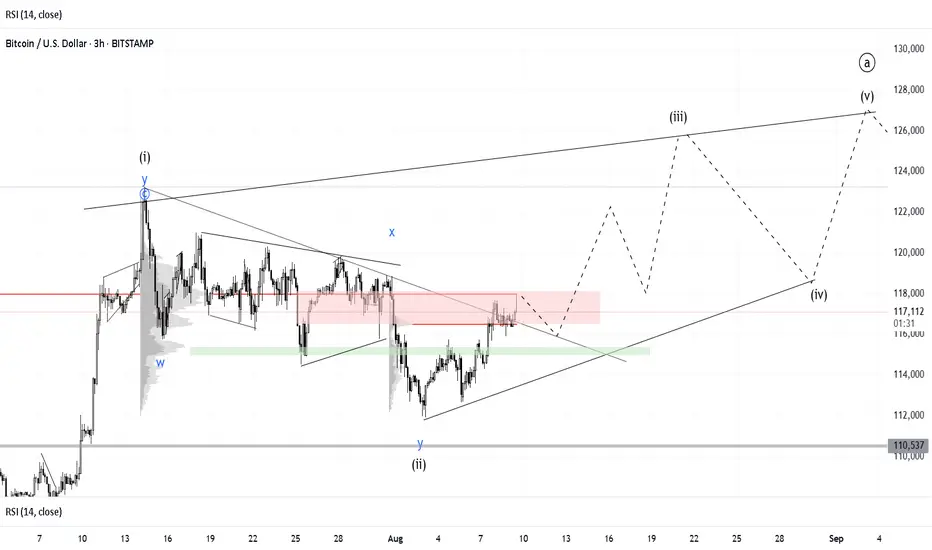
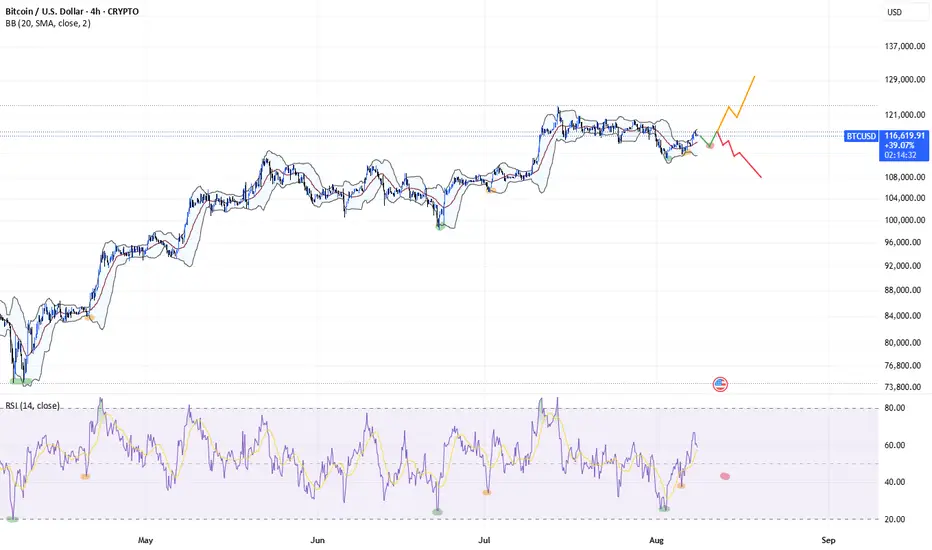
Bitcoin PA next 5 days, where to next?Hi everyone,
This is my first trading idea. So, because this is the internet, feel free to criticize me in the comment section
Before we get into the short term probabilities of Bitcoins price action, let's briefly discuss / lay out certain events and correlate them to the 4hr view.
Going back to April 7th / 8th of this year, we had a 4hr oversold level on the RSi + PA which marked the local bottom of what was back then the first digestion by financial markets linked to Trumps tariffs.
23rd / 24th of June of this year, we had again a 4hr oversold level on the RSi + PA which again marked the local bottom of what as the climax of ISRAEL/IRAN conflict.
Since then we had the movement up to 118.7k then short pause and a sharp run to 123.1k.
During that time, our beloved boy Saylor tweeted "short Bitcoin if you hate money!"
If you were smart enough to realise that every time this guy posts he then proceeds to quietly offload on you, then you made some nice short gains.
Anyway, back to what most of us came here for - the short term TA perspective.
We have yet again had an event which gave financial markets a reason to unload on our heads (de risk and clean up the overextended long leveraged positions) following the Jobs report data news, which sent BTC to 111990usd area. This so far yet again posted a 4hr oversold RSi + PA and gave a bounce. Because after all, this is also previous ATH retest zone.
Later we had ISM Services PMI data, this again sent the markets into a tiny spin sending BTC to 112500usd area. Notice how the price was almost at same level as during the wick to 111990usd but RSi was notably higher?
I guess, my overall point is - in this manipulative uptrend (which isn't truly bullish really) so far, when BTC touched 4hr oversold conditions and shortly after Rsi makes higher lows, price doesn't revisit that same level again. Market digests the bad news faster than most think.
Now, on the chart I am sharing, you can see the 4hr oversold PA and RSi highlighted with a green color, the orange color for the higher low. The red color, is where I think price / rsi might go again. So maybe we retest 113.5 - 114k zone but then bounce from there to the upside.
We all trade with a certain bias, up / down or sideways.
Personally, I am trading with a bullish bias, but I also use intraday RVOL indicator, OBV and CVD (aside from PA & RSi) to confirm market intent. Tensor charts also useful to understand the orderbook a bit better.
I believe that in the next 5 days we (roughly speaking) go up from here with potential retests of the lower side of the previous FVG around 114k. Of course, if price can't stay above 115k by Sunday close, then GGs, this would likely imply short term distribution.
If we close above 115k, preferably towards 117k area, the chances of revisiting 111k will drop significantly.
Unless our dear MM friends decide to trick us again ( lol).
Final words - if this is a true bull market - we aren't revisiting 111k for a while. And if you read Arthur Hayes 100k Bitcoin call short term - then remember where he comes from.
Stay safe out there.
Also, for full transparency , I've already opened a Bitcoin long 50x at 115650usd with 2501usd margin and 4.9k usd collateral (lol!), held through this 111.9k wick and not ready to give up now.
The long I have opened, is active since 25/07/2025 and eating 70usd per day in fees. So far that's already 1k usd in fees paid.
Then again, for most this is poor risk management, but let's see.
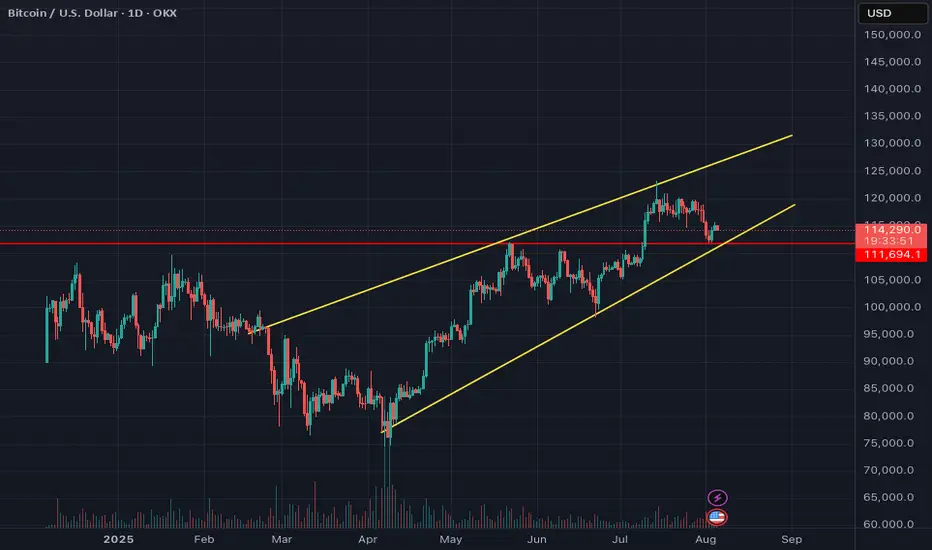
BTCUSD – Heading Towards Lower Support?Hello everyone, what are your thoughts on BTCUSD?
BTCUSD is currently trading around 113,92, moving within a clear downward price channel. It seems like the price could continue to decline as the coin moves toward the lower boundary of the channel.
If conditions remain favorable, I expect 110,000 to be tested in the short term.
What do you think? Do you expect BTCUSD to keep heading lower, or will it bounce back? Let me know your thoughts below!

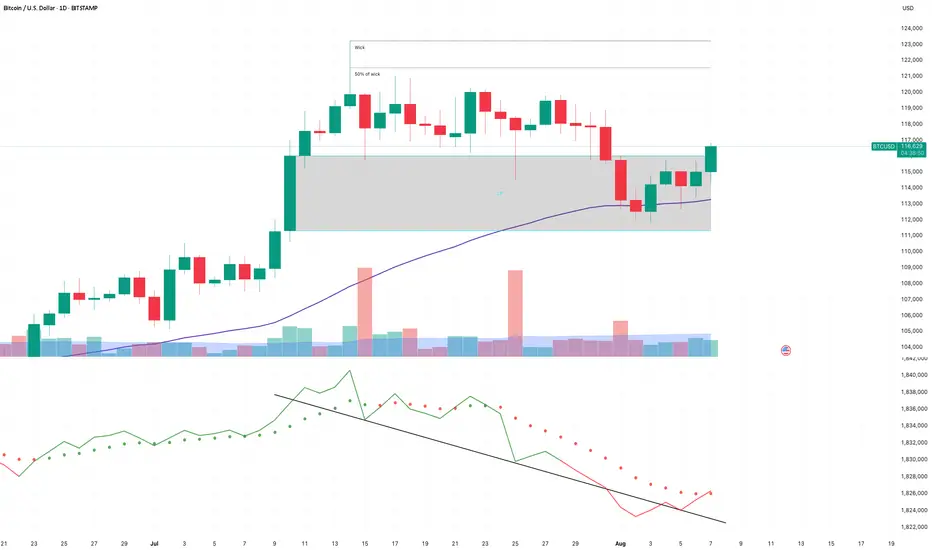
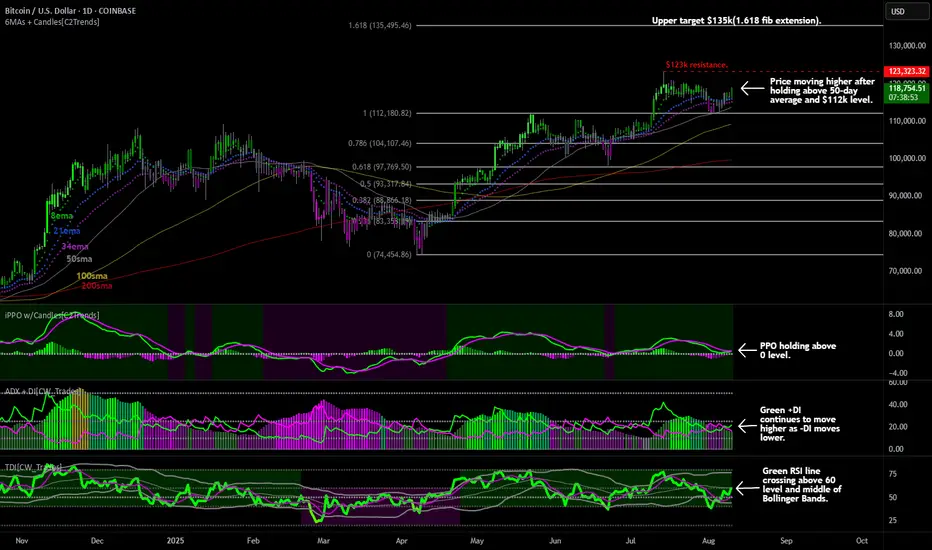
Bitcoin $123k All-Time High Re-Test on DeckBitcoin is moving higher this weekend and is up $4k from the post last week highlighting the bullish outlook after price held above the previous resistance level of $112k and the 50-day average. $112k looks to be the new floor now and the chart is holding true to "previous resistance becomes support". Target to watch for here is still the new all-time high resistance level of $123k. Should traders push price above that level, the 1.618 fibonacci extension at $135k is the next price level that I'm watching for.
Lower chart indicators are turning more bullish as price marches up to that $123k level:
The PPO indicator is still showing the green PPO line and purple signal line holding above the 0 level which indicates that price still has long-term bullish momentum. For short-term momentum to turn more bullish we need to see the green line cross above the purple line.
The ADX indicator shows the green +DI line still moving higher and above a declining -DI line which indicates short-term bullish strength behind this move higher. Need to see the background histogram continue to move higher and cross above the 25 level as a sign that price strength is flipping bullish in the intermediate to long-term.
The lower TDI indicator shows the green RSI line rising and crossing above the 60 level which indicates long-term bullish price trend. The green RSI line is also crossing above the middle Bollinger Band and into the upper half of the bands which is bullish for price as well.
Overall, outlook remains bullish here for Bitcoin as long-term fundamentals continue to strengthen with tail winds such as more buying by treasury companies-and new companies announcing treasuries-and the Executive Order signed by Trump last week allowing 401k's to offer Bitcoin to customers. That may take a year or two before we actually see 401k's announce that crypto assets are available to clients, but it definitely increases the bullish case for buying and holding here as new money is destine to flood into Bitcoin in the coming years.
Keep stackin' those Sats.
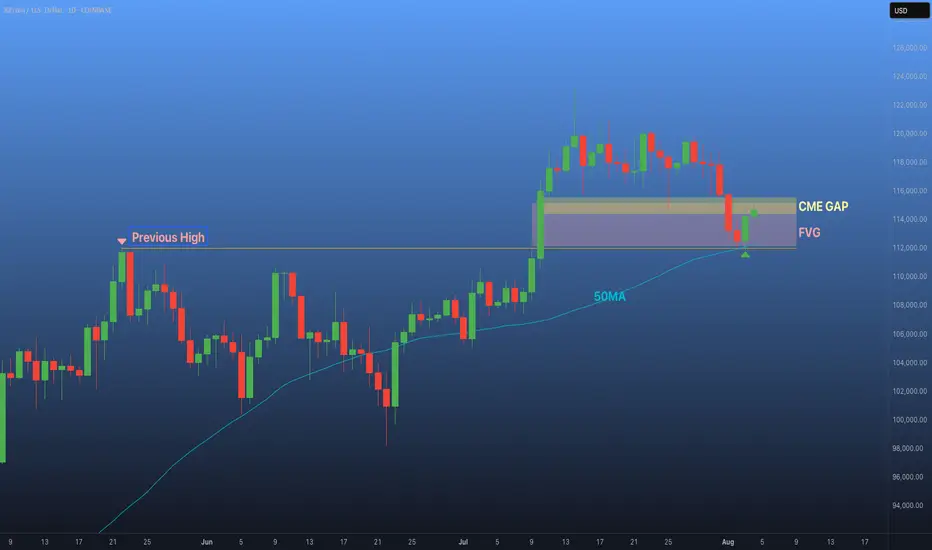
BTC - THIS IS THE END !?I didn’t want to jump to conclusions, so I waited for the NY open to see how the market would react — and so far, things don’t look bad at all. 🤔
Yeah, that previous-week correction wasn’t fun, but honestly, it’s perfectly healthy price action.
Thanks to that sharp drop, #Bitcoin managed to:
✅ Fully close the CME gap ;
✅ Fill a pretty large FVG ;
✅ Cleanly retest the previous high ;
✅ Perfectly touch the 50-day MA — which has historically sparked solid moves.
Sure, it was unpleasant. Sure, things didn’t go exactly as planned. 🤷♂️
But is this the end? Absolutely not. We haven’t even reached any of the typical panic points yet.
I think on the LTF we’ll dip once more to shake out early longers — then we’ll continue upward. 🐋