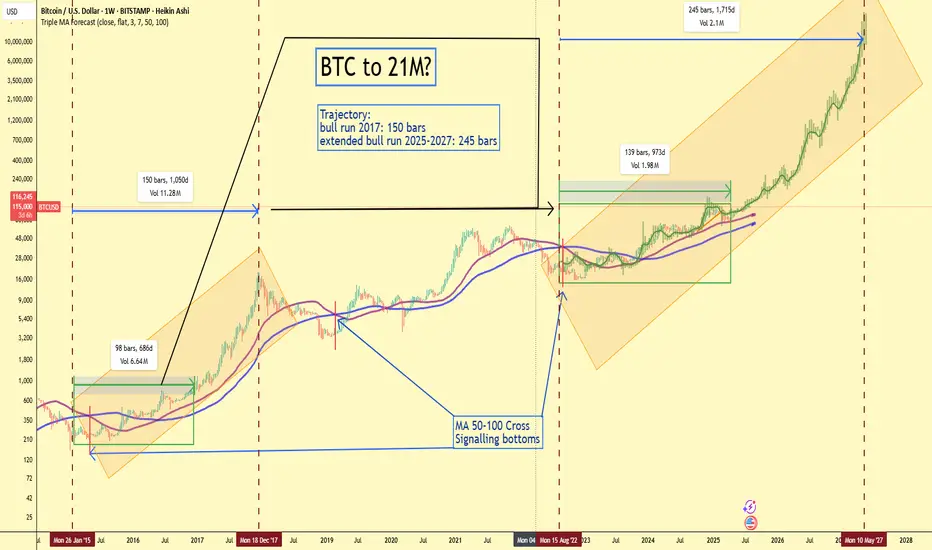
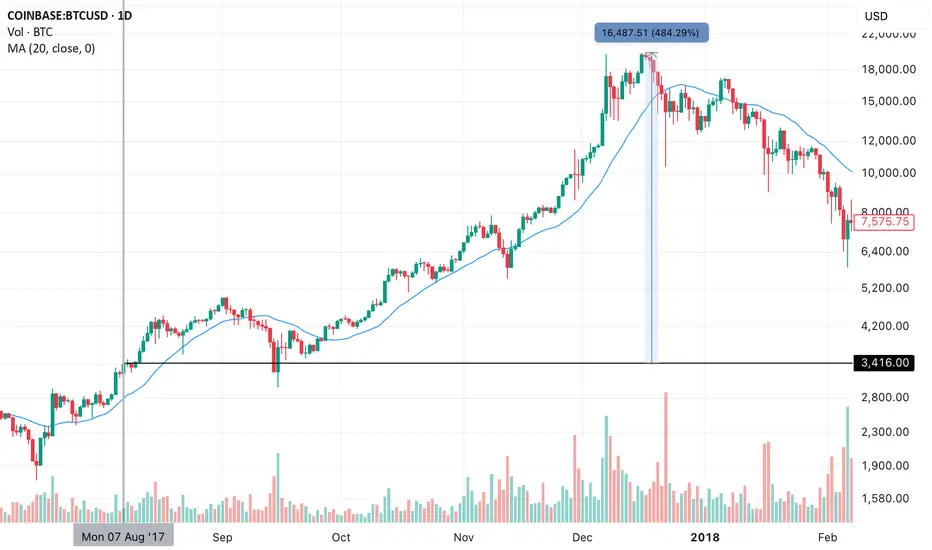
BTC to $21,000,000? Mirroring 2017 With Institutional Firepower.📈 Chart Thesis:
By duplicating the trajectory of the 2017 Bitcoin bull run and stretching it over the current cycle (2022–2027), we observe a surprisingly clean fit — both structurally and temporally.
2017 Bull Run: 150 bars (1,050 days)
Current Cycle: 245 bars (1,715 days)
Target: $21M by May 2027 (logarithmic trajectory within an ascending channel)
🧠 Technical Setup
Heikin Ashi Weekly candles show a strong parabolic continuation.
MA 50–100 cross (August 2022) signaled the macro bottom — historically reliable across cycles.
Volume profile reveals accumulation at the base of the current bull channel (similar to 2015–2016 and 2020).
Extended time window (245 bars) suggests a longer, more mature bull market compared to 2017, driven by institutional entry.
🧩 Fundamental Support for a $21M BTC
The bullish structure isn't just technical — the fundamentals are the strongest they’ve ever been:
✅ Bitcoin ETFs Approved
Spot Bitcoin ETFs (e.g. BlackRock, Fidelity) were approved in early 2024.
This unlocks trillions in institutional capital that previously had no secure gateway to Bitcoin exposure.
We’re seeing sustained inflows from IRAs, pensions, and conservative funds.
🇺🇸 Trump and Pro-Crypto Policy
Donald Trump openly endorsed Bitcoin during his 2024 campaign and has called it "America’s last defense against CBDCs."
His “401(k) Bitcoin bill” allows Americans to allocate retirement savings into BTC via regulated products (ETFs & trusts).
This could redirect hundreds of billions in retirement funds toward BTC.
💼 Michael Saylor’s Corporate Bitcoin Standard
MicroStrategy, led by Saylor, has doubled down — now holding over 250,000 BTC.
His strategy is being mimicked by mid-sized firms and even nation-states.
The corporate treasury narrative is back in full force — and this time, institutional CFOs have regulatory clarity.
🔗 Scarcity Meets Demand
With the 2024 halving behind us, daily issuance is now less than what MicroStrategy alone buys monthly.
Combine this with ETF demand and sovereign interest: the available float is evaporating.
As the final 2 million BTC approach circulation, the “digital gold” thesis becomes “digital diamond.”
🎯 The Case for $21 Million BTC
Some say $1M BTC is the ceiling — but consider this:
Global M2 money supply: Over $100 trillion.
Gold market cap: ~$14 trillion.
Global real estate & debt: >$600 trillion.
A $21 million Bitcoin price would give BTC a ~$420 trillion market cap — absurd at first glance, but not if BTC becomes the base layer collateral of the digital economy.
As fiat confidence erodes, a neutral, incorruptible, programmable monetary asset will gain exponential value.
🕰 Timeline Alignment
MA cross and macro bottom: August 2022
Consolidation and early breakout: 2023–2024
ETF & political momentum: 2024–2025
Acceleration and final parabolic phase: 2026–2027
Peak projection: May 10, 2027
🚀 Conclusion: Bitcoin’s Final Form?
This is not just a chart projection. It’s a convergence of:
Perfect technical structure,
Historical precedent,
Unprecedented institutional alignment,
Political support,
And hyper-monetary demand.
$21M sounds impossible… until it becomes inevitable.
🔗 Follow for updates as this cycle unfolds.
🧠 Stay irrationally rational.
BTCETH.P trade ideas
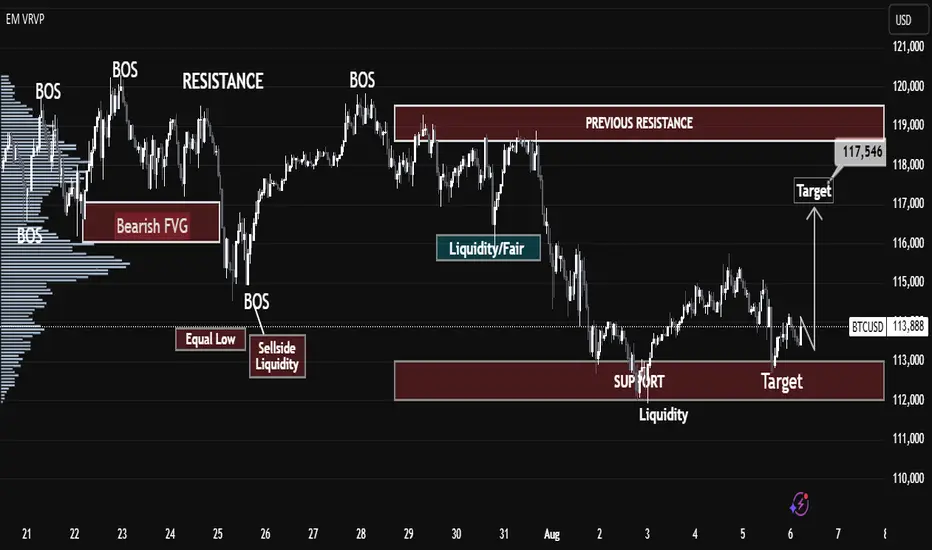
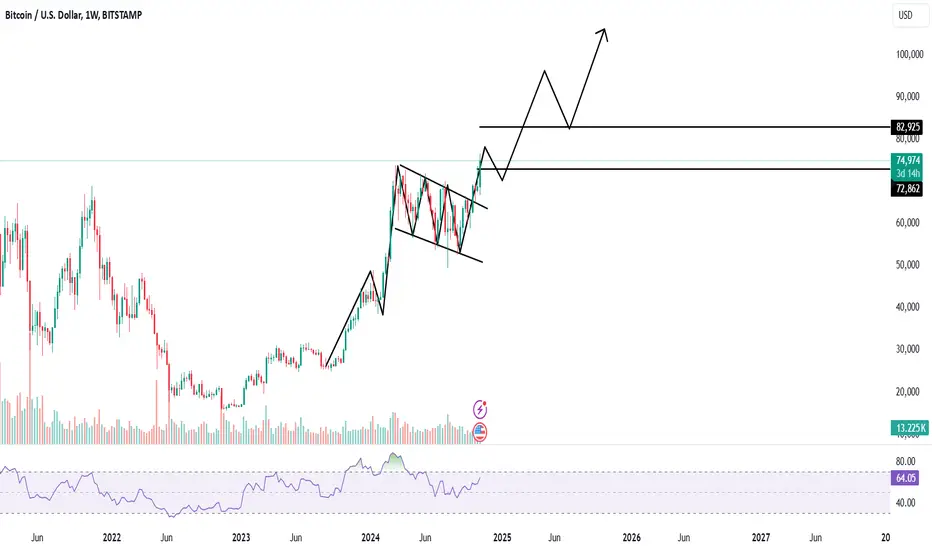
"BTCUSD Technical Outlook: Support Holds, Bulls Aim for $117K""BTCUSD Technical Outlook: Support Holds, Bulls Aim for $117K"
Market Structure Overview
BOS (Break of Structure): Multiple BOS points indicate strong shifts in market direction, confirming both bullish and bearish trends across different zones.
Bearish Fair Value Gap (FVG): This zone, marked after a BOS on July 23–24, acted as a rejection area, initiating a sharp sell-off — a classic bearish imbalance fill and reversal.
Equal Lows & Sell-side Liquidity: This area attracted liquidity grabs, as smart money hunts resting stop losses below these equal lows before reversing direction.
🔸 Key Supply & Demand Zones
Previous Resistance Zone (~118,000 - 120,000): Price rejected this area after filling the imbalance, confirming it as a strong supply zone.
Support Zone (~112,000 - 113,000): Currently acting as a high-probability demand zone. Liquidity accumulation here suggests a possible bullish reversal.
📉 Liquidity Zones
Sell-side Liquidity Sweep: Price dipped below equal lows to collect liquidity, often a signal of institutional accumulation.
Liquidity/Fair Value Zone (~116,000): Acts as a magnet for price, offering potential retracement targets before any major trend continuation.
📈 Forecast & Target
Current Price: $114,061
Short-term Target: $117,546 — aligning with previous FVG imbalance and liquidity zone.
Bias: Bullish Reversal expected from support zone toward the previous inefficiency and resistance levels.
🎓 Educational Takeaways
BOS Confirmation is critical in validating trend shifts and structure breaks.
FVGs (Fair Value Gaps) highlight inefficiencies and offer high-probability reversal or continuation zones.
Liquidity Sweeps near equal lows/highs often precede smart money moves — useful for spotting entries and exits.
Volume Profile (left side) suggests higher activity zones — these areas often align with major turning points.
✅ Conclusion
BTCUSD has swept liquidity below support and is showing signs of reversal. If the bullish pressure holds above $113,000, a move toward the $117,500 zone is likely, targeting previously unfilled imbalance and trapped liquidity.
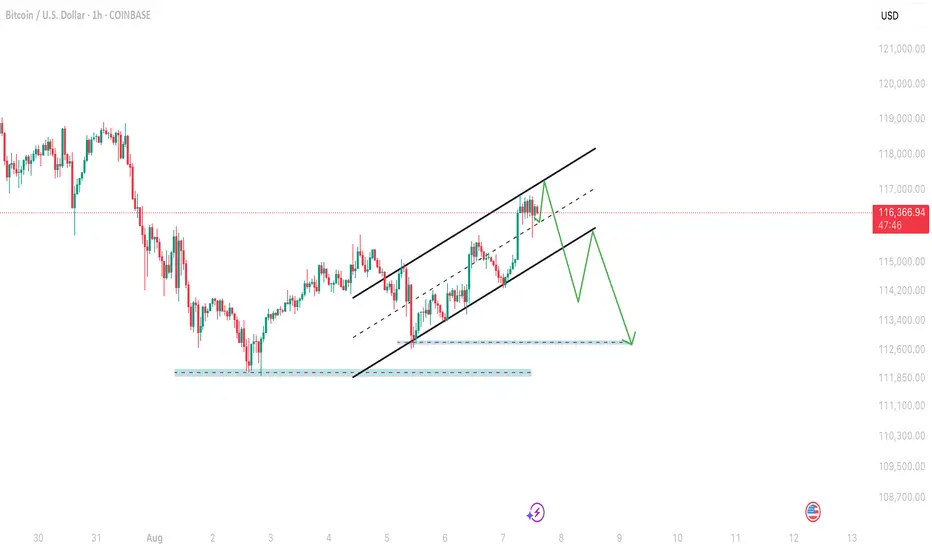
BTC 1H AnalysisAs you can see BTC moving in 1H Channel and making flag so the pole will to toward 111800$ target according to my analysis so according to me BTC is short time bearish while longterm BTC is superbullish.
Possible moveAny analysis can be wrong.
But I have this idea in the short term.
First corrective target: 109,000 to 108,000
Then there is a possibility of a continuation of the move below 100,000 !

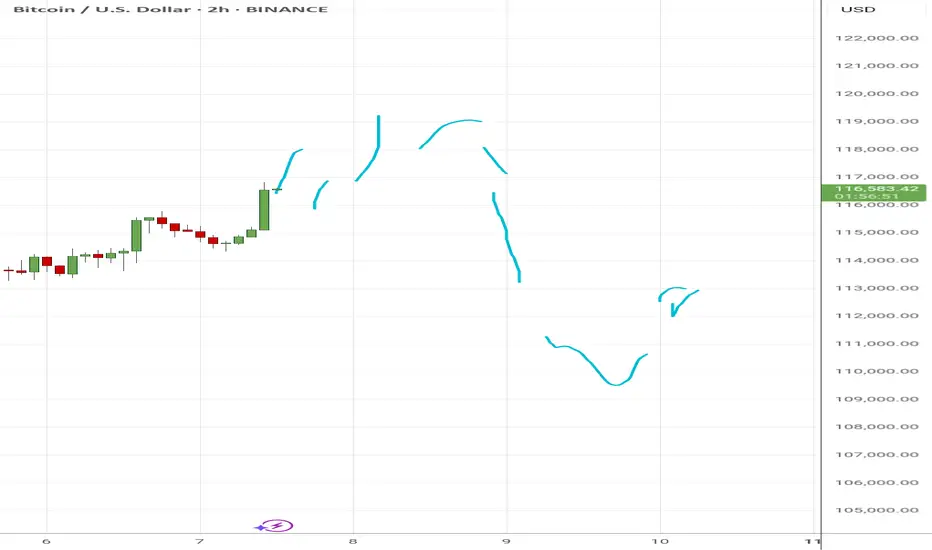
BTC to 119k
Bitcoin has already managed a small breakout, retest, and now off to the races again. Back up to previous levels.
Look for what happens at the 119k level. If BTC gets rejected we'll be back down to these levels.
If BTC can break through the 120k level, look for a small leg up, before a retest to 120k (now as support) then off to test the all time high.

BTC? continuation...
Hi
Hope you're having a good run too.
Lets do a little analysis
1 data: push up with volume.
2 data: reverse with less volume.. ( meaning.. the buyer was serious.. and there were less sellers )
I could conclude : |my 2c|
still in uptrend
buy di
slowly (if you had missed/sold some)
All the best
Not a guru
Bitcoin bullish momentum ending very soon...Past Cycle Behavior:
Bitcoin showed strong bullish momentum in the past.
Many positive news updates came for Bitcoin and blockchain.
Despite this, Bitcoin completed its cycle and dumped for 13 months.
Current Market Situation (2025):
Bitcoin is now completing a 33-month bullish cycle in October 2025 (similar to past trends).
RSI divergence is forming, which often signals a trend reversal.
Again, positive news is coming for Bitcoin, just like before.
Time Cycle Theory in Trading:
Time cycles often work in financial markets, repeating past patterns.
However, this does not guarantee future price movements.
Risk Management (Important for Beginners):
Always set a Stop Loss (SL) to protect your capital.
Never risk more than 2% of your total trading balance on a single trade.
Even if the analysis is strong, market conditions can change anytime.

Bitcoin Flag pattern aim towards 100k
Second scenario BTC aim for 100k
In first scenario we see that RSI divergence and last time 70% retracement
but last time it's not flag pattern
So what you think, trade with SL and proper risk management.
Feeling the charts, BTC forecast for August 7, 8, and 9, 2025.I am engaged in extrasensory stock charts, that is, feeling the energy of the future chart, this is a meditative technique, and the sensations are mainly tactile.
The forecast for August 7, 8, and 9 is generally depicted on the chart, UTC time. There will be upward impulses on August 7 and in the first half of August 8, however, by the end of August 8, a downward movement will begin almost until the second half of August 9. The downward movement will be strong.
At the moment, I am not analyzing the prices, only paying attention to the price movement impulses. I consider my forecast to be good if the outline of the real chart matches the outline of the chart I drew as a forecast, meaning that the direction and time period of the price movement are correctly indicated.
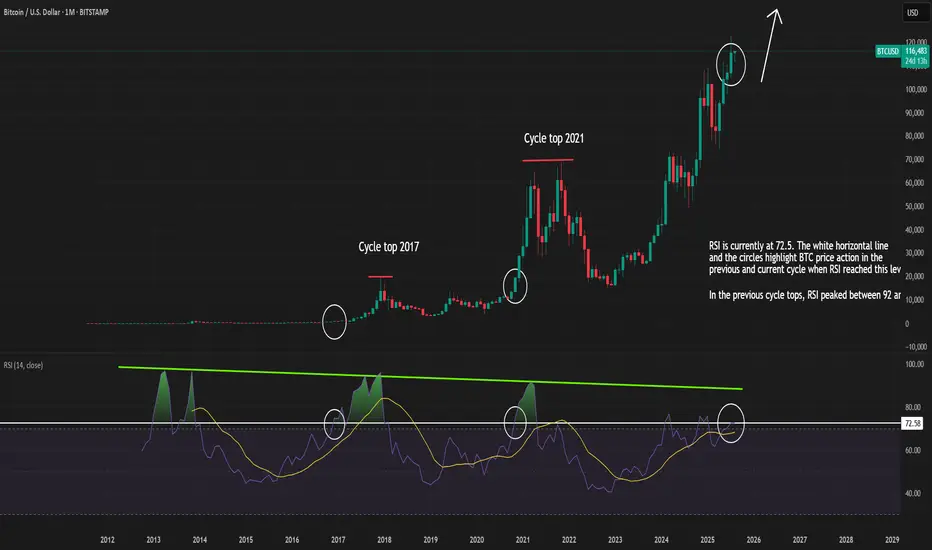
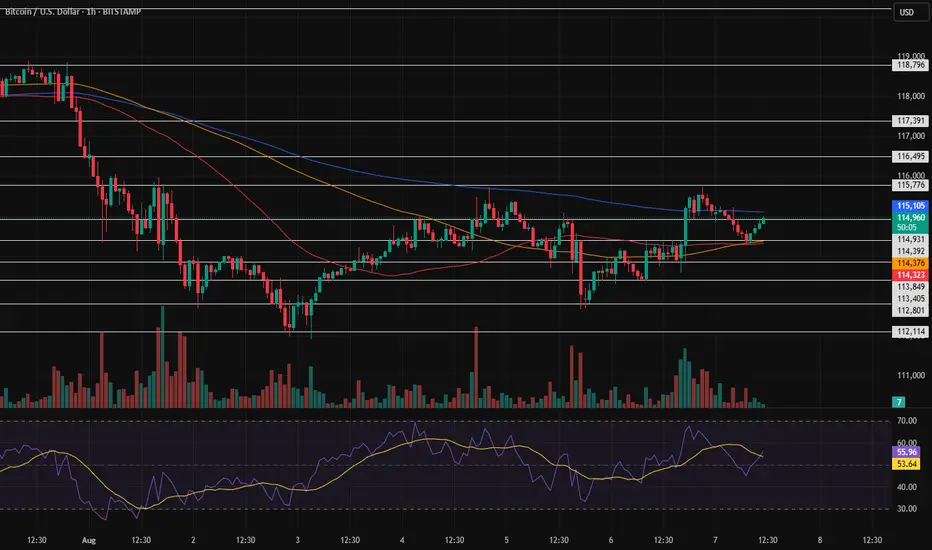
BTC and the RSI at the monthly chartGuys, take a look at BTC on the monthly chart.
It’s interesting—if you look at previous cycles, when the monthly RSI was at the same level as it is now, we weren’t even close to a cycle top. (I'm using BITSTAMP for this since it gives the clearest view of historical price action.)
From what I can see, the cycle top will probably land somewhere around RSI 90–95 on the monthly. If we take a more cautious approach, maybe in the 90–92 range.
(Of course, this is based on historical price action, and as we've discussed, this cycle could play out differently. Still, I think it's reasonable to expect at least some repeating patterns. And obviously, RSI alone isn’t something we can fully rely on.)
BTC?
Hi,
I wish to see you guys at the top.
Always wishing you the best of trades.
We lost some heros at the bottom. They fought for us. Fairly.
My resistance level for these 2 days are:
115200 and 115600
All the best
Not a guru
Waiting for confirmation of $114,000According to the previous analysis where we expected the price to reach \$117,000, our outlook still stands. If the price confirms this level and reaches back to 115,800, it indicates a bullish tendency. We need to wait for confirmations from the market.
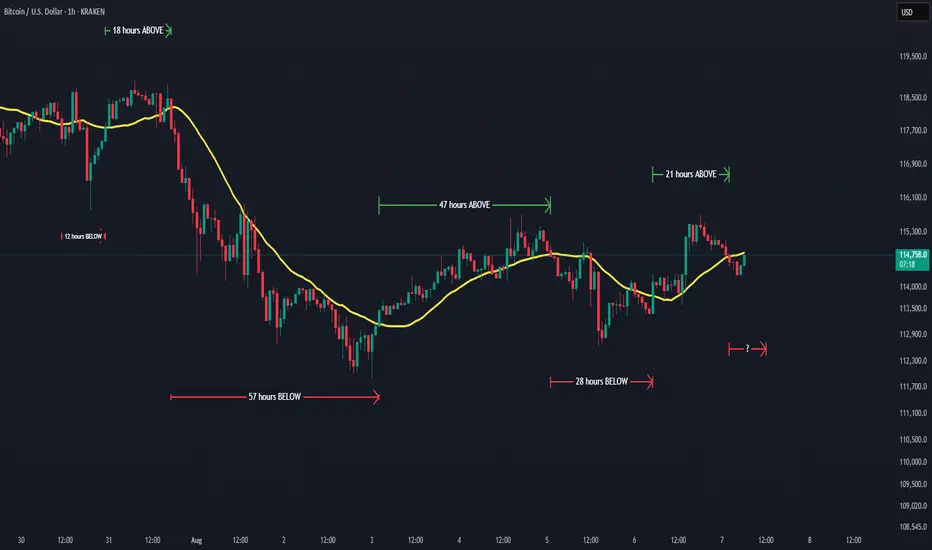
Easy chart to figuring out Bitcoin's daily sentiment.Hourly chart using the 21 SMA.
The yellow moving average is the key to figuring out if Bitcoin will be rising or falling in the next few hours.
This chart helps to illustrates when an uptrend or downtrend is about to begin or end.
When price breaks ABOVE the yellow line, Bitcoin should have a RISE in price for approximately 12-60 hours.
And when price breaks BELOW the yellow line, Bitcoin should have a FALL in price for about 12-60 hours.
Traders may think this is a lame chart, but it comes in handy when markets are down and you're wondering when is the price ever going back up.
I first look at the number of hours price action has been under the yellow line.
I feel between 16-20 hours is the norm.
Then I watch for a break and candle close above the 21 SMA.
This usually indicates the trend maybe reversing to the upside.
And yes sometimes there's fake outs.
And the same is true when Bitcoin is rallying.
When price falls and closes a candle below the yellow line, there's a possibility Bitcoin will start experiencing a downtrend.
Psycologically rise in prices don't feel like they last that long.
But if you look at this chart, price staying above the 21 SMA is about equal to the number of hours price stays below the 21 SMA.
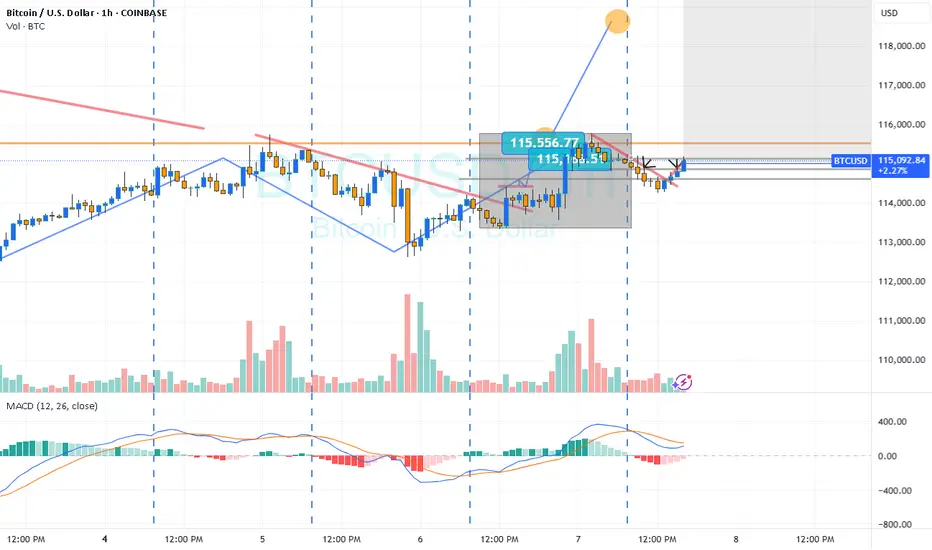
BTCUSD 1H – Liquidity Hunt & Bullish Reversal from POIBTC currently sits under key resistance near the OB (Order Block) zone. After a short-term CHoCH, price is expected to seek liquidity below Day Low and into the marked POI zone.
Here's the potential setup:
🔻 Price may dip below intraday support to clear weak lows
🔄 From POI zone, bullish reversal expected with targets at upper OB
🔹 Bearish Bias remains valid unless structure breaks cleanly above Day High
📌 Ideal trade path: liquidity sweep → reaction from POI → push to Day High or OB
High probability reversal setup forming for short-term bullish play if POI holds. Monitoring price action closely for confirmation triggers.
ETH to 19k by Dec 17. BTC Aug 2017- identical $/time to ETH nowOn this day, August 2017 BTC was trading at approximately $3400-$3600.
By Christmas, it hit 19.8k. I expect a similar outcome with in ETH 2025.
Leverage causing liquidations on both sides and volatility the whole way up.
Be right and sit tight. These opportunities happen very infrequently. Don't fumble the bag.
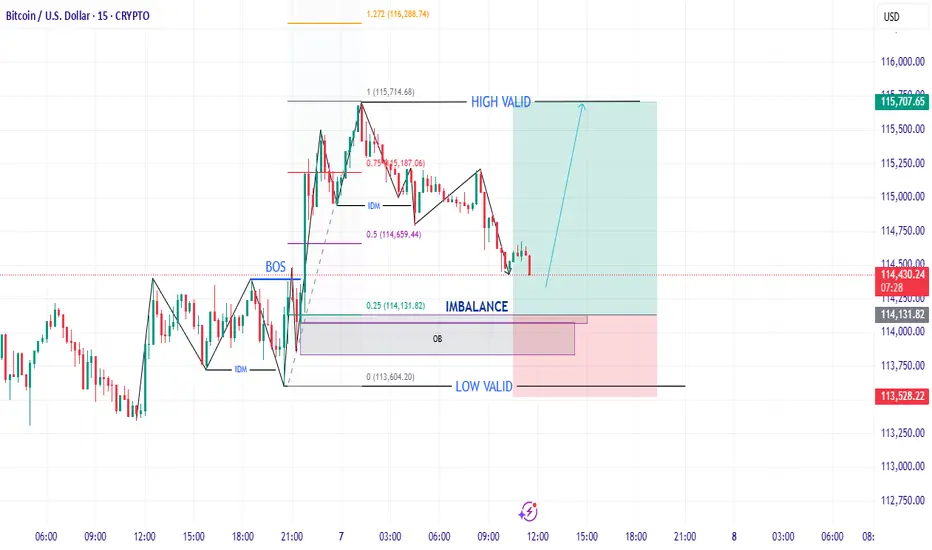
BTCUSD📈 BTCUSD - Smart Money Buy Setup | 15-Min Timeframe
🔍 Overview:
This setup is based on Smart Money Concepts (SMC), identifying key market structure shifts, imbalance zones, and order blocks to capture a high-probability long (buy) trade on BTC/USD.
✅ Structure Analysis:
Break of Structure (BOS) confirms a bullish market shift after liquidity grab below previous lows.
IDM (Initial Displacement Move) marks the beginning of bullish momentum.
Price has retraced into the 50%–61.8% Fibonacci zone, aligned with:
IMBALANCE zone (Fair Value Gap),
Bullish Order Block (OB) at the 0.25–0.0 zone,
All within the valid demand zone.
🛒 Entry Setup:
Buy Limit: 114,131.82
Stop Loss (SL): 113,526.81 (Below OB and Low Valid)
Take Profit (TP): 115,700.61 – 115,707.65 (Previous High/High Valid)
📏 Risk:Reward Ratio:
R:R ≈ 1:2.6
Potential Gain: +1,568.79 USD
Risk Exposure: -605.01 USD
💡 Rationale:
Clean liquidity grab below previous lows.
Entry aligned with confluence of:
Imbalance fill,
OB support,
Psychological retracement zone (0.5–0.25 Fib).
Expecting continuation toward recent highs (HIGH VALID zone).
🕒 Timeframe:
15-Minute (M15)
Short-term intraday opportunity.
📌 Note:
Always manage risk appropriately. This idea is shared for educational purposes only — not financial advice.
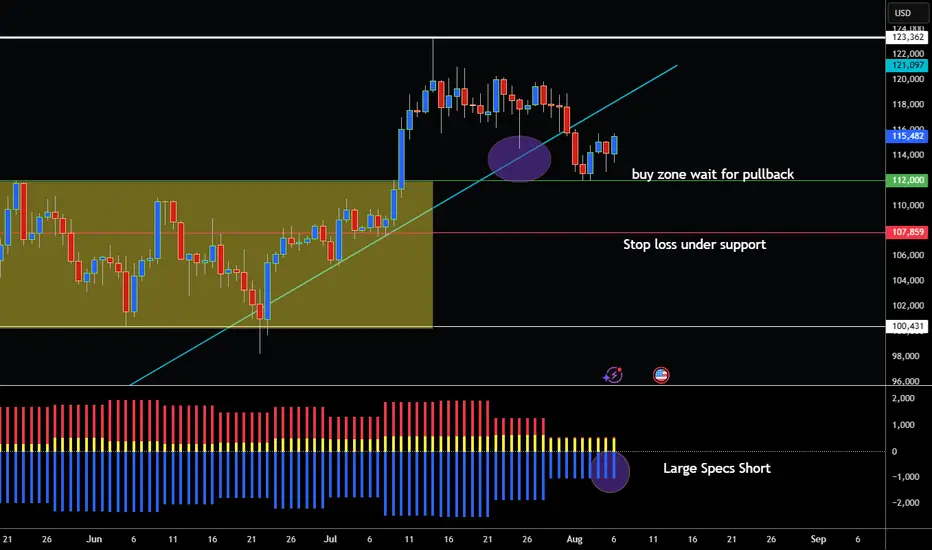
BITCOIN BOUNCE FROM SUPPORT LEVEL OFF BUY ZONE!Hey Traders so Bitcoin still in uptrend from what I see today.
Of course you never know for sure if support it going to hold but it had looked like it might at that 112,000 level.
For those new to trading think of support and resistance as supply and demand when market is overbought to much supply market pulls back when it hits a ceiling. If market oversold hits a floor and demand re enters causing buyers to re enter the market at the support level.
So whats next?
Quick lesson for those that may be new to this sport. I like to think of trading as a sport so think of your favorite sport whatever it is Basketball, Football, Soccer etc.
Then think your favorite team. Then imagine the offense and the defense strategy of that team.
Trading is no different for me offense if getting in market at good level or price. Then figuring out a way to slowly lock in profits.
Defense if protecting yourself by either first reducing risk or possibly break even. That way if market makes sudden reversal you won't lose as much. Or you won't lose anything because you moved the stop loss to break even.
If you are trading futures, CFD or forex then you will have stop loss. But if your trading ETFS thats different you can manage risk differently.
Alright so bottom line 2 Scenarios.
Bullish- Well for anyone who make have taken a trade on buyzone consider some small profit taking or consider reducing risk by moving your stop loss up some maybe to 110,000. Or maybe even breakeven so you have low or no risk in the trade. Watch for a test of the all time high at 123,362.
Bearish- I would say best to wait for reversal with break and daily close below 107,859. Then watch for Rally to sell but be careful because bullish momentum in strong at least for now.
COT- Finally I will also bring to the attention the COT report shows Long Speculators are holding short positions still but have been recently closing them out. Which also shows bullish signs.
Good Luck & Always use Risk Management!
(Just in we are wrong in our analysis most experts recommend never to risk more than 2% of your account equity on any given trade.)
Hope This Helps Your Trading 😃
Clifford
BTC Mean Reversion Price retested the previous high. It's been doing this since the BTC bull started in mid-2023.

BTC ...no ta needed!! Sometimes I wonder why you need complicated TA ...especially with BTC!! All you need to do is buy and draw cups lol

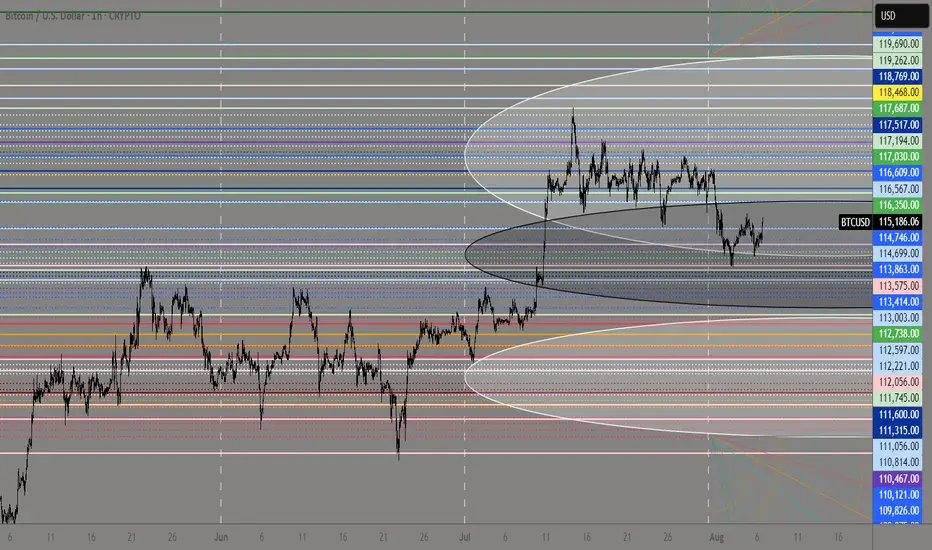
Key Levels for the Month 08/2025 ∷BitCoin∷🐍 Key Levels Overview for the Month 🐍
__________________________
Trend Base Lines
112738🐂🐂126892
109075🏛🏛116609
108381🐻🐻99947
__________________________
Resistances🔀
167037
156477
150687
143341
,
140311
1373677
,
135631
,
133642
129960
,
126740
123157
117194
111745
108583
Mids∷∷∷
145917
127698
125945
123889
,
121716
,
120788
,
119809
,
118769
117518
,
116567
114699
111056
105421
Supports🔀
135356
124796
113575
112056
,
107960
,
107177
106397
105620
,
104616
,
103911
103062
,
102214
101204
98780
Why I think Chainlink is the best bet for the dayLooking to me like link has broken a daily down trend and may be attempting to establish some support. On the hourly levels it has broken a down trend and appears like it may want to begin building stairs. Looking at bitcoin I believe we have potential to also break a down trend and if so, we could have great momentum to attempt breaking into the previous range. I feel today will show us a lot about short term price action to come.
