Bitcoin profit-taking hits sentimentLast week saw the largest realized profit on record for Bitcoin, with over $3.7 billion worth distributed, according to Glassnode (as of July 29). Since then, Bitcoin has struggled to recover, suggesting a shift in sentiment toward short-term profit-taking and distribution. After the big profit-taking action, we see a shift in the fear and greed index from almost extreme greed (74% on 30 July) to neutral levels (54% on 6 August).
On one hand, this shift in sentiment might be only temporary and mostly fueled by profit-taking activity; on the other hand however, this might be just a short correction in the prolonged bullish run of last month, only time will tell.
From the technical analysis perspective, Bitcoin's price has rebounded both ways at the 23.6% and 38.2% daily Fibonacci retracement levels and is currently hovering around the $144,100 level. The moving averages are validating the overall bullish trend in the market despite the recent selloff, while the Bollinger bands have expanded, showing volatility is getting hot mostly because of the profit-taking activity mentioned above.
The Stochastic oscillator is still holding on to neutral levels; however, it's still below the 50 level, hinting at being more prone to selling pressure for the time being.
Disclaimer: The opinions in this article are personal to the writer and do not reflect those of Exness
BTCETH.P trade ideas
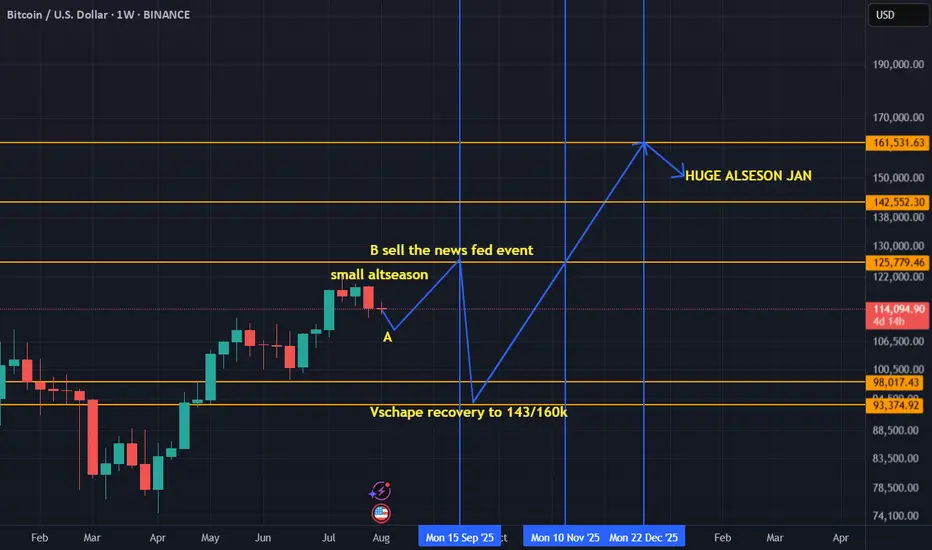
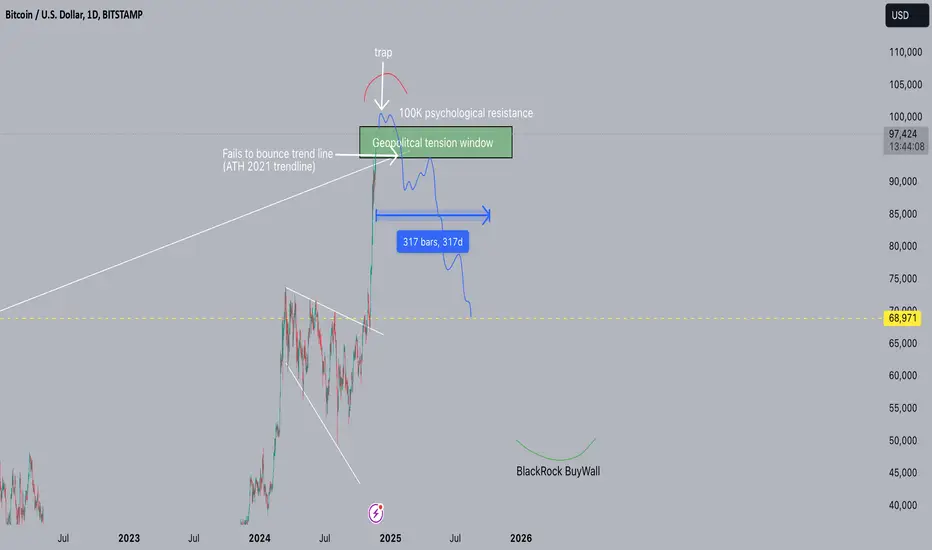
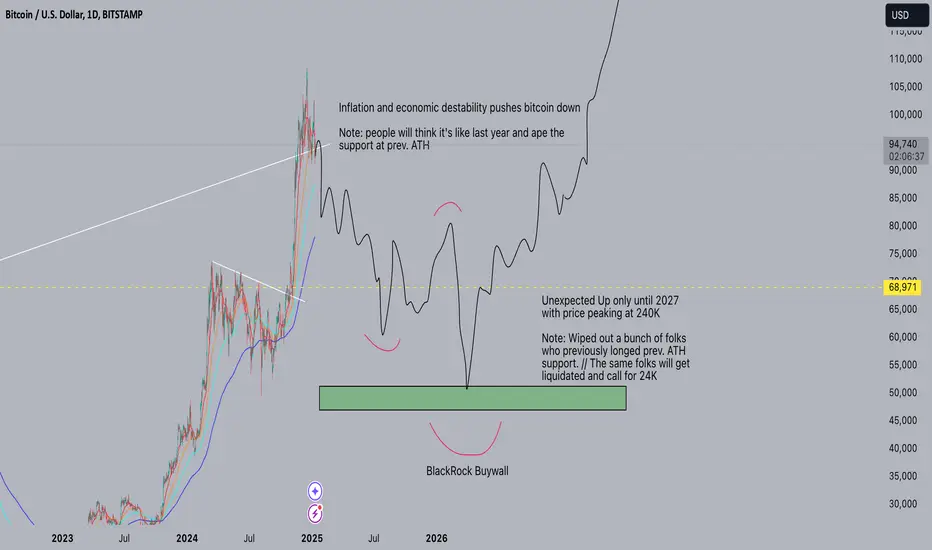
BTC ROADMAP 2025/2026this is a better chart with altseason in it, the fed meeting can be a huge sell the news event,
altcoins schould bottom 11 aug and schould pump till 11/15 sept.
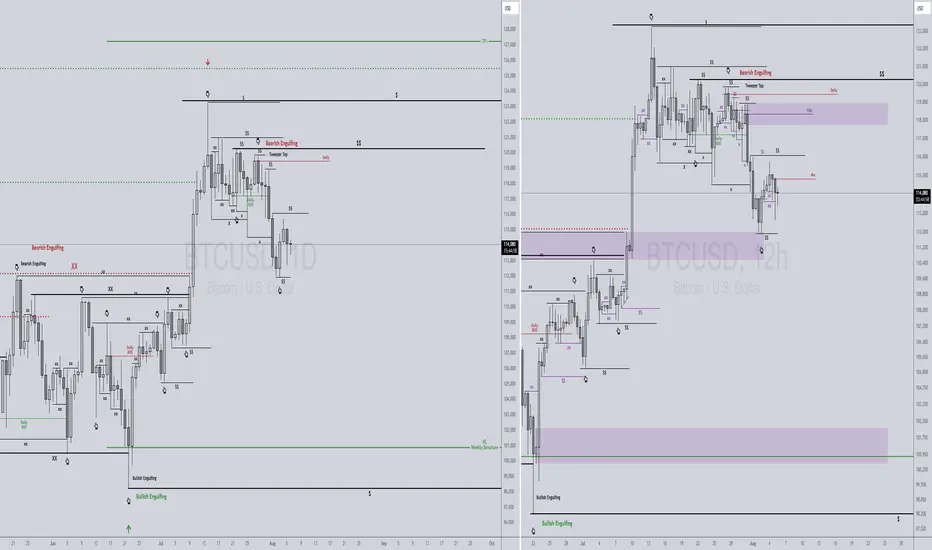
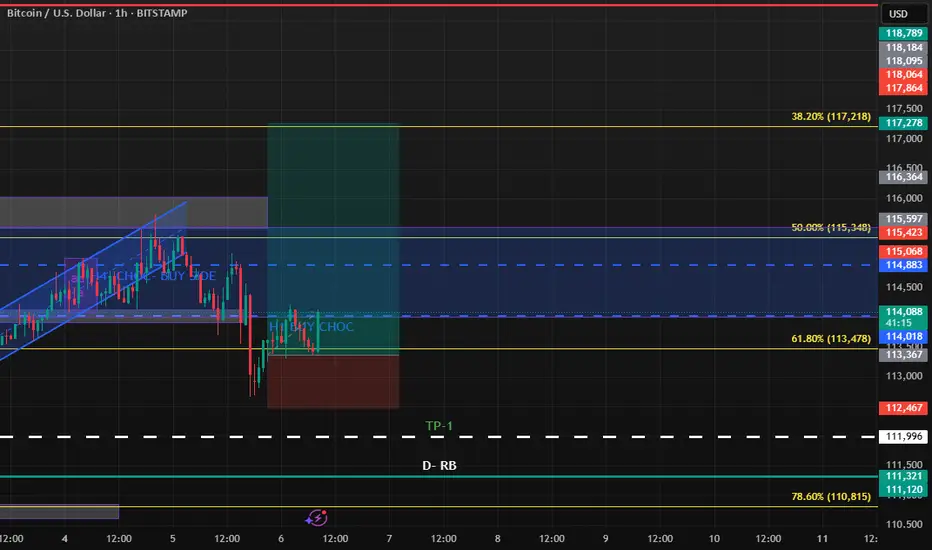
BTCUSD 8/6/2025Price has broken 4hr Bullish Structure & took 12hr Lows @ Daily TF Highs, which can induce the Daily TF Bearish Continuation targeting Lows. Let's see what Price does....
_SnipeGoat_
_TheeCandleReadingGURU_
#PriceAction #MarketStructure #TechnicalAnalysis #Bearish #Bullish #Bitcoin #Crypto #BTCUSD #Forex #NakedChartReader #ZEROindicators #PreciseLevels #ProperTiming #PerfectDirection #ScalpingTrader #IntradayTrader #DayTrader #SwingTrader #PositionalTrader #HighLevelTrader #MambaMentality #GodMode #UltraInstinct #TheeBibleStrategy
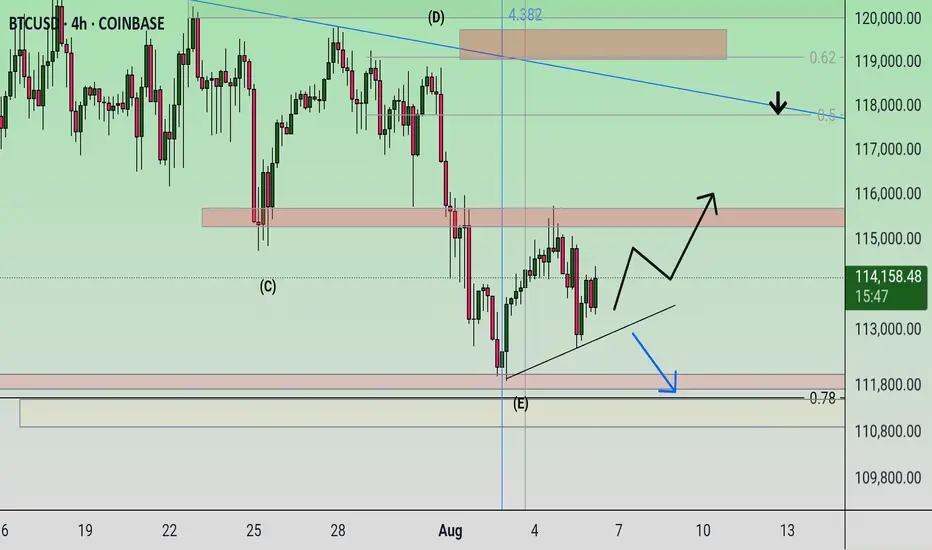
Possibility of uptrend A trend change is expected to form within the support trend line and the continuation of the upward trend is expected. A break of the resistance level will be a confirmation of the upward trend. If the support trend line is broken, a continuation of the downward trend is likely.
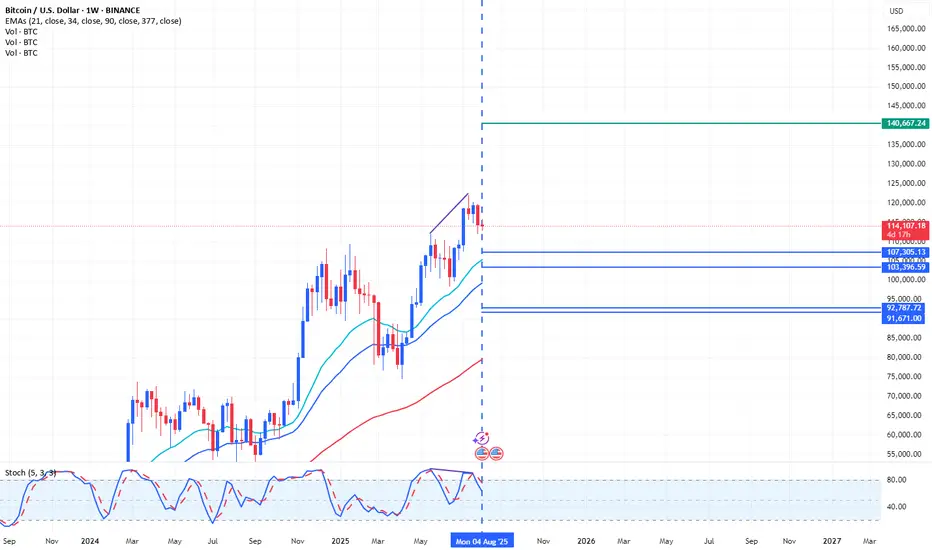
Bitcoin Long-Term Investment Outlook 1W [Disc On]Bitcoin Long-Term Investment Outlook
Technical Analysis:
A bearish stochastic divergence has formed on the weekly (1W) chart, indicating a potential trend reversal downward toward the Fibonacci cluster support zone.
Conclusion: There is a high probability of seeking BUY positions at the psychological levels of 107,300 – 103,400 and 92,800 – 91,800, with a Take Profit target at 140,600.
(Note: Always confirm with volume and macroeconomic factors before execution.)
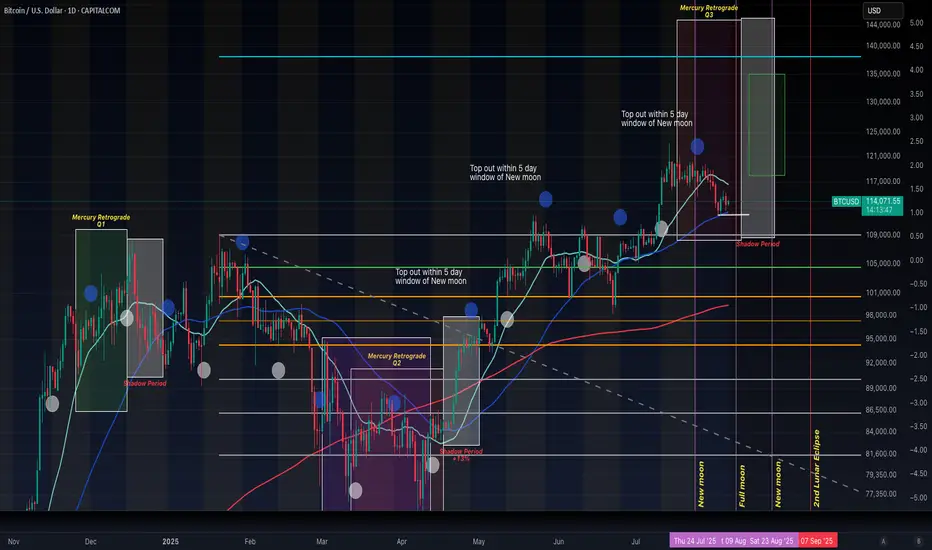
135K COMING! Retrograde rallies!Heres a quick update on my take on Bitcoin reacting to Mercury retrograde, the moon cycles and our lunar eclipse in early September.
We are at our last stages in this bull market before BTC starts bleeding into September. It's critical to know how we are sitting technically, so please stay calm and observe the market neutrally.
- 112K Support is holding firm, this level is critical as Mercury retrograde enters Q3, which Quarter 3 has been historically bullish for Bitcoin.
- However, bearish energy could still linger until August 14th, as that date is within a 5 day window of a full moon. From now until the 14th will be a cooling zone and consolidation zone. Our RSI is sitting nice and neutral, not reacting to much to the recent drop, meaning more room for upside.
- From August 14th - 28th, we will start to see euphoria in the market. After we are supported on the 117.5K level a 15% rally could take us to the 1.618 FIB level, i'm taking profits at 135K.
- After that, we face the second lunar eclipse of this cycle on September 7th. Historically every Lunar eclipse has bearish energy, and I'm excepting to re accumulate after a 30 - 35% correcting from the recent top out.
This will be the end of the Bitcoin rally, naturally creating a bleed from BTC into the ALT's, Bitcoin will drop as well as dominance and ALT season will kick in. Bye Bye BTC until march for a little swing...
Bitcoin has become very popularIn one case a person lost a Bitcoin ticket at cost over $300 billion that was thrown away in which they searched for it in a gigantic garbage dump for 8 years and finally found it.
BTC Top NFA, DYOR.
Food for Thought: Rate Cut - Geopolitical Tension - BTC is up how much from the bottom? - Coinbase App Store - Retail hopping on Solana.
Enjoy.
Bull Cycle first half is over - Log off for a while.Idea above - NFA,DYOR.
Do not believe the bulltards.
Daily Analysiswe dont have a clear directional bias both on BTC and GOLD therefore we will be sitting on our hand today to see how price plays out.

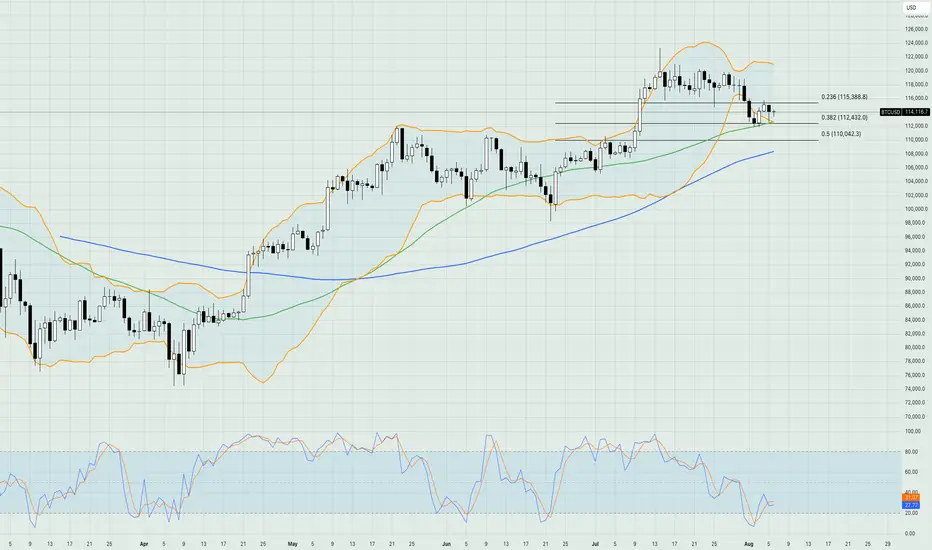
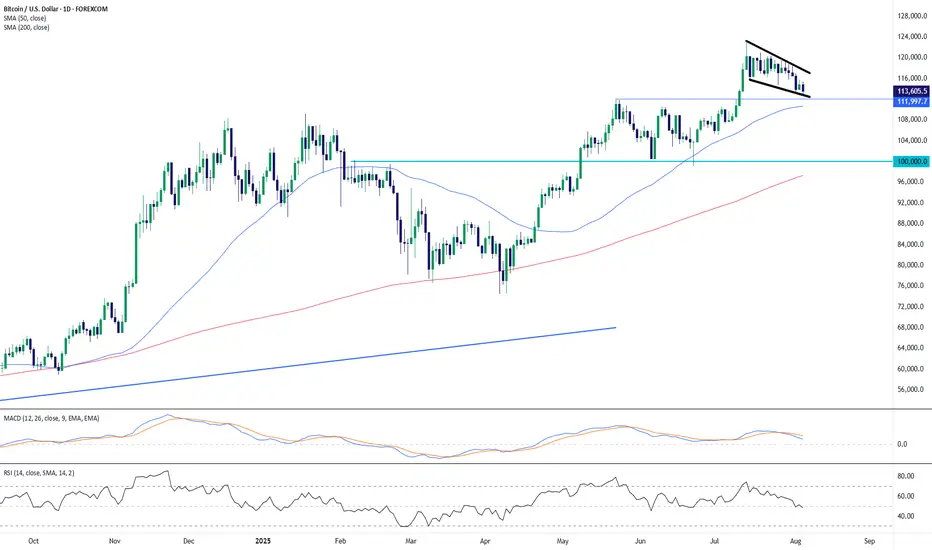
BTC/USD: Testing Key Support in a Bull Flag SetupBitcoin is currently pulling back from its July high near $122,000, but the structure on the daily chart shows a potential bull flag forming. Price action is now hovering around the $113,600–$112,000 support area, which aligns closely with the 50-day SMA ($110,627) and the lower boundary of the flag.
The broader trend remains bullish, as price continues to trade well above the 200-day SMA ($97,279), and the recent consolidation appears orderly rather than impulsive.
Momentum indicators:
MACD is in bearish territory and descending, reflecting short-term weakness.
RSI sits at 48.16, near neutral, offering room for movement in either direction.
A confirmed breakout above the flag’s upper trendline would signal potential continuation of the larger uptrend. However, a breakdown below $112,000 would invalidate the bullish flag scenario and possibly expose BTC to the psychological $100,000 level next.
Key Levels:
Resistance: $118,000–$120,000 (flag top).
Support: $113,600 and $112,000 (flag base and 50 SMA); $100,000 psychological level below.
Structure: Bull flag within a broader uptrend.
This remains a high-stakes zone for Bitcoin bulls. A decisive move out of this consolidation pattern will likely dictate the next major leg.
-MW
BTCUSDT TARGET ACHIEVED CRYPTOTHE RESULT
Follow for more Simple And accurate swing analysis on Indices, Currency, Commodities.

Where could Bitcoin and the rest of the market be headed?Just a brief overview of my thoughts on bitcoin and the rest of the market. We are currently sitting around the area that I had suspected may be our weekly low. Where we go from here is still unclear but I wanted to take time for a good overview and share my plans and how to trade it so that I could still be profitable even if we just chop for a while. Also, the potential for a true alt season may really be right around the corner. This is the type of term that has been thrown around so much lately but it has been years since we have had one. Alts have been lagging so I have some suspicion of what may happen next and share the things to look for to confirm this, and how I plan to trade accordingly.

BTC Full Analysis WHERE ARE WE HEADING ???Good afternoon
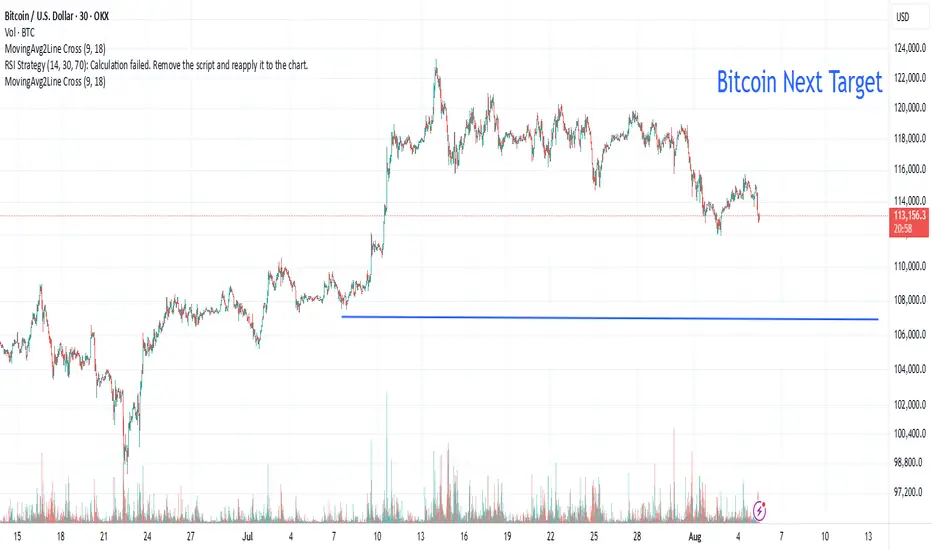
SO currently with BTC we see the following:
Bullish:
If we can stay and hold above 115,900 then 120K, 122K, 128K and 133K makes sense
BEARISH:
If we close and hold under 113K levels then we can see 108, and 96K levels being hit
What do you think ? Comment Below
Trade Smarter Live Better
Kris

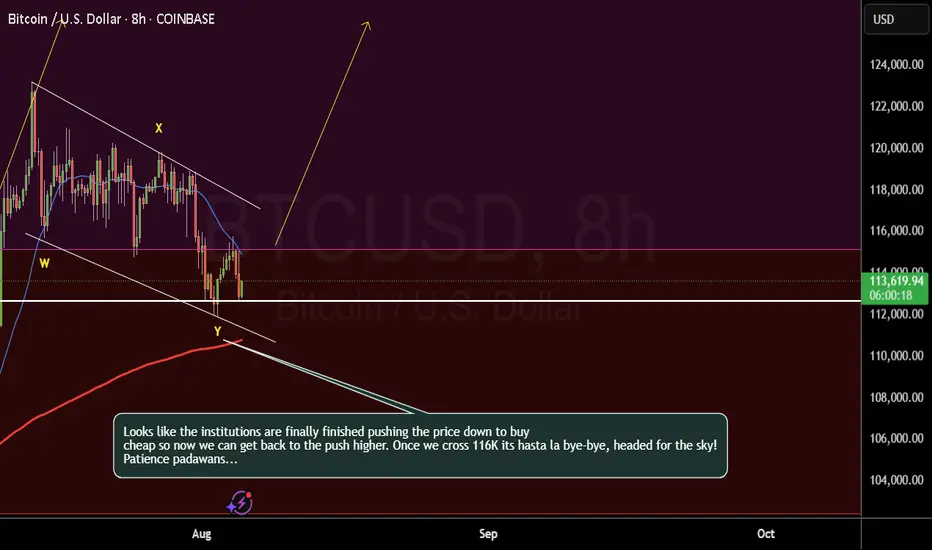
We're so close!!!!....Looks like the institutions are finally finished pushing the price down to buy
cheap so now we can get back to the push higher. Once we cross 116K its hasta la bye-bye, headed for the sky!
Patience padawans...
Starting the next bull run (Grab your bowl - hopium incoming)1. The following is for entertainment purposes only.
2. Do not trade on this information. You will lose your money.
3. Yes I have positions and yes I am basing my decisions off of long term analysis like this
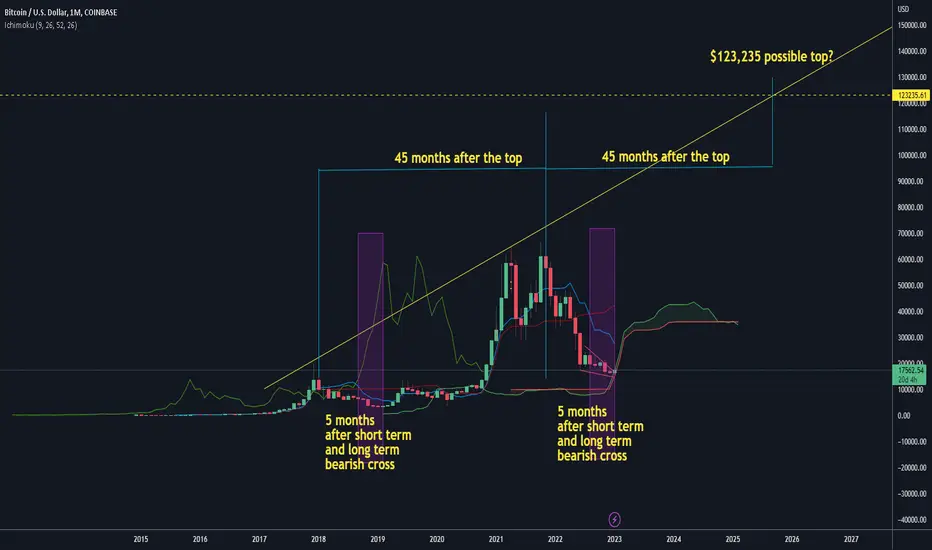
*History doesn't repeat but it often rhymes*
Two thoughts:
1. In February 2019, 5 months after the ichimoku long term and short term trend lines crossed in 2018 on the month scale, we started to see a relief rally in the bitcoin price
It's now 5 months after the trend lines have crossed bearish again. Will we see a repeat? The ichimoku cloud seems to align with this.
2. 45 months after the 2017 peak we got the 2021 peak. If we create a trend line between those points and then project out another 45 months, we would see a peak of ~$123k. Conservative sure, but more realistic imo than all these million dollar projections.
Bitcoin Live Cripto currency target Bitcoin Live and the number 1,080,000 (likely meant to be 1,080,000 — one million eighty thousand).
Let’s break down what this number might represent in the context of Bitcoin:
🚀 Possibilities for “1,080,000” in Relation to Bitcoin:
Price in a Different Currency
If you're talking about Bitcoin's price in a currency other than USD, 1,080,000 could correspond to:
Currency 1 BTC ≈ 1,080,000 USD Equivalent
Argentine Peso (ARS) Possible (devaluation) ~$60–70 USD
Chilean Peso (CLP) Very likely ~$1,200 USD
Vietnamese Dong (VND) Not likely (1 BTC > 1.5B VND) Too low
Iranian Rial (IRR) Definitely too low 1 BTC > 1B IRR
Future Price Prediction
Are you suggesting or referencing a future prediction that Bitcoin could hit 1,080,000 USD? If so:
This is a common ultra-bullish scenario.
It’s often cited by Bitcoin maximalists or hedge funds forecasting hyperinflation or mass adoption.
Clickbait Headline / SEO Phrase
This could also be a content prompt like:
"Bitcoin Live: Could BTC Hit 1,080,000?"
I can help write an article or post using that as a headline.
✅ How I Can Help You Now:
Please let me know your goal so I can tailor the response:
📈 Do you want live BTC price info?
✍️ Do you want a blog post or headline using "Bitcoin Live" and "1,080,000"?
📊 Want me to analyze a prediction or price model that suggests BTC could reach 1,080,000?
Let me know — I can generate news-style content, social media posts, or investor briefs based on this number.
BTC Double BottomDo not be surprised if BTC gives us another double bottom before reversing its direction back into price discovery. Looks like it could achieve the second bottom around 111-112. If anyone has spent any significant amount of time in the charts knows BTC LOVES a double bottom before going higher. Also, this cycle has seen a repeated pattern of accumulation, sweeping low, reclaiming range and then expansion.
BTC -12H Move CompletedPlease refer to our previous post:
From this post we were watching for scenario 1 or scenario 2 to play out. Scenario 1 ended up playing out and price continued to drop right to our yellow line. We noted the measured move low would be slightly below $112k and our low was established at $111,903 which was an almost perfect prediction!
This comes as no surprise if you refer to our post we made over 3 weeks ago.
In this post we labeled support #2 as $112k. This is looking to turn our last highs into new support.
However if we do end up losing this level $107-$108k is really the last line in the sand to keep this bull market intact before we must start considering the bull market top is in. No confirmations on this yet, but if you have been viewing our macro charts there are a few signs developing pointing towards this as a possible scenario if confirmations happen.

Bitcoin - Structure Holds, Momentum Fades, CME Pull Grows.⊣
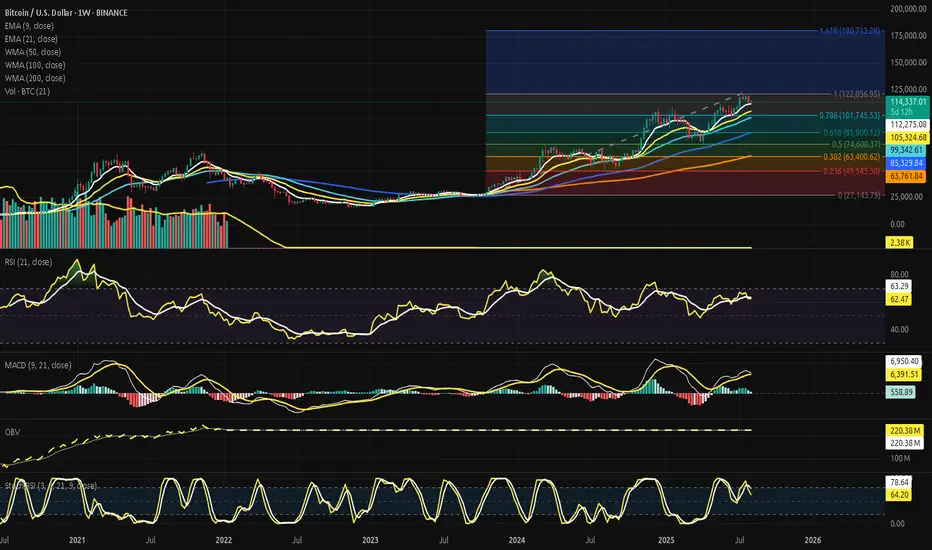
⟁ BTC/USD - BINANCE - (CHART: 1W) - (Aug 05, 2025).
◇ Analysis Price: $114,907.55.
⊣
⨀ I. Temporal Axis - Strategic Interval - (1W):
▦ EMA9 - ($112,389.19):
∴ Price action is currently positioned above the EMA9 on the 1W timeframe, reflecting ongoing bullish strength;
∴ The candle body maintains a healthy gap from the EMA9 line, indicating that short-term trend control remains with the buyers;
∴ This level also coincides closely with the upper bound of the active CME Gap, suggesting strategic confluence support in the $112.3k zone.
✴️ Conclusion: Short-term bullish structure remains intact. EMA9 acts as frontline dynamic support.
⊢
▦ EMA21 - ($105,376.55):
∴ The EMA21 remains far below the current price structure, confirming that mid-term momentum is still securely bullish;
∴ Distance between price and EMA21 reflects a sustained uptrend, but also implies vulnerability to sudden reversion if volume drops;
∴ No signs of flattening or curling - the EMA21 slope is upward, validating continuation bias.
✴️ Conclusion: Mid-range trend remains intact and structurally sound. Acts as deep dynamic support for broader bullish context.
⊢
▦ WMA50 - ($99,364.99):
∴ The WMA50 weighted average is trending upward, reflecting ongoing macro-bullish alignment;
∴ Price remains safely above it, affirming structural support and healthy trend continuation;
∴ No flattening or curve-down detected - the momentum is sustained.
✴️ Conclusion: Primary trend remains unbroken. WMA50 serves as dynamic base.
⊢
▦ WMA100 - ($85,341.14):
∴ Price remains well above the WMA100 weighted average, confirming long-term structural strength;
∴ The slope remains positive, showing no signs of decay or macro exhaustion;
∴ Acts as a foundational support level, unlikely to be challenged unless momentum is broken across multiple time frames.
✴️ Conclusion: Long-term support confirmed. Structure remains in favor of bullish control.
⊢
▦ WMA200 - ($63,767.52):
∴ The WMA200 weighted moving average holds firm as the ultimate line of structural defense in long-term cycles;
∴ Price is elevated nearly 80% above this level, affirming that Bitcoin remains far from macro breakdown territory;
∴ The slope has resumed a slight upward curve, indicating that deep-cycle accumulation zones are now behind.
✴️ Conclusion: Foundational macro support fully intact. Long-term bullish cycle structurally confirmed.
⊢
▦ VOLUME + EMA21 - (347.41 BTC):
∴ Weekly volume shows a steady decline over the past four candles, indicating weakening participation despite elevated price;
∴ The EMA21 sits just below current candle activity, suggesting that momentum is fading but not yet broken;
∴ No volume spike confirms breakout - current structure lacks conviction.
✴️ Conclusion: Volume compression persists. Trend remains, but force is thinning.
⊢
▦ FIBONACCI - (0 = $27,143.79 / 1 = $122,056.95):
⌖ 0.236 - ($49,543.30):
∴ First shallow retracement level, often reached in early corrections;
∴ Remains untouched during this cycle - represents an extreme fallback zone.
✴️ Status: Unreached - deep structural support.
⌖ 0.382 - ($63,400.62):
∴ First zone of major institutional interest;
∴ Closely aligned with the WMA200 - double confirmation as a defense line;
∴ Still far below the current structure.
✴️ Status: Untouched - possible gravity point if collapse.
⌖ 0.500 - ($74,600.37):
∴ Midpoint of the entire bull impulse;
∴ May act as magnet if the current momentum breaks down;
∴ Strongest neutral reversion zone.
✴️ Status: Unreached - mid-cycle equilibrium.
⌖ 0.618 - ($85,800.12):
∴ The golden zone - ideal level for healthy retracements in bullish trends;
∴ Not yet tested, but visible as psychological and strategic area for institutions.
✴️ Status: Unreached - primary retracement target if pullback strengthens.
⌖ 0.786 - ($101,745.53):
∴ Upper-level retracement before full price reentry into macro top territory;
∴ Very close to current price - may act as last resistance zone before all-time high break.
✴️ Status: Approaching - active resistance zone.
⌖ 1.000 - ($122,056.95):
∴ The swing high of the current macro wave;
∴ Current candles are pressing against this level;
∴ A breakout would signal macro continuation - failure could initiate retracement to 0.786 or lower.
✴️ Status: Active - pressure point of decision.
⌖ 1.618 - ($180,713.28):
∴ Full Fibonacci expansion;
∴ Represents speculative future cycle extension;
∴ Only attainable through breakout + sustained volume and ETF inflow.
✴️ Status: Untouched - long-term speculative beacon.
✴️ Conclusion:
∴ Price is now fighting just beneath (1.000 - $122K) - while leaning on (EMA9 - $112K);
∴ The macro structure remains intact, but pressure is rising between the (0.786 / 1.000) band, a known resistance battlefield;
∴ Failure to break (1.000) may activate gravitational pull toward (0.786 or 0.618) - where strength shall be tested.
⊢
▦ RSI (21, 9) - ($62.75):
∴ The Relative Strength Index remains above the 60 threshold, confirming that momentum is still bullish without entering euphoric territory;
∴ The signal line (EMA9 - $63.34), slightly above the RSI value - suggesting mild divergence and loss of acceleration;
∴ No overbought condition present, but a slow downward curve has begun from the local peak.
✴️ Conclusion: Momentum is positive but softening. Watch for confirmation of divergence or RSI breakdown below 60.
⊢
▦ MACD (9, 21, 9) - ($6,403.95):
∴ The MACD line currently sits below the signal line ($7,012.64), confirming a bearish crossover on the weekly scale;
∴ Histogram bars have turned negative, reflecting declining momentum and weakening trend strength;
∴ Despite this, the MACD remains in positive territory, indicating that the macro trend has not yet reversed - only softened.
✴️ Conclusion: Bearish momentum signal confirmed. Short-term weakness within a still intact bullish macro context.
⊢
▦ OBV (9, BB2) - ($220.38M):
∴ The On-Balance Volume indicator maintains a steady upward slope, showing continued net accumulation over time;
∴ No divergence is present between OBV and price - both remain structurally aligned;
∴ The OBV line resides within the upper half of its Bollinger Band (BB2), signaling orderly inflow rather than euphoric volume spikes.
✴️ Conclusion: Accumulation remains healthy and controlled. No warning signs from volume flow.
⊢
▦ StochRSI (3, 3, 21, 9) - (%K: 65.16 / %D: 78.96):
∴ The %K line has begun curving downward after exiting the overbought zone, suggesting momentum exhaustion;
∴ The %D line remains higher, forming a potential crossover to the downside - a classic reversion signal;
∴ Both lines still hover in the upper band, but the slope indicates a softening trend.
✴️ Conclusion: Overbought momentum is decaying. A short-term pullback or consolidation phase is likely.
⊢
🜎 Strategic Insight - Technical Oracle:
∴ EMA9 and EMA21 maintain a healthy bullish spread, preserving the dynamic trend structure without showing signs of decay;
∴ WMA50, WMA100, and WMA200 confirm full macro alignment - the base of the cycle remains strong and upward-facing;
∴ Weekly volume is compressing below its EMA21, indicating that momentum is softening despite price holding high ground;
∴ RSI (21, 9) holds above 60, preserving bullish momentum but showing early signs of curvature loss and possible divergence;
∴ MACD (9, 21, 9) has completed a bearish crossover with a negative histogram, signaling internal weakness under the surface;
∴ OBV (9, BB2) continues its upward trajectory with no volume divergence, confirming that no distribution is currently present;
∴ StochRSI (3, 3, 21, 9) is exiting the overbought zone, with %K descending and %D beginning to curve down - classic signal of momentum exhaustion.
✴️ Conclusion: The weekly structure remains bullish, but all momentum indicators are converging toward a transitional phase; Trend is intact - yet losing energy; A new directional impulse will be required to preserve the current bullish architecture.
⊢
▦ CME GAP - ($111,300 / $112,300):
⌖
∴ This gap was formed between the closing candle of Friday, July 26th and the opening candle of Monday, July 29th, on the BTC Futures contract (CME:BTC1!);
∴ The Friday close occurred near ($111,300), while the Monday open jumped to ($112,300), leaving a 1,000-point dislocation - a vacuum zone where no trades were registered;
∴ As of the current 1W candle, this gap remains completely unfilled - price has not returned to touch or shadow into this void;
∴ The gap is strategically aligned with the (EMA9 - $112,389.19) on the (1W) timeframe, forming a dual-confluence support that amplifies its gravitational potential;
∴ CME gaps of this magnitude, when left open, tend to act as attractors - especially when momentum slows and volume compresses, as currently observed in the MACD and Volume indicators.
✴️ Conclusion: The ($111,300 / $112,300) zone remains an active gravitational target;
If the current weakening of momentum persists, price may be pulled downward to close this imbalance before attempting any further upside expansion; It now acts as a pivot point between bullish continuation and corrective rebalancing.
⊢
𓂀 Stoic-Structural Interpretation:
∴ The structure does not collapse, but it no longer expands - it holds, sustained not by force, but by form;
∴ Indicators speak not of panic, nor of euphoria - they speak of pause, of a market that has climbed far and now waits for intention;
∴ The moving averages form a solid stairway, but the feet have slowed; the MACD has turned, the RSI bends gently, the volume has quieted;
∴ There is no sell-off. No rush to escape. But there is no thrust forward either;
∴ This is not weakness. It is controlled fatigue. The kind that precedes choice - will you break through, or rest and descend?
𓂀 The Stoic mind sees neither threat nor promise - only the present structure, and its silent demand for action.
∴ Hold position : Observe the slope. Momentum must return - or gravity will.
⊢
· Cryptorvm Dominvs · MAGISTER ARCANVM · Vox Primordialis ·
· Dominivm Cardo Gyratio Omnivm ·
⚚ · Silence precedes the next force. Structure is sacred · ⚚
⊢
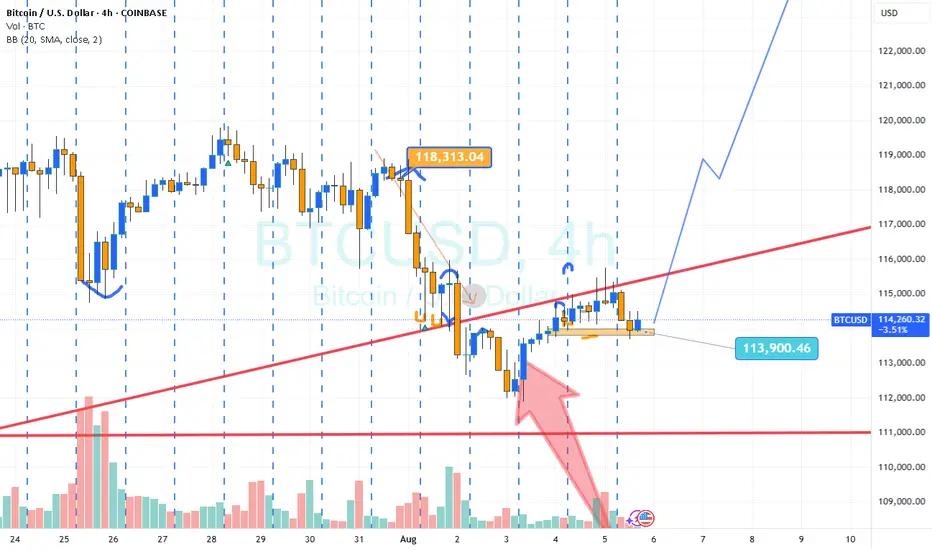
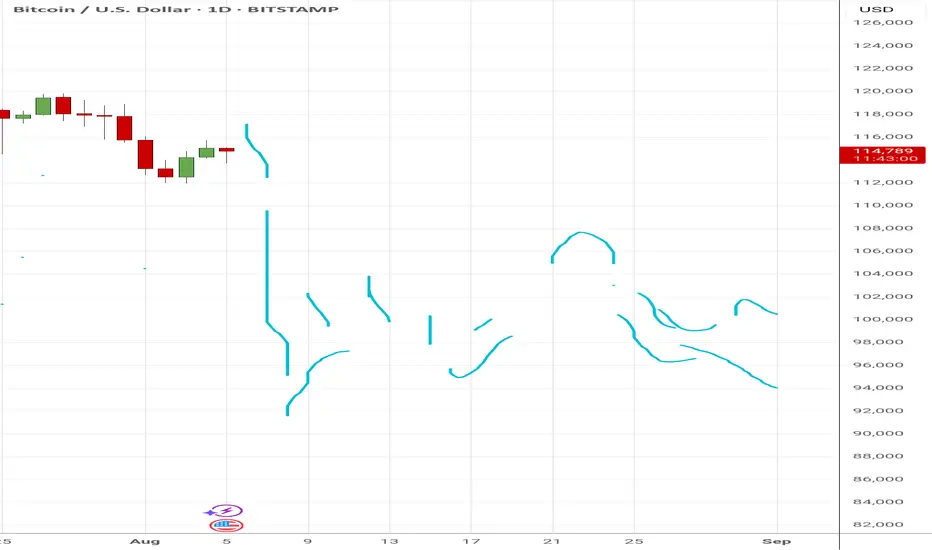
Feeling the charts, bitcoin in august... I am engaged in extrasensory stock charts, that is, feeling the energy of the future chart, this is a meditative technique. In the screenshot of the bitcoin chart, I have drawn my feelings about how bitcoin will move in August 2025. In the week from August 4 to 10, there is a strong downward impulse, in the period from August 18 to 24, there is a slight upward movement with a subsequent correction until the end of the month. The overall impression of August is not positive, I do not expect growth. At the moment, I'm not analyzing the prices, and I'm focusing on the momentum of the price movement. I will consider my forecast to be accurate if the outline of the actual chart matches the outline of the chart I have drawn as a forecast.
BTC?Hi
Don't miss 114000-114500 range
I think it's a value area for now.
Risking 1000$ points only
Potential Upside as per previous analysis, AI etc
All the best
Not a guru