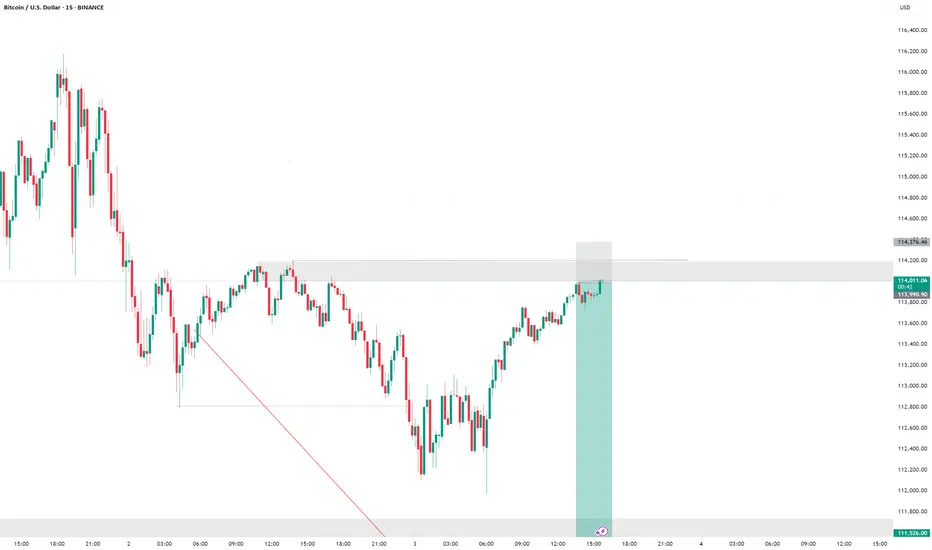
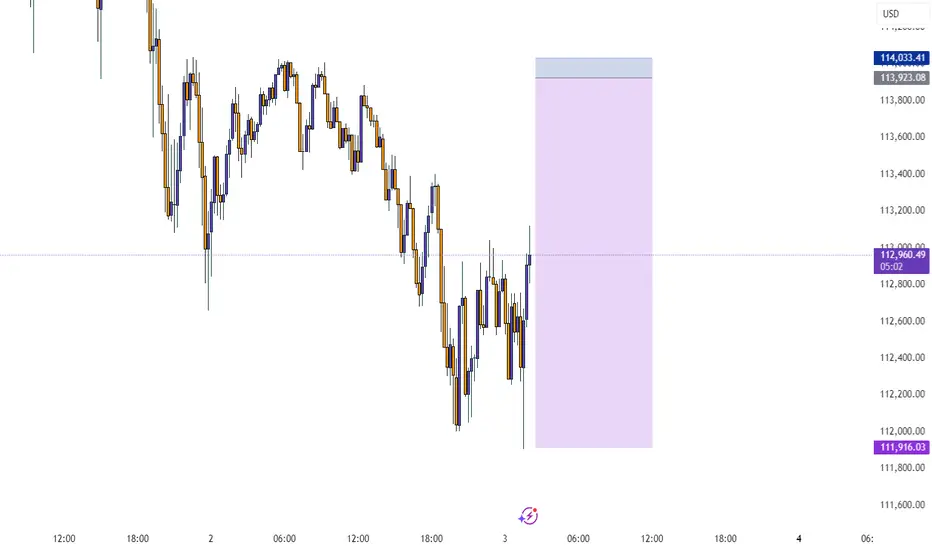
BTCUSD--Short-03-08-25--After last week, expecting price will move down further to monthly support-1 and monthly support-2
BTCETH.P trade ideas

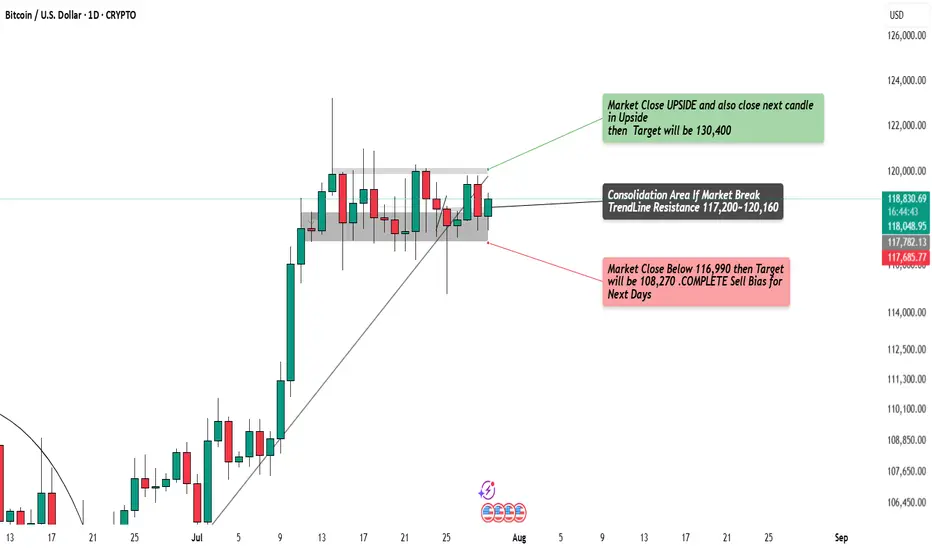
BTC/USD Ready to Explode?Watch 116,990 & 120,160 Breakout Zones!Massive move loading on BTC!
Price is trapped in a tight consolidation zone — breakout above 120,160 = 🚀 to 130,400, while a break below 116,990 = 💀 down to 108,270.
Waiting for 2 daily candle confirmations before entering . Stay sharp — this breakout could set the next major trend.
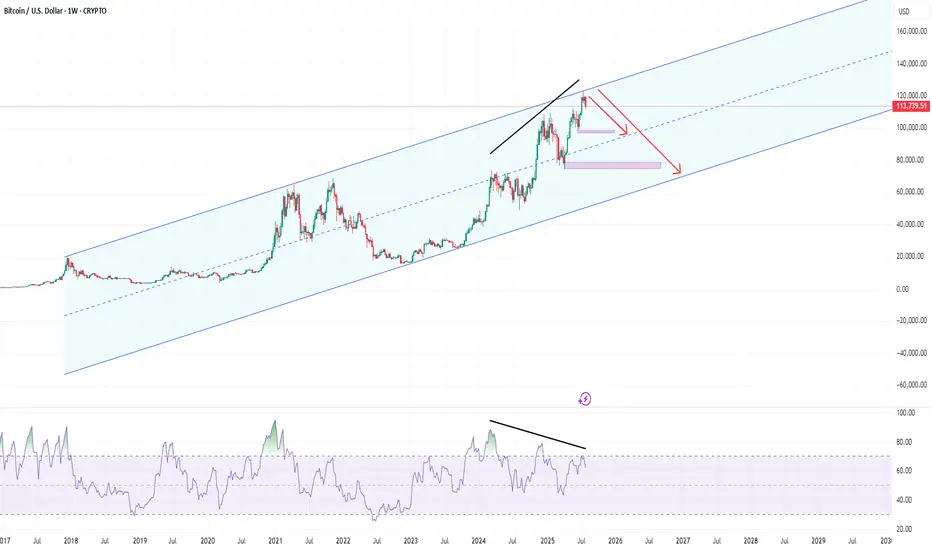
Resistance in the channel roof !Reversal of channel resistance.
It is likely to have a corrective move to the midline or lower line.
Negative divergence of the RSI also confirms the downtrend.
That is, with rond numbers: 100,000 or 75,000
!!
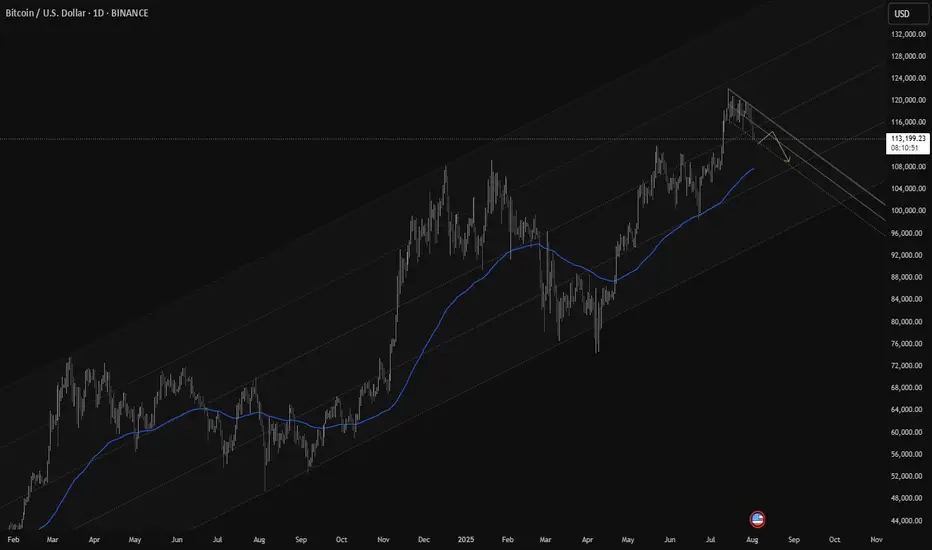
Bitcoin Price Analysis: Price headed to $118,100Bitcoin Price Analysis: Price headed to $118,100.
The Bitcoin price chart reveals a clear picture of the asset’s recent behavior. After consolidating within a trading range between $116,000 and $120,000 for over two weeks, Bitcoin broke below the southern boundary of this range on Wednesday evening. This correction began shortly after the US Federal Reserve announced its decision to maintain interest rates, ignoring calls from former President Donald Trump for a rate reduction. The Bitcoin live price dipped to $112,700, a three-week low, signaling a shift in market sentiment.
From a technical perspective, Bitcoin’s chart shows it has been moving within a descending channel since March 2024. The recent break below the $116,000 support level indicates a potential for further downside if momentum remains weak. Key support levels to monitor include $110,000, which aligns with historical price action, and a deeper support at $84,500, as suggested by technical analyst Katie Stockton. Conversely, resistance levels are observed at $118,100, where Bitcoin is expected to recover in the near term, and $120,000, a psychological barrier that could signal a bullish breakout if breached.
BTC Vs AI ? timing 115500
Hi,
I asked AI to give timing for a trade if momentum is the same
Now, time to travel 2,000 units = distance / rate = 2,000 units / 500 units per hour = 4 hours.
So, it would take 4 hours to travel from 113,500 to 115,500 assuming the same travel rate
Woow.. get ready guys
If it don't happen.. blame AI hahaha
Beach here we come.. :)
All the best
Not a guru
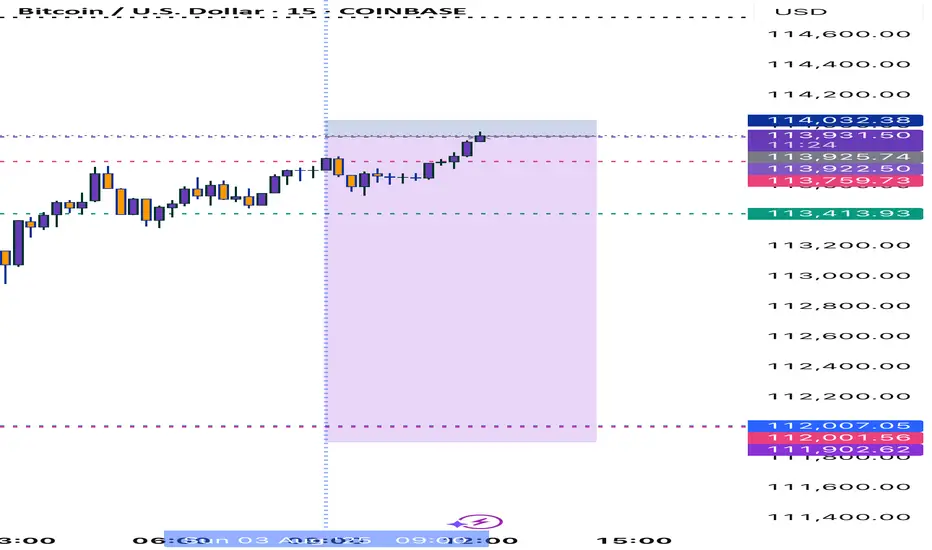
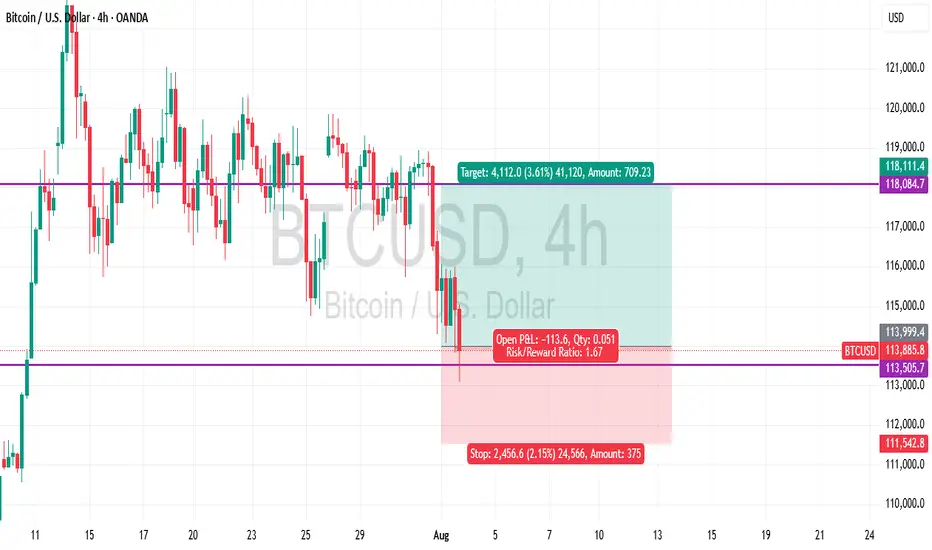
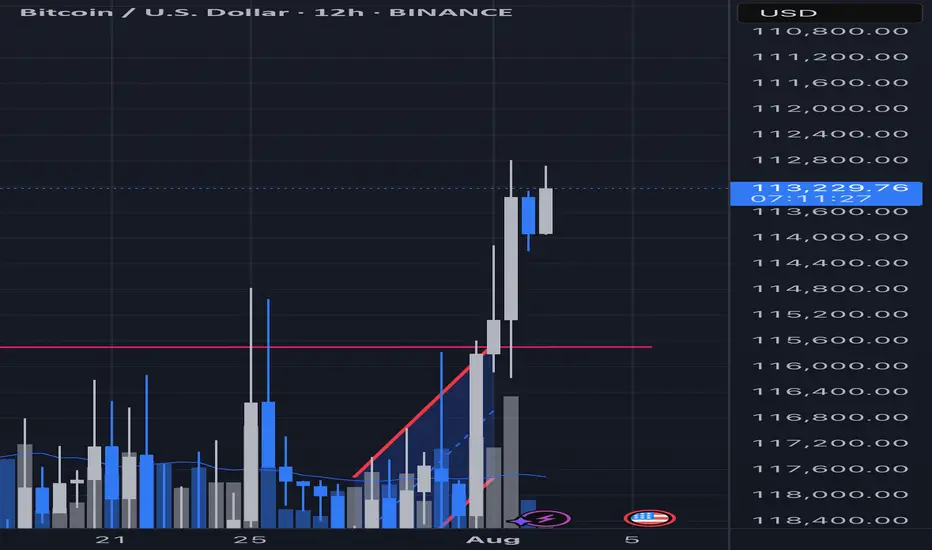
BTCUSD SHORT POSITION You can be a seller by returning to the price of $115,000, provided that $117,000 is not broken... The loss limit and profit limit are clear in the image. Please observe capital management. The risk in this transaction is 2 to 3 percent.
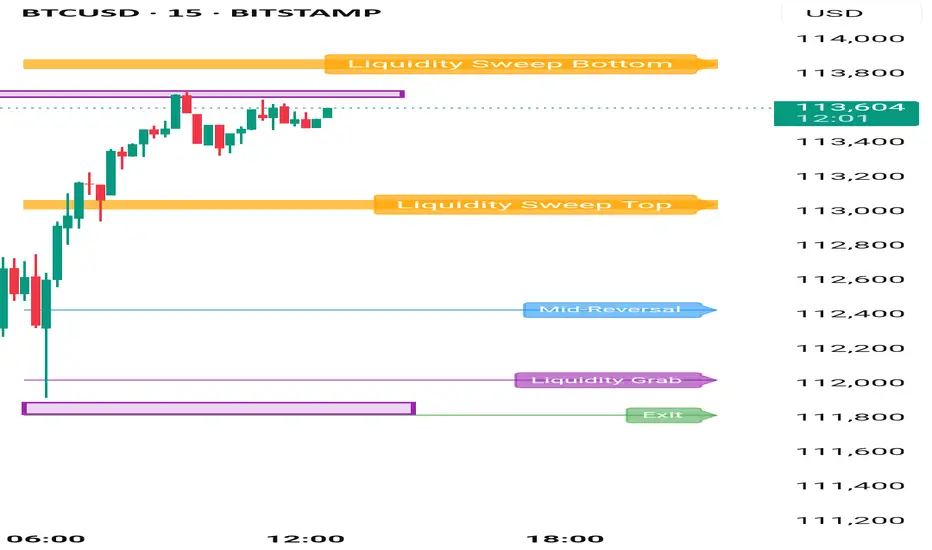
Targets for BitcoinIf we see break out of liquidity sweep . Liquidity Grab will be the target for bullish moment.
This charts and levels are plotted on the concept of liquidity sweep .
Once breakout of liquidity sweep, price should move till liquidity grab & after liquidity grab should take rejection and reverse for bottom liquidity sweep .
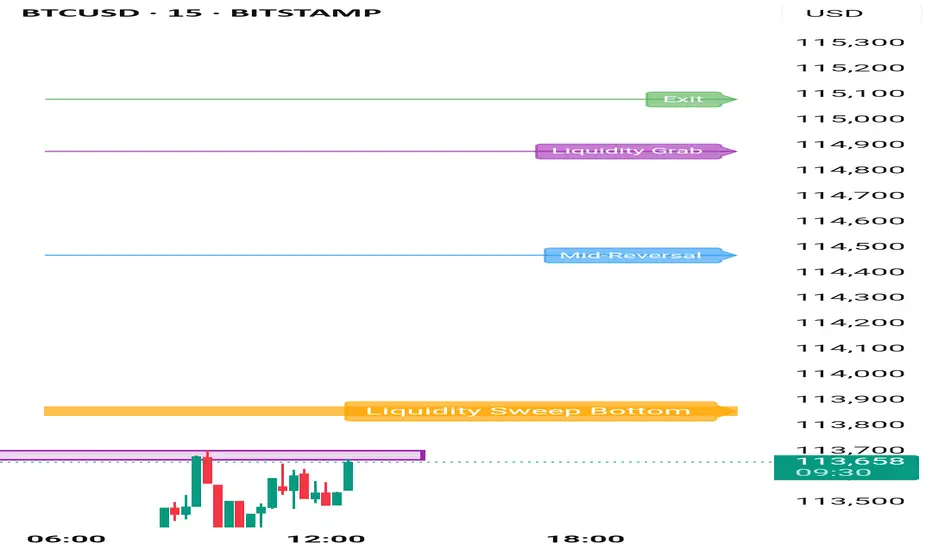
Bit coin trade IdeaBit coin if closes above liquidity sweep we can expect a bullish moment . If taken proper rejection from liquidity sweep then bearish till liquidity grab . Zone to zone ..on the basis of Liquidity Concept.
BTCUSDT BUYING AND SELLING SETUP !🔻 SELLING ZONE: 119,817 – 120,215
🔴 VERY STRONG SELLING ZONE: 120,700 – 121,122
🟢 BUYING ZONE: 115,823 – 116,392
✅ VERY STRONG BUYING ZONE (Buy Limit): 109,221
Watch these zones closely for potential entries. Wait for confirmation before executing trades and always follow proper risk management.

Downtrend to trendsupportHey guys, i this is my prediction for bitcoin. I believe it will drop to my trend support and become a resistance. If it goes below that it would turn into a ranged market and no longer be a trend anymore. Also, once the downtrend is over, it would hit my demand area. I do have some old analytics on this chart, i assumed it would be an uptrend a while ago, but as soon as it went beyond my buy area, i knew it might be a breakout.

Bitcoin beginning a 12 hour reversal formation?(Inverse chart)I believe we are working on a top (bottom) of this 12 hour chart. If I am right this will result in a swing fail and begin a string reversal
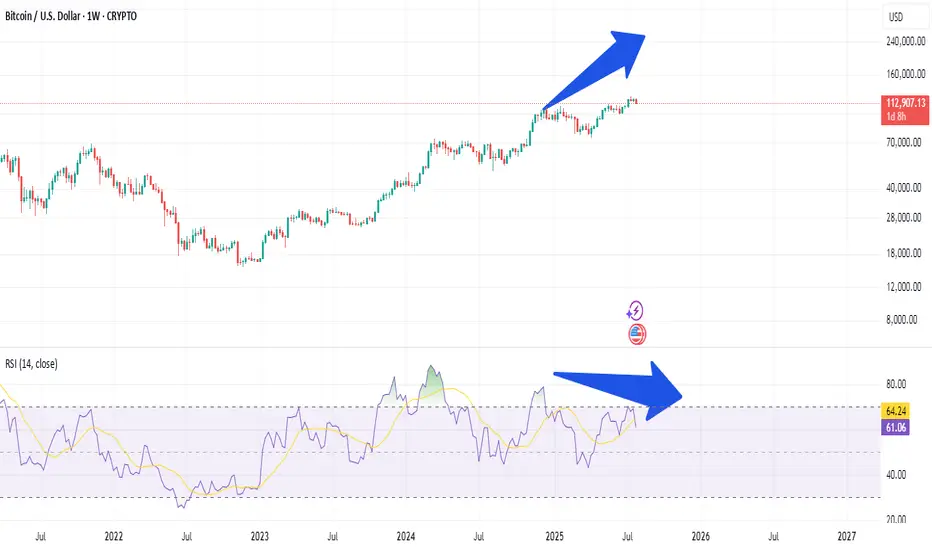
btcwow...!!!!!!!
btc have negative divergence in weekly time and it can be start down trend or correction trend
this analyse is not 100% true but it can probebly
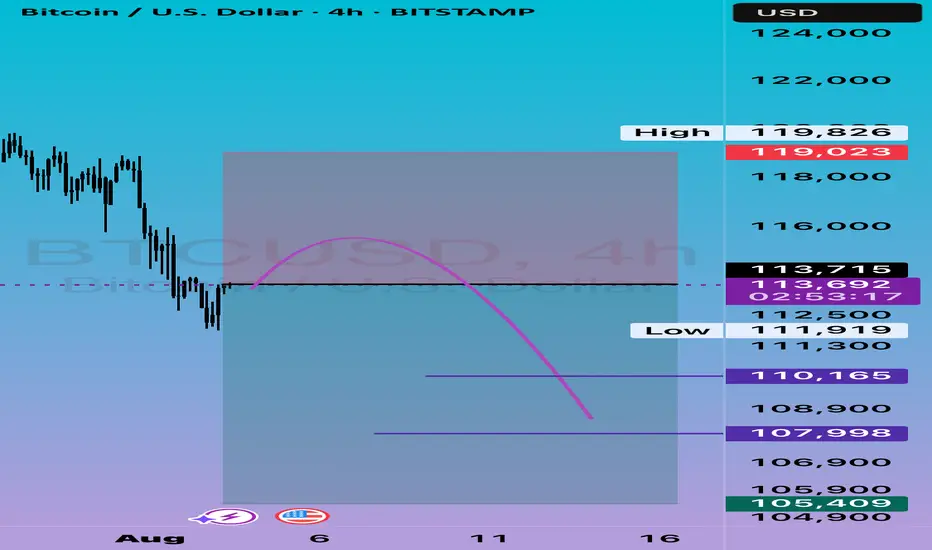
Corection?Frankly, I'm confused. The 4-hour trend is broken, and there's a possibility of a bad weekly candlestick... A correction down to the lower channel is likely for a while. Of course, 2% fluctuations are possible.
$76k incoming. Will Bitcoin de-couple from the altcoins? BTC.DCOINBASE:BTCUSD $76K incoming. Will Bitcoin de-couple from the altcoins? BTC.D
BTC; Heikin Ashi Trade IdeaAfter a correction, price may have a good reaction from first demand area I have marked.
Lower demand zone is even more valid, since we see manipulation and then impulsive move to the oposite side.


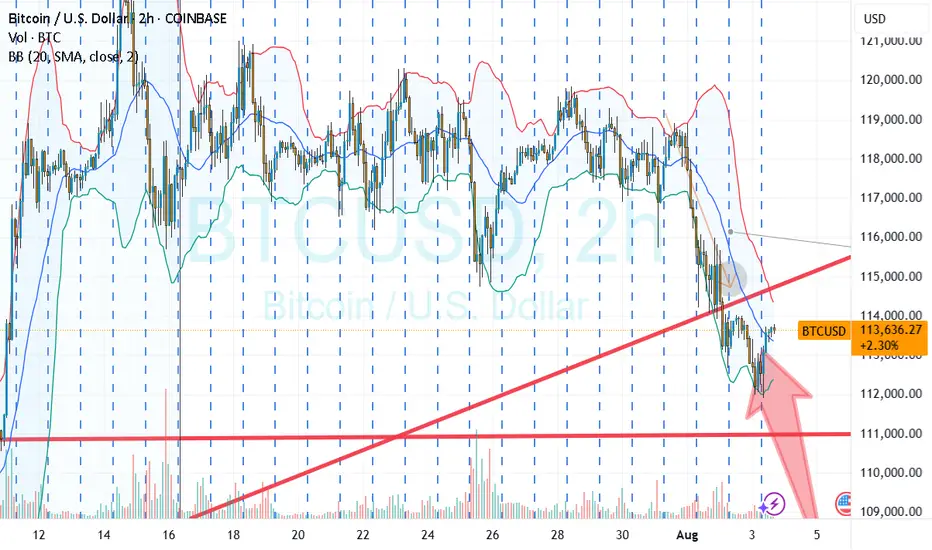
One of these lines will be right..I expect a pump in the next 2 days otherwise we will fall and continue on the next support line. Odds are 70/30

BTC VS AI ?Hi
I had asked AI the probabilities and projection from previous moves.
So here goes; as you know accuracy is vague and shall not be absorb as 100%
Just analysis and probabilities.
Need clearer confirmation when taking a trade .
Given that the current price is 113,000, let's analyze whether the price has extended beyond previous retracement projections and then develop the next projection accordingly.
Recap from previous data:
Second move: price moved from 99,000 to 122,000
Projected retracement price (29.41%) was approximately 115,236
Current price at 113,000 is below 115,236 (projected retracement), meaning it has retraced more than expected before potentially continuing upward.
Interpretation:
Since 113,000 < 115,236, the price has actually retraced deeper than initially projected from the previous move.
This could suggest a stronger correction or weakness in the upward movement before continuation.
If the price started at 122,000 high and retraced below the anticipated retracement level, it may find support around current or slightly lower levels before attempting to move higher again.
Next projection based on current price of 113,000:
New retracement % on second move:
Move up: 122,000 - 99,000 = 23,000
Actual retracement: 122,000 - 113,000 = 9,000
Actual retracement % = (9,000 / 23,000) × 100 ≈ 39.13%
Updated retracement level is closer to a Fibonacci 38.2% retracement level, which is a common retracement level in markets.
Project next upward move:
Use the previous average upward move for projection: 28,500 (from prior analysis).
Starting point for next move projection: 113,000 (current price after retracement)
Next projected high = 113,000 + 28,500 = 141,500
Probabilities:
Retracement around 38.2% usually has a probability around 20-25%, slightly less frequent than 29-30%, but still common.
Uptrend continuation probability after retracement remains >60% if the trend is strong .
Summary Table with updated data:
Feature Value
Current Price 113,000
Previous High 122,000
Move Up Range 23,000
Actual Retracement Amount 9,000
Actual Retracement % 39.13%
Projection for Next High 141,500
Probability of 39% Retracement 20-25%
Probability of Uptrend Continuation >60%
Conclusion:
The price has retraced more than initially projected from previous data but still within reasonable common retracement levels (around 38%).
Assuming the uptrend holds, the next price move could push toward approximately 141,500.
It’s advisable to watch key support levels near 113,000 for signs of reversal or further retracement.
All the best
Lets see in we can trust it
Not a guru
