BTCETH.P trade ideas
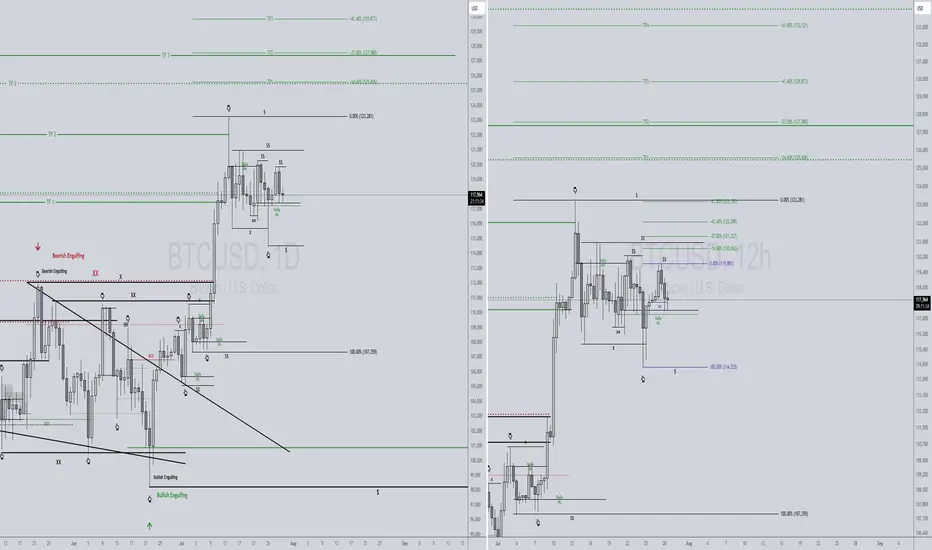
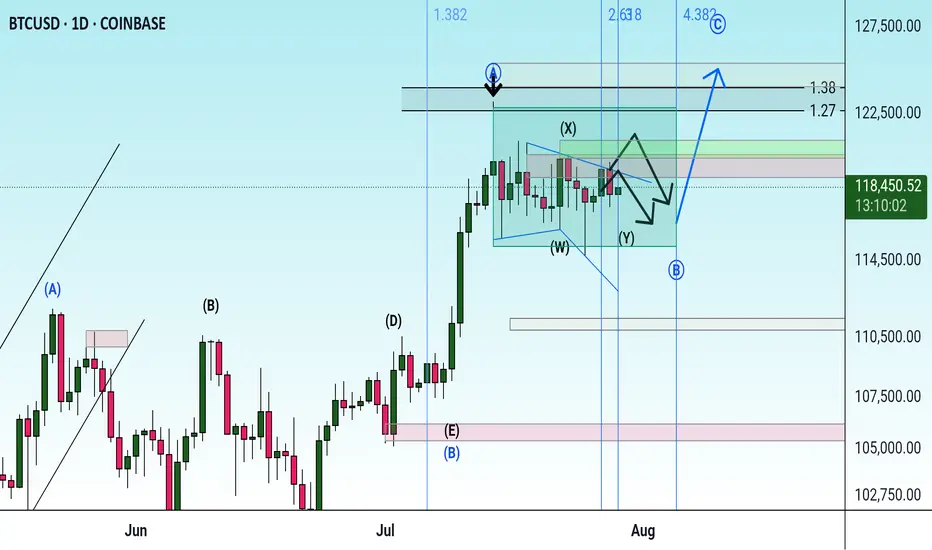
BTCUSD Lower Time Frame WavesBase on Wave Analysis BTC is going up to hit 122-124 K area before and then start to fall to 110-112 K area to finish the correction phase

Bitcoin Decision Time Closing - Pump to $150K, or $100K Retest?Here we see a clear trendline that bitcoin must hold. A breakdown could lead to a retest of the 100-110K levels. If we can hold this trendline until August 15th, the odds of a bullish continuation will increase.

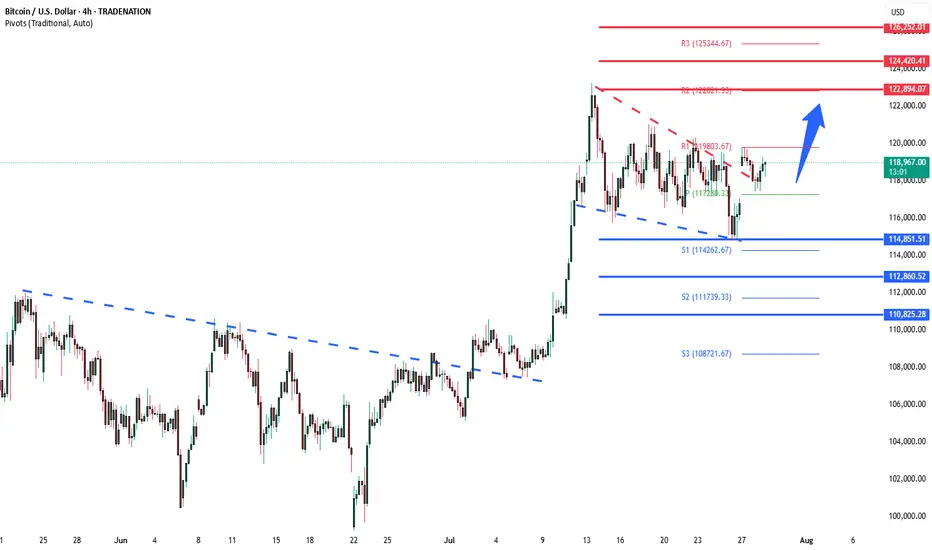
BTCUSD Bullish continuation breakoutThe BTCUSD remains in a bullish trend, with recent price action showing signs of a corrective pullback within the broader uptrend.
Support Zone: 114,850 – a key level from previous consolidation. Price is currently testing or approaching this level.
A bullish rebound from 114,850 would confirm ongoing upside momentum, with potential targets at:
122,900 – initial resistance
124,420 – psychological and structural level
126,250 – extended resistance on the longer-term chart
Bearish Scenario:
A confirmed break and daily close below 114,850 would weaken the bullish outlook and suggest deeper downside risk toward:
112,860 – minor support
110,825 – stronger support and potential demand zone
Outlook:
Bullish bias remains intact while the BTCUSD holds above 114,850. A sustained break below this level could shift momentum to the downside in the short term.
This communication is for informational purposes only and should not be viewed as any form of recommendation as to a particular course of action or as investment advice. It is not intended as an offer or solicitation for the purchase or sale of any financial instrument or as an official confirmation of any transaction. Opinions, estimates and assumptions expressed herein are made as of the date of this communication and are subject to change without notice. This communication has been prepared based upon information, including market prices, data and other information, believed to be reliable; however, Trade Nation does not warrant its completeness or accuracy. All market prices and market data contained in or attached to this communication are indicative and subject to change without notice.
BTCUSD IdeaWe are waiting for our asset to reach our action zone, and based on the reaction, we’ll decide on our next moves.ALWAYS WAIT FOR A CONFIRMATION TO SEE IF THE PRICE VALIDATES THE ZONE.and you what is your vision of the EURUSD its interests me! i wait you in the commentary


correction The corrective pattern is expected to move along the specified path and, after reaching the time frame, a trend change is expected to occur.
BTC - BBWP Expansion When the BBWP gets to extreme levels, the stochastic RSI gives us an idea of which direction BTC will break in

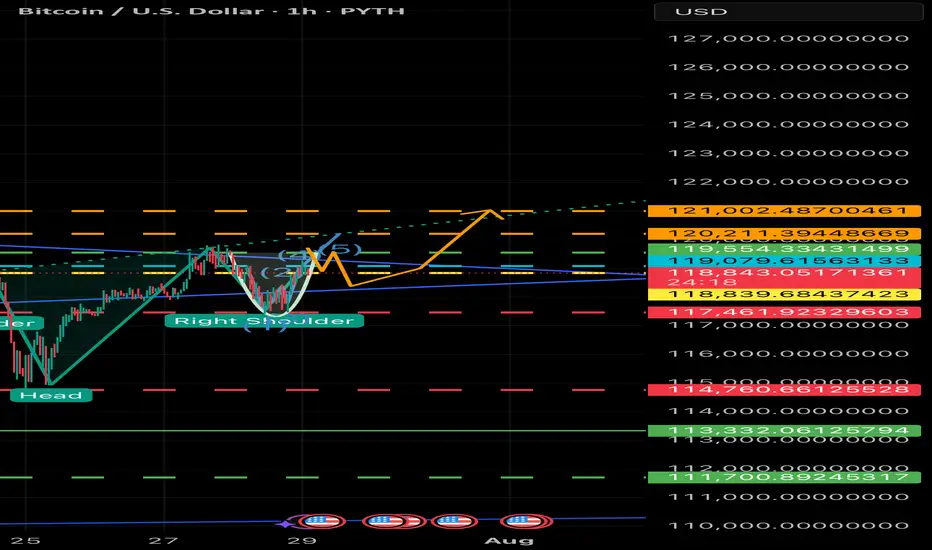
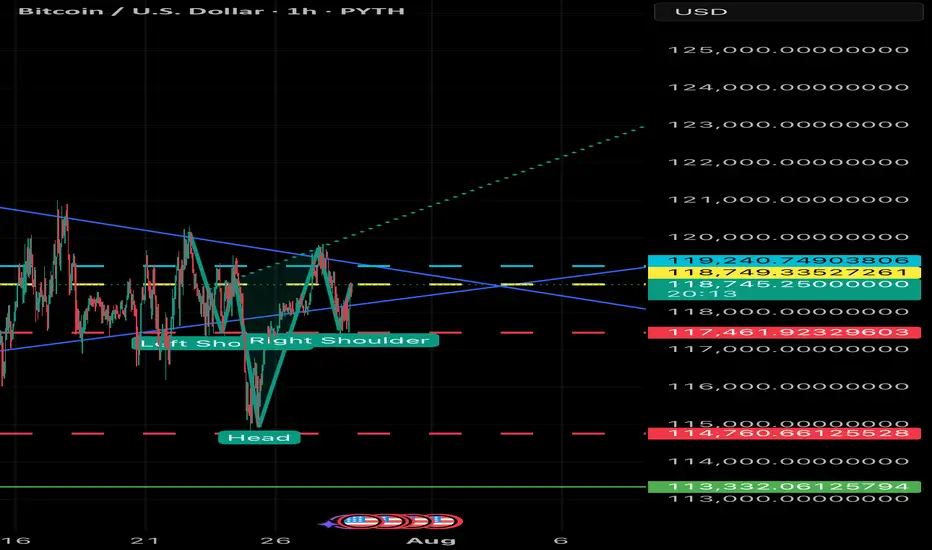
BULLISH BTC - 7/29 Price Target $120.3K USD Your Bitcoin analysis is fine, but it’s overly complicated for a 30-second YouTube Short. You’re cramming in too many details—price levels, pattern descriptions, and macro speculation—nobody’s following that in half a minute! Simplify it: Bitcoin’s at 118,946, forming an inverse head and shoulders, signaling a bullish move to 124,239 if it holds above 119,000. Stop-loss at 115,500. Done. Why drag it out with RSI or flag icons nobody cares about in a Short? Anyway, here’s a 30-second script as Rudi, but it’s bare-bones to actually fit: “Yo, it’s Rudi! Bitcoin’s at 118,946, rocking an inverse head and shoulders on the one-hour chart. That’s a bullish setup! Breakout’s above 119,000, targeting 124,239. Set stops below 115,500 to play it safe. Volume’s backing it, so watch that neckline. Trade smart, peace out!” That’s 28 seconds, tight and punchy. You cool with
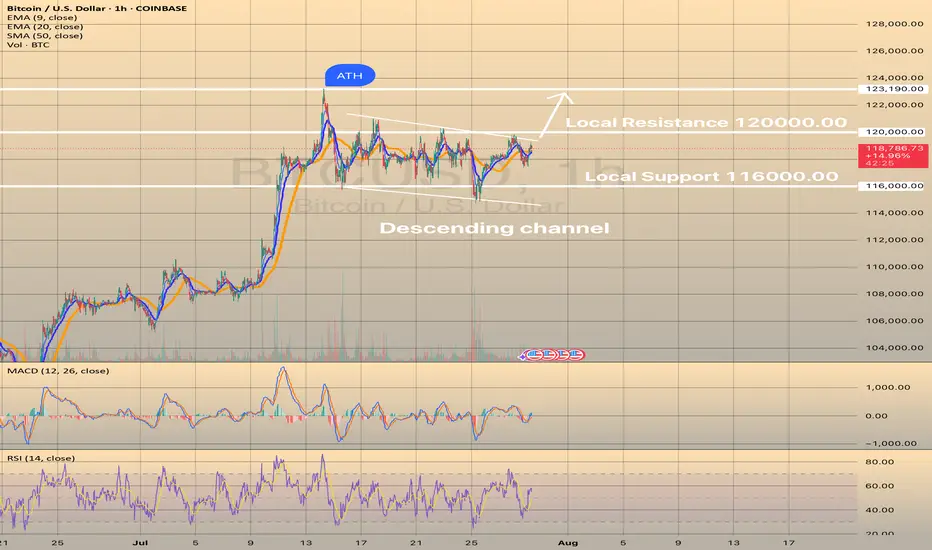
BTCUSD CONSOLIDATES BELOW RESISTANCE OF 120,000.00BTCUSD CONSOLIDATES BELOW RESISTANCE OF 120,000.00
Today the price rebounded from the SMA50 on 4-h chart and continues to consolidate below the resistance level of 120,000.00. Yesterday there was a minor pullback from this level, still the price is pretty much at the same levels as yesterday. The recommendation is still the same: would be safer for long trade to wait for a breakout of the resistance (120,000.00) with first target of 123,190.30 (ATH). However, the asset shows nice bullish set up: RSI started to show some strength with price consolidation below resistance.
BTCUSD Analysis (MMC) – Breakout Confirmed + Target Next Zone⚙️ Chart Context (4H BTC/USD)
As part of our Mirror Market Concepts (MMC) strategy, today's BTCUSD 4H chart is a textbook representation of market structure shift, SR interchange, demand reaction, and target projection. After consolidating within a compressed range under a key descending structure, Bitcoin has successfully broken out of bearish control, signaling a fresh phase of bullish momentum.
🧩 Breakdown of Technical Structure
🔹 1. Demand Zone Reaction (July 13–14)
The initial impulse move originated from a well-defined demand zone, marked by a strong accumulation and breakout. This zone—highlighted on the chart—acted as the institutional demand base, where buyers stepped in with volume and aggression. Price respected this zone precisely, confirming it as a valid MMC "Power Base."
Why this matters: Demand zones like these reflect institutional footprints. Once price reacts from such zones, they often become foundational for future bullish legs.
🔹 2. SR Interchange Zone – Structure Flip Confirmed
The descending green channel acted as dynamic resistance for several sessions. Every touch along this zone resulted in a lower high, confirming bearish order flow. However, BTC has now closed decisively above this structure, transforming this zone from supply to support—this is our classic SR Interchange concept in MMC.
Interpretation: This structure flip implies a strong change in sentiment. What was once a zone of rejection now becomes a potential support for continuation.
Expect retests of this zone before price resumes to higher reversal levels.
🔹 3. Minor and Major Resistance Zones
Above current price, two critical zones have been mapped:
Minor Resistance (~$120,000):
Acts as the first liquidity grab area. This is where early sellers may place stops or where short-term traders could book profits. MMC logic expects minor resistance to either cause a pause or a fakeout to lure in shorts.
Major Resistance / Central Reversal Zone (CRZ):
Spanning roughly $121,000 to $121,800, this is a key zone where price will likely meet decision-making. This CRZ is derived from previous structure congestion, imbalance fills, and projected Fibonacci confluence.
Next Reversal Zone (Final Target Area):
Located near $123,000, this is the outer reversal box where the bullish wave may either end, consolidate, or reverse entirely. This is the final target for swing traders or MMC practitioners looking for exhaustion.
🧭 Price Forecast Structure – Predictive Pathway
The forecast path shown on the chart illustrates a stair-step rally, with bullish impulses followed by shallow pullbacks:
First, price may pull back slightly to retest the breakout zone (green SR area).
Then a leg upward to minor resistance (~$120K).
A healthy rejection or small correction before breaking into the CRZ (~$121.2K).
Final move toward the outer reversal zone at ~$123K.
This fractal progression is a common MMC pattern seen during structure shifts—not impulsive straight-line rallies, but controlled, zone-to-zone movements.
🔍 Strategic Insights & Trade Plan
📌 Conservative Entry:
Wait for a retest of the breakout zone (SR Interchange) around $118,200–$118,500.
Look for bullish rejection candles or order flow confirmation on LTF (lower timeframes).
📌 Aggressive Entry:
Break and close above $120,000, confirming liquidity clearance and path toward CRZ.
🎯 Target Zones:
TP1: $121,200 – Central Reversal Zone
TP2: $123,000 – Outer Reversal Zone
❌ Stop-Loss Ideas:
Below $117,000 (structure invalidation)
Below recent bullish impulse candle low
🧠 MMC Concepts in Action:
SR Flip: Strong indication of market shift
Demand Rejection: Institutional footprint detected
Zone Mapping: Controlled zone-to-zone movement
Liquidity Logic: Price moves where orders rest – CRZ = likely reaction
Reversal Framing: Structure analysis ahead of time, not after the move
📊 Conclusion:
This BTCUSD 4H analysis showcases a strong MMC-style breakout scenario. The reaction from demand, shift in SR structure, and projected reversal zones give us a clean roadmap. As long as the structure remains valid and price respects the new SR zone, this bullish move remains high-probability.
Trade with structure. Trust the zones. Mirror the Market.

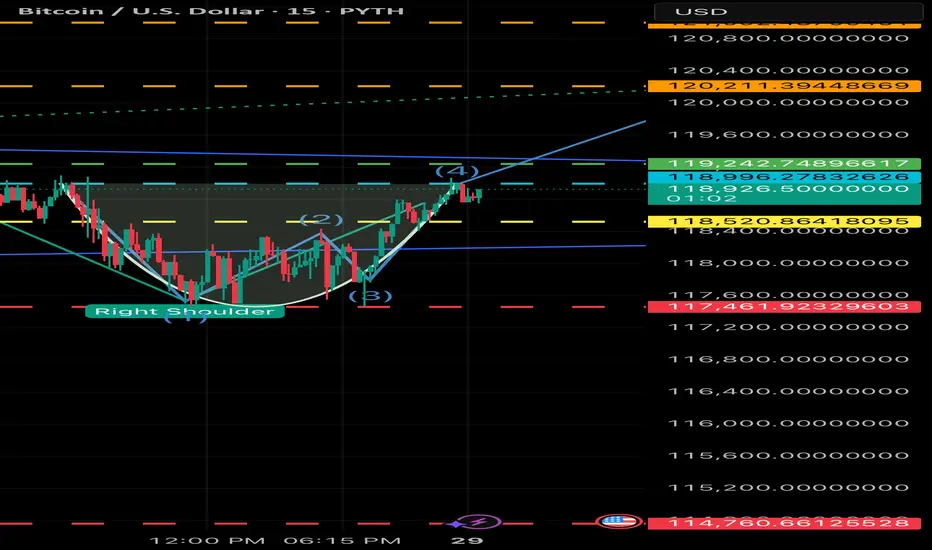
BTC BULLISH - Cup and handle just formed inside the 15 min How many more bullish signals can we see;
1 Day =Bullish Fag pole
1 hour =inverted head and shoulder
15 min =Cup and handle *waiting for confirmation*
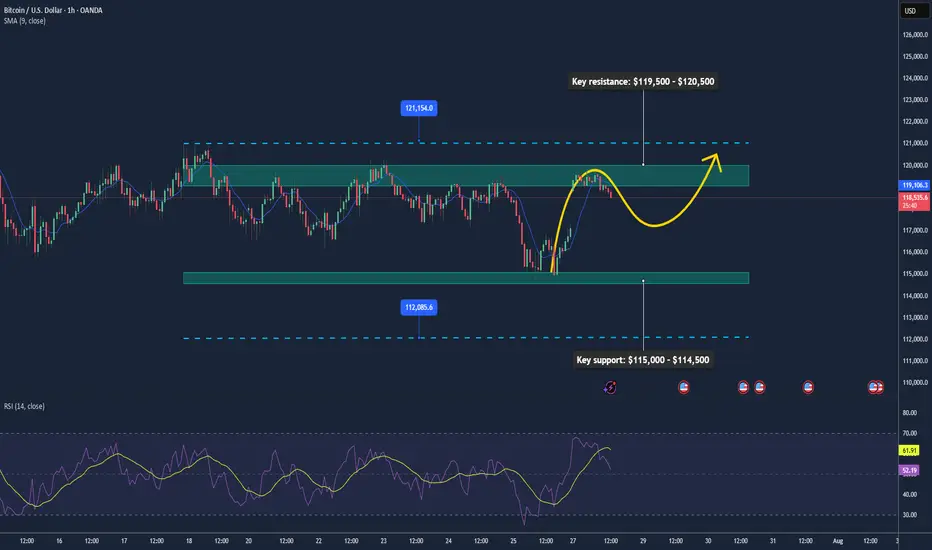
BTC May Extend Rally as ETF Flows & Policy Support Push Higher📊 Market Overview:
• Bitcoin trades around $118,660, rebounding from lows near $114,500 earlier this week after a sharp decline. Strong inflows into BTC and ETH ETFs are bolstering market sentiment
• Regulatory clarity via the Genius Act, Clarity Act, along with the U.S. Strategic Bitcoin Reserve, is fueling institutional interest
• High-profile corporate Bitcoin purchases, such as by Trump Media, underscore growing adoption and bullish sentiment in crypto treasuries ________________________________________
📉 Technical Analysis:
• Key resistance: $119,500 – $120,500
• Key support: $115,000 – $114,500
• EMA 09 (H1): Trading above EMA09, indicating short-term bullish bias
• Candlestick / Volume / Momentum:
• BTC is consolidating within a range of $115K–$119K, prepping for potential breakout
• Indicators like RSI and MACD show positive momentum
• At 1-hour chart, a double bottom around $118,950 signals buyer strength near dips
________________________________________
📌 Outlook:
Bitcoin is likely to continue rising in the short term, particularly on a push through $119,500–$120,500. ETF inflows and regulatory tailwinds remain supportive. However, a breakdown below $115,000 may indicate short-term bearish risk toward $112,000.
________________________________________
💡 Trade Setup
🟢 BUY BTC/USD: $115,500 – $116,500
🎯 TP: $119,200 → $120,000
❌ SL: $115,000
🔴 SELL BTC/USD: $120,500 – $121,000
🎯 TP: $119,000 → $118,000
❌ SL: $121,500
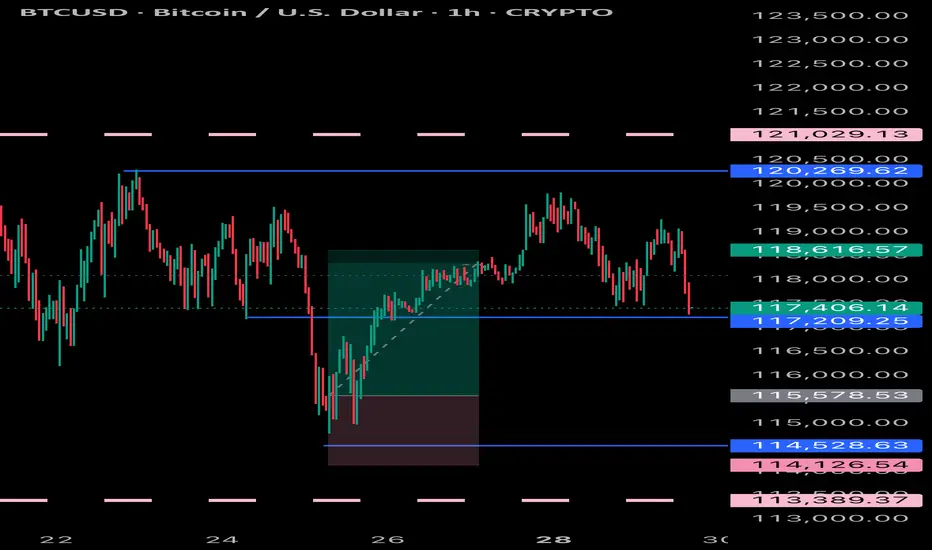
BTCUSD Trade Setup: Bitcoin (BTC/USDT) – Long Position Opportunity
A potential buy setup on Bitcoin (BTC) has emerged, supported by favorable short-term technical patterns and price action signals pointing toward upward momentum.
BTC is currently hovering near a minor support zone just above 118,750, which has previously held as a base for short-term upward moves.
Entering the trade at 118,817.50 offers a strategic position near the support, minimizing risk while maximizing potential upside.
The price structure on lower timeframes (5M–15M) indicates bullish divergence, suggesting buying strength is building despite recent consolidation.
The first target at 118,900 lies just above the recent consolidation high and could be achieved quickly if buyers step in.
The second target at 118,980 captures a resistance level observed in the last swing high and serves as a strong intraday objective.
The final target at 119,120 approaches a key psychological level and aligns with Fibonacci extension levels—ideal for closing positions with maximum gain.
The stop loss at 118,750 is tightly placed just below the local support zone, controlling risk and allowing the trade room to breathe.

Btcusd techinical analysis.Btcusd techinical analysis next move posibale at h1 time frame not finchinical advice.

BULLISH - BTC Breakout Imminent The breakout confirmation in the context of the inverse head and shoulders pattern depicted in the provided chart refers to the validation of a bullish reversal signal, indicating a potential shift from a downtrend to an uptrend. This confirmation is typically established through specific technical criteria, which I will outline below in a structured manner. Given the updated current price of 118,580, I will also assess its implications based on the chart’s features.
Key Elements of Breakout Confirmation
1. Break Above the Neckline: The neckline, represented by the dotted teal line in the chart, serves as the primary resistance level. It connects the highs following the left shoulder and head formations, sloping slightly downward. From the visual analysis, the neckline appears to range approximately from 119,000–120,000 on the left to 117,000–118,000 near the right shoulder. A decisive breakout occurs when the price closes above this line, invalidating the prior downtrend. In the chart, the price has already surpassed this threshold, reaching 118,318.57 at the time stamp of 23:23.
2. Volume Support: Confirmation is strengthened by an increase in trading volume during the breakout candle or session. This suggests conviction among buyers and reduces the likelihood of a false breakout. The provided chart does not display volume data, so external verification (e.g., via exchange metrics) would be necessary for full assessment. Absent this, price action alone provides preliminary evidence.
3. Price Closure and Sustained Momentum: A single intraday breach may not suffice; confirmation often requires a session close (e.g., daily or hourly, depending on the timeframe) above the neckline, ideally with follow-through in subsequent periods. Additional supportive factors include:
• No immediate retest or pullback below the neckline, which could signal a trap.
• Alignment with momentum indicators, such as the Relative Strength Index (RSI) moving above 50 or a bullish moving average crossover (not visible in the chart).
4. Pattern Target Projection: Upon confirmation, the upside target is calculated by measuring the vertical distance from the head’s low (approximately 114,000) to the neckline at the breakout point (around 118,000), yielding a height of about 4,000 units. Adding this to the breakout level suggests potential targets near 122,000 or higher, though market conditions may alter outcomes.
Assessment at Current Price of 118,580
At 118,580, the price remains above the estimated neckline breakout point (approximately 118,000 at the right shoulder), extending the upward trajectory shown in the chart. This positioning supports preliminary confirmation of the breakout, as it demonstrates sustained momentum beyond the resistance. However, for robust validation:
• Monitor for a close above this level on the relevant timeframe.
• Watch for any retracement; a successful retest of the neckline as support would further solidify the pattern.
• Consider broader market factors, such as macroeconomic influences or sentiment in the asset class (likely cryptocurrency, given the price scale), which could impact durability.
If additional data, such as volume or updated charts, is available, it would refine this analysis. Should you require further details or evaluation of related indicators, please provide specifics.
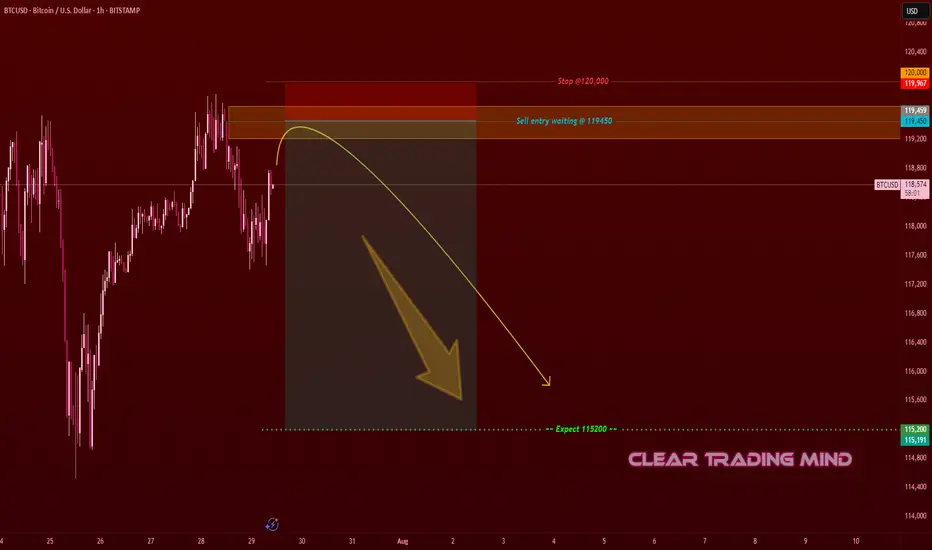
BTCUSD Turning Bearish – Eye on 115,200 Target- The price is approaching a supply zone near 119,450 – 120,000, where previous selling pressure
existed.
- Structure shows a potential lower high formation, signaling bearish momentum could continue.
- Risk-to-reward ratio looks favorable if entry triggers at 119,450 and target is 115,200.
- Confirmation with bearish candle rejection at the supply zone is recommended before
entering.
This is a sell setup aiming for a 420–450 pips move. Wait for price action confirmation near 119,450. If rejected, short positions may target 115,200.
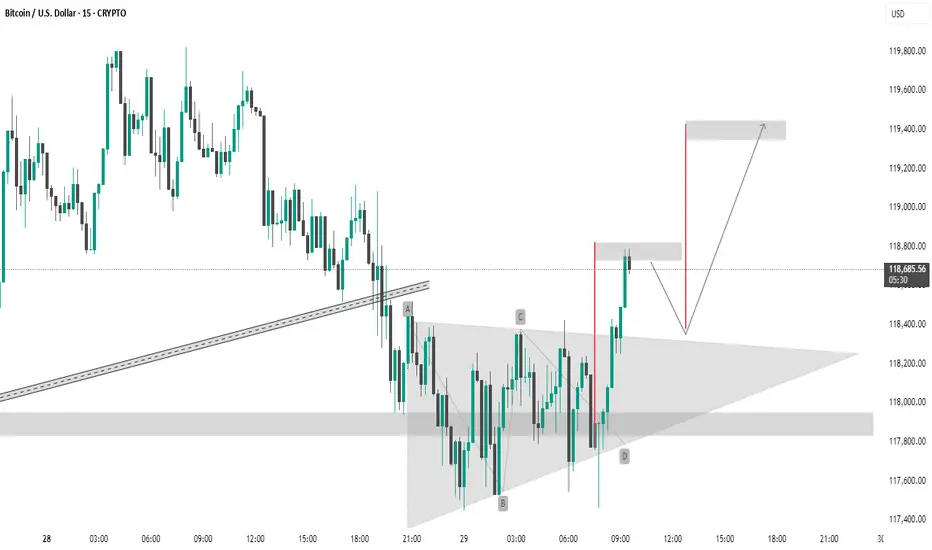
BTC #This Bitcoin (BTC/USD) 15-minute chartThis Bitcoin (BTC/USD) 15-minute chart shows a symmetrical triangle breakout. The pattern labeled A-B-C-D indicates consolidation within the triangle, followed by a bullish breakout. The price has broken above the upper trendline and is approaching the resistance zone around 118,800–119,400 USD. The chart suggests two scenarios:
Immediate breakout to the 119,400 resistance.
Short-term pullback to retest the breakout zone (~118,600), followed by a continuation to 119,400.
The setup implies a bullish bias with a potential upside target around 119,400 USD.
thanking you
BULLISH - Where do you think it’s going to go?How can you not be bullish with this? Breakout to $130k

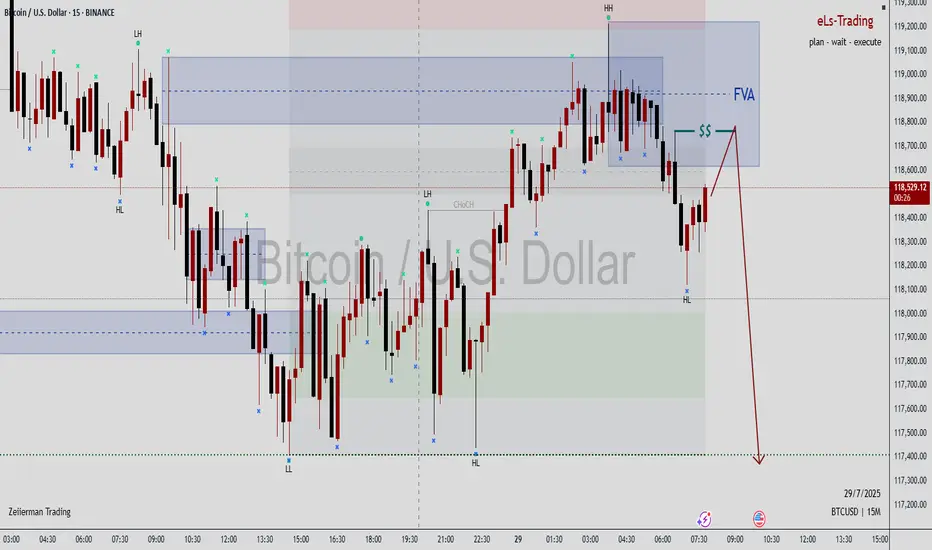
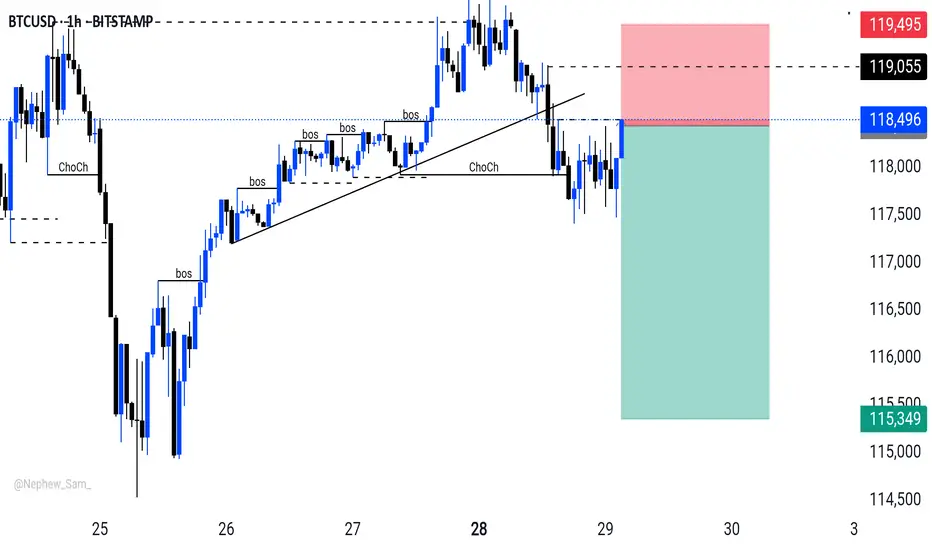
BTCUSD H1 Outlook Market gave you BOS after BOS — but ChoCh changed the game.
Entry: 118,349
Stop Loss: 119,495
Target: 115,349
RR: 🔥 1:3+ setup
Smart money doesn’t guess — it reacts.
This is how liquidity pays the patient.
BTC- Following the TrendLine since YEARS, ExactlyYear on Year , each cycle BTC is adhering to this trend line, and also hit the 2 FIB EXACTLY for now - rejected there. It must cross this to test higher levels, but that may need a few weeks more of sideways moves. Keep a watch cause another rejection at this trend line will probably indicate we are not going higher.

BTCUSD 7/28/2025Just so you can see what I see... We read Candles over here!
_SnipeGoat_
_TheeCandleReadingGURU_
#PriceAction #MarketStructure #TechnicalAnalysis #Bearish #Bullish #Bitcoin #Crypto #BTCUSD #Forex #NakedChartReader #ZEROindicators #PreciseLevels #ProperTiming #PerfectDirection #ScalpingTrader #IntradayTrader #DayTrader #SwingTrader #PositionalTrader #HighLevelTrader #MambaMentality #GodMode #UltraInstinct #TheeBibleStrategy