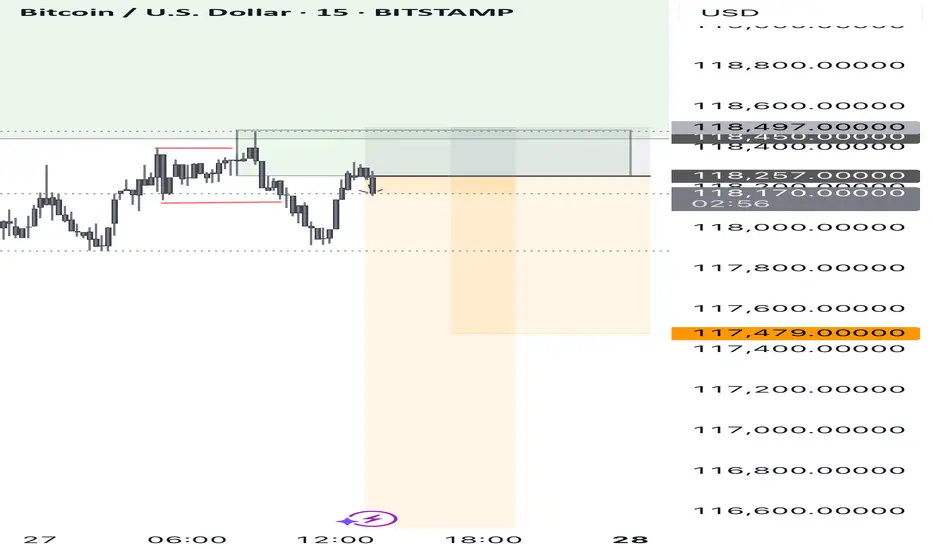
double long ON BITCOIN hey .
as you saw in the previous trade and forcast we are long on the bitcoin
we got another beautiful confirmation
so i m puting a second long and already put the first on the break even :)
BTCETH.P trade ideas
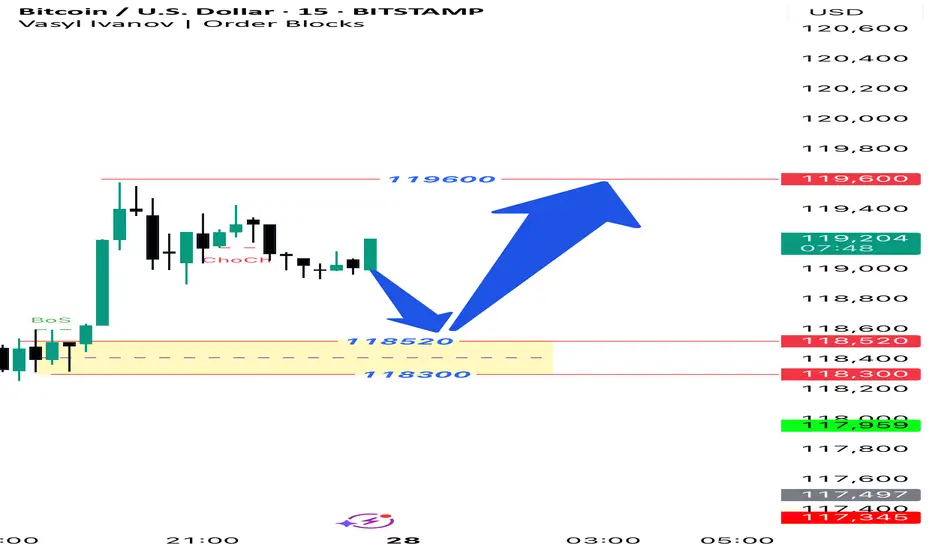
BTCUSD 15M Setup The trend is up in the 1-hour timeframe, so we are looking for buying opportunities in the 15-minute timeframe. We expect the price to fall to the range of 118,520 to 118,300 and then rise to the target of 119,600 and above.
BITC Analysis: Targeting 10% Upside with 1:4 Risk-RewardHi, here's my view on BITC. I believe it will move up by around 10% soon. The stop-loss is set at 2.5%, giving a risk-reward ratio of 1:4.
I'm doing this purely for learning purposes. Let’s see how it plays out. 🙂

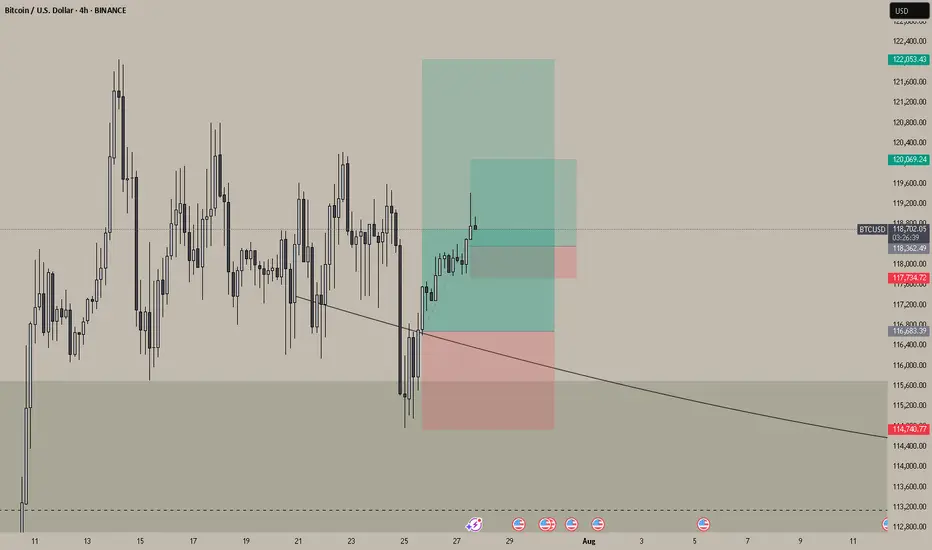
BTC mid term uptdateI will be carefull at 122.000 secure positions and taking profits as one more fall is very possiblo to 113.500 before new all time highs
Levels Highlighted
GG


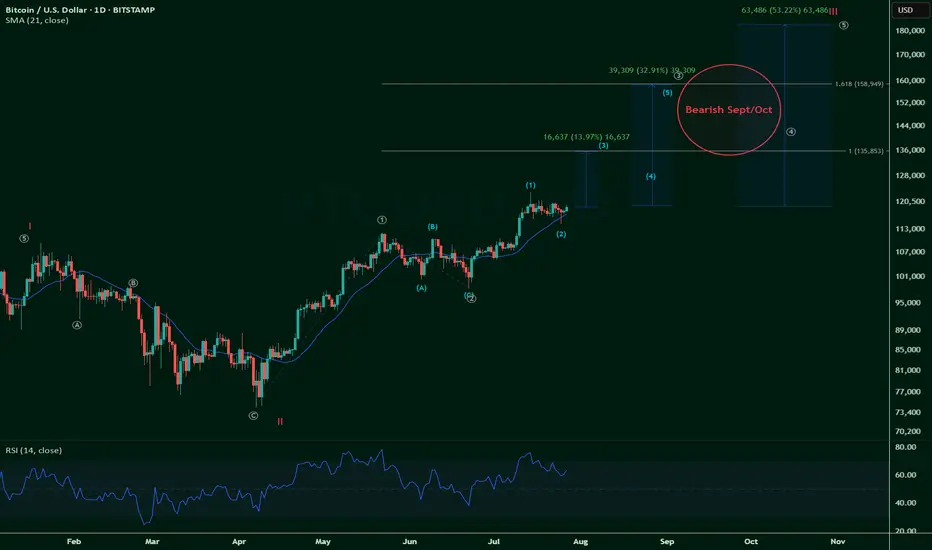
$BTCUSD - Bullish 2025 - Cycle Wave III up (eta Dec2025)NOT FINANCIAL ADVICE
Let's start with this bullish outlook on Bitcoin and its various phases:
Here, I estimate the likelihood of CRYPTOCAP:BTC 's journey through its Cycle Wave III.
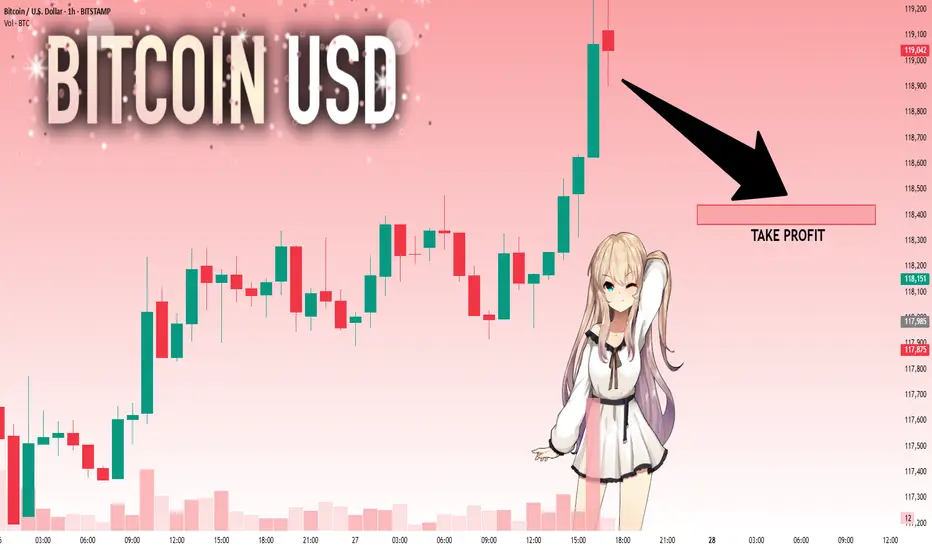
AI Generated Bitcoin Prediction: No ATH This Week! 📉 AI Generated Bitcoin Prediction: No ATH This Week! 🚫📈
Euphorisme is what traps people... watch out.
📌 Overview
In this 1H Heikin Ashi chart for BTC/USD, a clear AI-generated prediction outlines a volatile week ahead, but with no signs of a new all-time high (ATH). While price action recently broke above key resistance levels around $119,300–$119,570, the projected trajectory is more cautious than bullish.
The blue line overlay sketches a speculative wave structure — an AI-based forecast — suggesting multiple failed attempts to break above $122,165, a level that coincides with previous rejection zones.
🔍 Key Technical Levels
Level Significance
$122,165 Major rejection level
$120,916.94 Resistance + liquidity zone
$119,568.92 Immediate rejection area
$118,313.11 EMA & SMA cluster support
$118,185.55 Short-term support
$117,893.78–$118,037.81 Bull trap range
⚠️ Why You Should Be Cautious
The AI-predicted price action shows a pattern of rising highs followed by sharp reversals.
Multiple red inverted triangles suggest lower high formations, a sign of weakening bullish momentum.
Current levels around $119,300 are still within a macro supply zone, with price likely to consolidate or retrace.
🧠 Psychological Trap: Euphoric Longing
Markets often punish emotional entries — and euphoric breakouts like we saw at $119,500 tend to trigger FOMO longs. This is where smart money exits, not enters.
“If it feels like you're late to the move, you probably are.”
🔄 Mid-Term Scenario
If the AI prediction holds:
Expect volatility with fake breakouts.
Watch for distribution near $122K.
A potential drop toward $118K–$117.8K may offer a better re-entry.
📆 Macro Context
The week is filled with economic events (marked below the chart), and the AI model seems to expect choppy reactions, not a clear breakout. These red calendar icons often correlate with increased volume and traps.
🧩 Strategy Suggestion
Avoid chasing pumps into resistance zones.
Wait for confirmation or deviation from the projected path.
Consider setting alerts near $122K and $118K to monitor key reactions.
🧠 Final Thought:
ATH is a process, not an event. If the AI is right, we’re not there yet.
“Let the herd long the top, and let you short the trap.” – Smart Money
💬 Share your thoughts below. Do you agree with the AI's prediction?
🔔 Follow for more predictive insights & logic-backed analysis.
#Bitcoin #BTCUSD #CryptoTrading #NoATH #SmartMoney #TradingPsychology #EuphoricTrap #HeikinAshi #BTCAnalysis

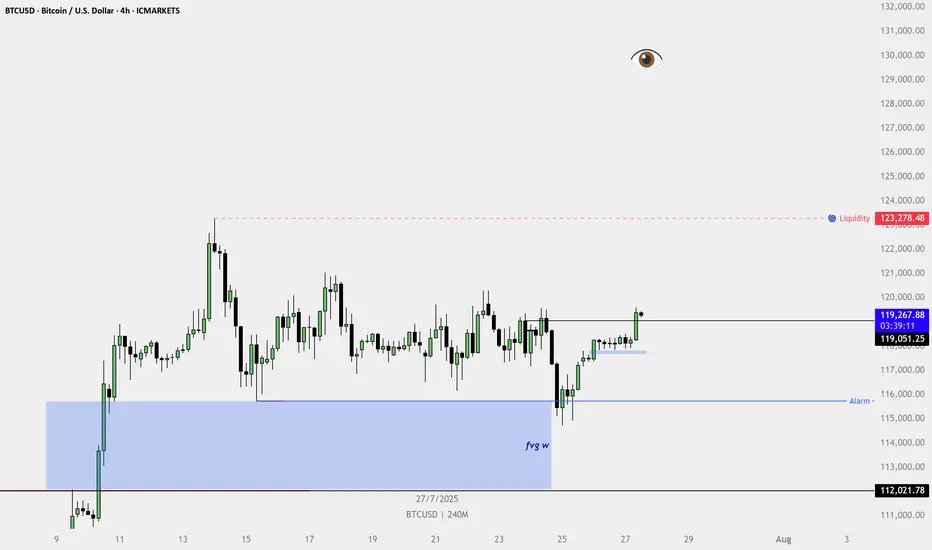
BTCUSD 4H chart is clearly showing a bullish structure.🔍 Technical Highlights:
HTF FVG Tap (Marked as "fvg w"):
Price reacted strongly from the weekly fair value gap, indicating institutional buying interest from a higher timeframe demand zone.
Higher Low + Bullish Break:
Price formed a higher low and broke above the recent swing high, confirming a shift to bullish structure.
4H Bullish FVG Formed:
After the breakout, a fresh bullish FVG formed on the 4H chart — a classic sign of momentum and continuation.
Breaker Structure Confirmed:
Price closed above a series of bearish candles, confirming buyer strength and trapping late sellers.
Internal Liquidity Taken:
The range-bound consolidation (chop) has been swept, clearing out internal liquidity and fueling the breakout.
BTCUSD: Bears Are Winning! Short!
My dear friends,
Today we will analyse BTCUSD together☺️
The in-trend continuation seems likely as the current long-term trend appears to be strong, and price is holding below a key level of 118,973 So a bearish continuation seems plausible, targeting the next low. We should enter on confirmation, and place a stop-loss beyond the recent swing level.
❤️Sending you lots of Love and Hugs❤️
BTC wait for entryBTC has broken above the long-term weekly resistance (dating back to 2021) and is now consolidating above that key level.
On the 4H timeframe, price action is forming a descending wedge, a structure often associated with potential bullish breakouts. Two primary scenarios are unfolding:
Scenario A: Price continues to decline within the wedge, potentially reaching the high-liquidity demand zone (highlighted in yellow). A strong bounce is expected from this area.
Scenario B: A breakout occurs before liquidity is swept—suggesting stronger buyer momentum and early bullish confirmation.
Trade entries will be aligned with whichever scenario plays out, with confirmation signals provided in the accompanying chart.
Disclaimer:
This analysis is based on my personnal views and is not a financial advice. Risk is under your control.

Diminishing return target ideaA concept grounded in the recurring four-year market cycles, taking into account the observable logarithmic trend lines of diminishing returns with each successive cycle

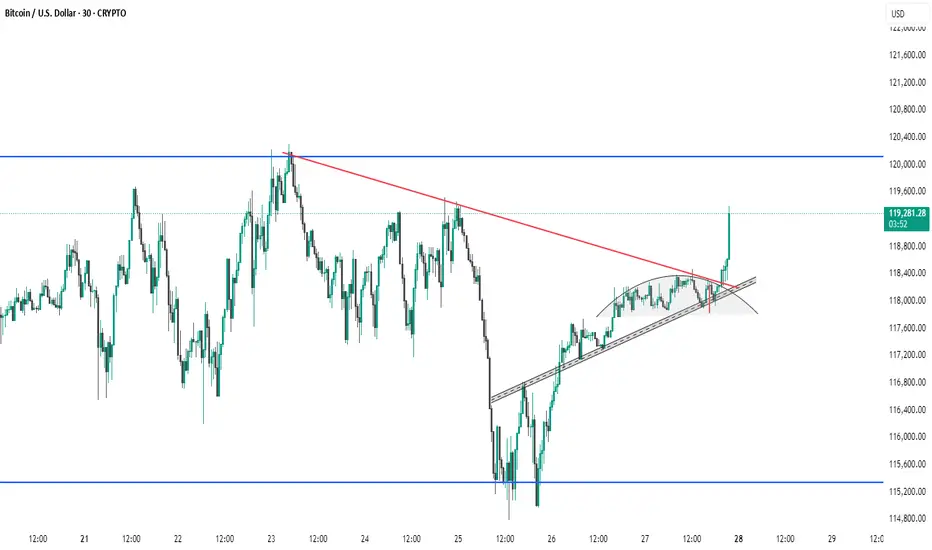
BTC #Bitcoin (BTC/USD) 30-minute chart shows a recent breakThis Bitcoin (BTC/USD) 30-minute chart shows a recent breakout above a descending trendline (red) and an ascending wedge pattern. Price has broken out of a rounding structure, indicating a potential bullish reversal. The breakout candle is strong, suggesting bullish momentum. Key resistance lies near 120,000 (blue horizontal line), while support is around 115,600. Watch for confirmation of the breakout with volume or a retest of the breakout level for sustained upward movement.
thanking you
BTC - Long!The last few weeks flagging out of this Inverse H&S Fridays is already bullish, Fridays fakeout lead to a 4HR 2022 iFVG ICT model, Bullish, Not much more to say other than see you at 140k+.
Riding sep OPEX IBIT $70 Calls.
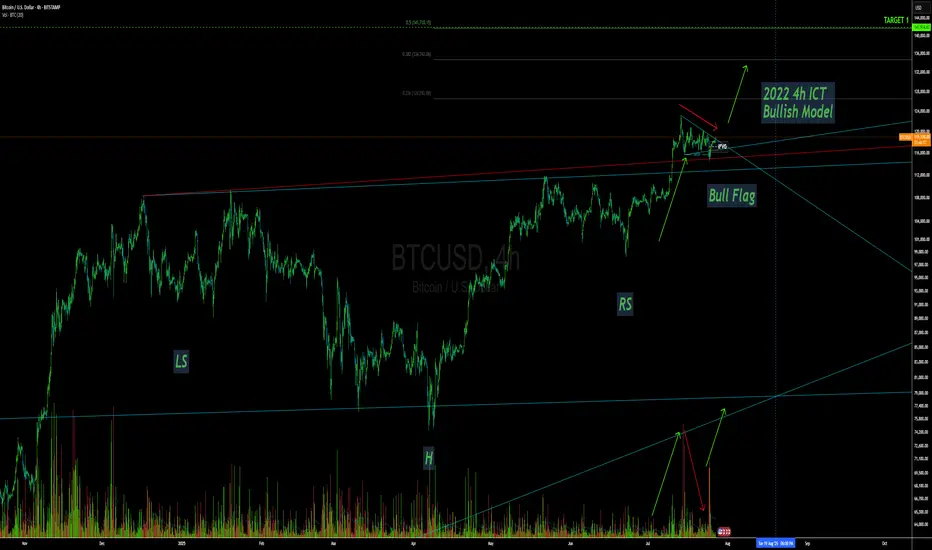
Bullish Breakout Signals Potential for New All-Time HighsBased on the 4-hour chart for BTC/USD, the price action is showing strong bullish signals, suggesting a potential continuation towards new all-time highs. The key target area, following this breakout, is projected to be between $128,000 and $130,000.
Key Observations:
Pattern Breakout: The most significant development on the chart is the decisive breakout from a major descending trendline. This trendline has been acting as resistance for several weeks, forming a large consolidation pattern, likely a falling wedge or a descending triangle. A breakout above this pattern is a classic technical indicator of a potential trend reversal to the upside and a continuation of the larger uptrend.
Bullish Momentum: The price is currently trading above all key moving averages. The shorter-term moving averages are also positioned above the longer-term ones, which confirms the building bullish momentum in the market.
Key Price Levels & Targets:
The first major target is the horizontal resistance level at approximately 123K.
Should the bullish momentum sustain and break through the $123k resistance, the next logical target would be to challenge previous highs and push into price discovery. Based on the strength and structure of this pattern, a move towards the $128,000 - $130,000 range is a strong possibility.
Risk Management:
The illustrated trade setup shows a clear entry point just after the breakout.
A tight stop-loss is placed around 118K, just below the recent price structure.
Conclusion:
The breakout from the multi-week descending pattern is a powerful bullish signal for Bitcoin. With momentum indicators aligned and a clear path to the next major resistance, the outlook is optimistic. If buyers maintain control, a rally to test the 123K level is imminent, with the ultimate potential to forge a new all-time high in the 128K to 130K zone. Traders should watch for sustained volume to confirm the breakout's strength.

Will Bitcoin be the beneficiary of Gold's downside?It looks like bitcoin might be in bullish wedge formation. Will gold be the beneficiary of potential more gold downside?

Bitcoin - Strategic Coil Within the Arcane Band.⊢
⟁ BTC/USD - BINANCE - (CHART: 4H) - (July 27, 2025).
◇ Analysis Price: $118.309,59.
⊣
⨀ I. Temporal Axis - Strategic Interval - (4H):
▦ TEMA9 - ($118.338,48):
∴ Price is currently below TEMA9, indicating near-term resistance;
∴ Curve is upward-sloping but flattening, suggesting fading acceleration;
∴ Acts as reactive signal line; minor rejection occurred on contact.
✴️ Conclusion: Momentum fading as price struggles to hold above dynamic resistance.
⊢
▦ HMA21 - ($118.324,83):
∴ Smooth curvature maintaining upward bias;
∴ Close proximity to TEMA9 shows compressed volatility regime;
∴ Price interacting with HMA without definitive breakout.
✴️ Conclusion: Tactical direction remains constructive, but confirmation is lacking.
⊢
▦ EMA50 - ($117.794,89):
∴ Strong medium-term support; price remains above it with clear respect;
∴ Acts as lower bound of the current compression channel;
∴ No bearish cross detected with TEMA or HMA.
✴️ Conclusion: Mid-term bullish support structure intact.
⊢
▦ EMA200 - ($113.979,81):
∴ Structure well below active price; rising and stable;
∴ Indicates long-term bullish posture is unbroken;
∴ No signs of major breakdown or transition to bear structure.
✴️ Conclusion: Structural uptrend remains unthreatened.
⊢
▦ SuperTrend Arcanvm - (ATR 10, 1.5 - $117.640,25):
∴ Price trades above the SuperTrend line, indicating continuation zone;
∴ Support zone lifted slightly, confirming minor trend maintenance;
∴ No signal reversal or close below since last shift.
✴️ Conclusion: Tactical upward bias protected by volatility-based support.
⊢
⨀ II. Momentum & Pressure Indicators:
▦ Stochastic RSI (3,3,21,9) - (%K: 88.23 / %D: 88.27):
∴ Deep into overbought zone; potential reversal region;
∴ Minor negative crossover forming (%K < %D);
∴ Pattern shows repeated false breaks from high zone.
✴️ Conclusion: Overextended with local fatigue building.
⊢
▦ MACD (9,21,9)- (Line: 164.40 / Signal: 106.94 / Histogram: +57.47):
∴ Bullish crossover confirmed and holding; histogram positive;
∴ Increasing MACD separation suggests underlying momentum;
∴ No divergence yet; consistent short-term upside energy.
✴️ Conclusion: Momentum favors bulls but remains immature.
⊢
▦ MFI (14) - (68.20):
∴ Trending toward overbought zone without breach;
∴ Steady increase reflects sustained volume-backed inflows;
∴ Not yet extreme; still has energy potential to fuel move.
✴️ Conclusion: Volume pressure supports bullish case with room left.
⊢
▦ Accumulation/Distribution + HMA21 - (74.89M):
∴ Line remains stable above short-term base; no outflow signals;
∴ Slight incline observed, confirming ongoing accumulation;
∴ No divergence with price; consistent flow.
✴️ Conclusion: Capital positioning remains supportive of continuation.
⊢
🜎 Strategic Insight - Technical Oracle:
∴ The current 4H structure on BTC/USD exhibits a compressed upward bias where dynamic resistance (TEMA + HMA) is being tested persistently but without explosive breakout;
∴ Momentum indicators (MACD, MFI) confirm early-stage bullish pressure, while structural supports (EMA50, SuperTrend) remain intact and responsive;
∴ However, Stoch RSI is saturated, suggesting that any continuation would likely require a cooling cycle or shallow retracement before sustainable thrust;
∴ This configuration aligns with a “Pre-Break Range Staging” - a technical limbo where buyers are present but cautious, and sellers are absorbed without significant follow-through.
✴️ Strategic Focus: Watch for confirmation above ($118.600) with volume expansion and MACD histogram follow-through, or a soft retest toward ($117.640/117.800) as reloading zone.
∴ Logic sealed. Tactical silence until resolution.
⊢
𓂀 Stoic-Structural Interpretation:
▦ Structurally Bullish - (Tactically Fragile Continuation):
∴ The long-term structure (EMA 200 rising, unbroken) confirms a preserved bullish frame;
∴ Mid-term support (EMA 50 + SuperTrend) is active and functioning as a technical base;
∴ However, price struggles to sustain above dynamic resistance (TEMA/HMA), and Stoch RSI signals short-term exhaustion.
✴️ Conclusion: The structure is upward, but the current tactical zone is sensitive. Any bullish continuation demands confirmation and discipline - no chasing.
⊢
▦ Tactical Range Caution:
∴ Support Zone - (Defensive): $117,640 / $117,800;
∴ Resistance Ceiling - (Breakout Trigger): $118,600;
∴ Tactical Neutral Band: $118,000 / $118,300.
✴️ Conclusion: No trade zone expands if compression persists. Breakout or breakdown must be decisive and accompanied by volume/momentum synchrony.
⊢
◩ Codicillus Silentii - Strategic Note:
∴ In moments of compressed structure near resistance, the market does not reveal itself through price - but through how it refuses to move. Silence becomes signal;
∴ What is observed here is not a lack of momentum - but deliberate withholding of directional intent;
∴ The system is balanced between emergent buy pressure (MACD, MFI, Accum/Dist) and short-term saturation (Stoch RSI), forming a strategic standoff:
No major actors are retreating, but none are charging forward either.
The candle bodies shrink while oscillators extend - a classic sign of non-confirmed bullish bias.
Emotional traders will chase; initiated ones will wait for the candle that breaks the silence, not the one that whispers hope.
✴️ Final Seal: The stoic operator does not react to pressure - he reacts to structure.
Tactical inaction is a move; Watching is positioning; Discipline is participation.
⊢
⧉
· Cryptorvm Dominvs · MAGISTER ARCANVM · Vox Primordialis ·
⚜️ ⌬ - Silence precedes the next force. Structure is sacred - ⌬ ⚜️
⧉
⊢

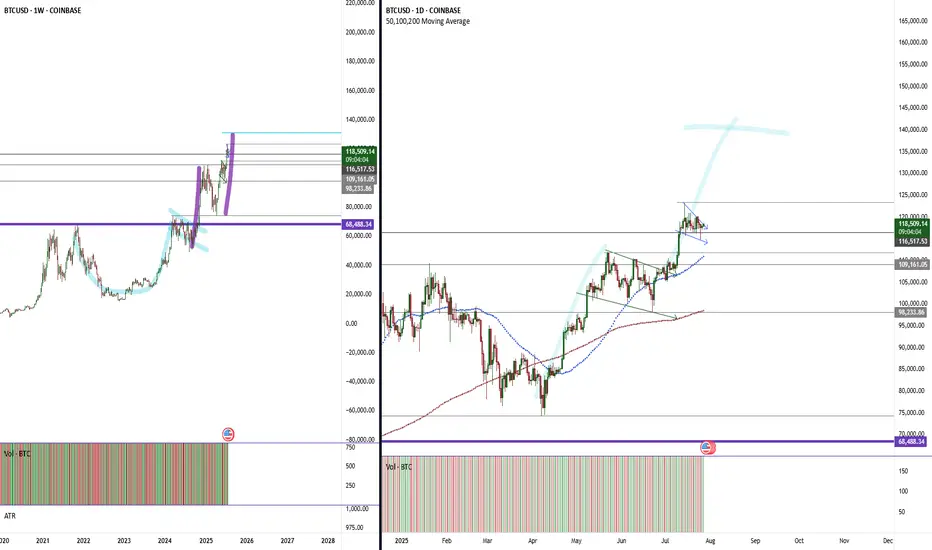
BTC consolidating within the original ideas BTC consolidating within the original ideas formed on weekly cup/handle and daily patterns.
Weekly cup/handle measured move to 130.
Daily consolidation with another flag forming with the target of 140.
BTC #Bitcoin (BTC/USD) 30-minute chart shows a recent breakThis Bitcoin (BTC/USD) 30-minute chart shows a recent breakout above a descending trendline (red) and an ascending wedge pattern. Price has broken out of a rounding structure, indicating a potential bullish reversal. The breakout candle is strong, suggesting bullish momentum. Key resistance lies near 120,000 (blue horizontal line), while support is around 115,600. Watch for confirmation of the breakout with volume or a retest of the breakout level for sustained upward movement.
thanking you

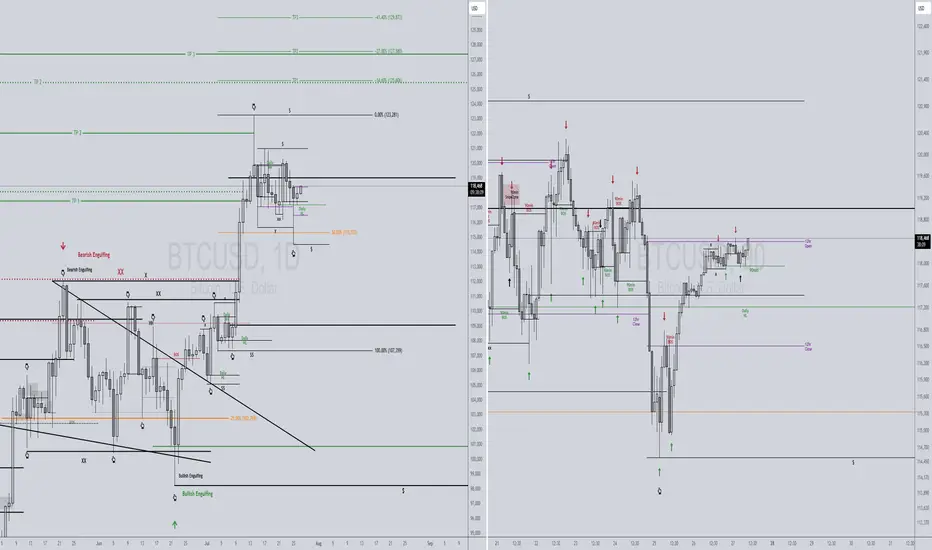
BTCUSD 7/27/2025Just a nice pic update aligning to my last callout in my previous video.
New Video dropping later today...
_SnipeGoat_
_TheeCandleReadingGURU_
#PriceAction #MarketStructure #TechnicalAnalysis #Bearish #Bullish #Bitcoin #Crypto #BTCUSD #Forex #NakedChartReader #ZEROindicators #PreciseLevels #ProperTiming #PerfectDirection #ScalpingTrader #IntradayTrader #DayTrader #SwingTrader #PositionalTrader #HighLevelTrader #MambaMentality #GodMode #UltraInstinct #TheeBibleStrategy
1H & 4H RSI1H & 4H RSI showing possible Bull Div waiting for price to catch up to activate inverse head & Shoulders just my own thoughts .

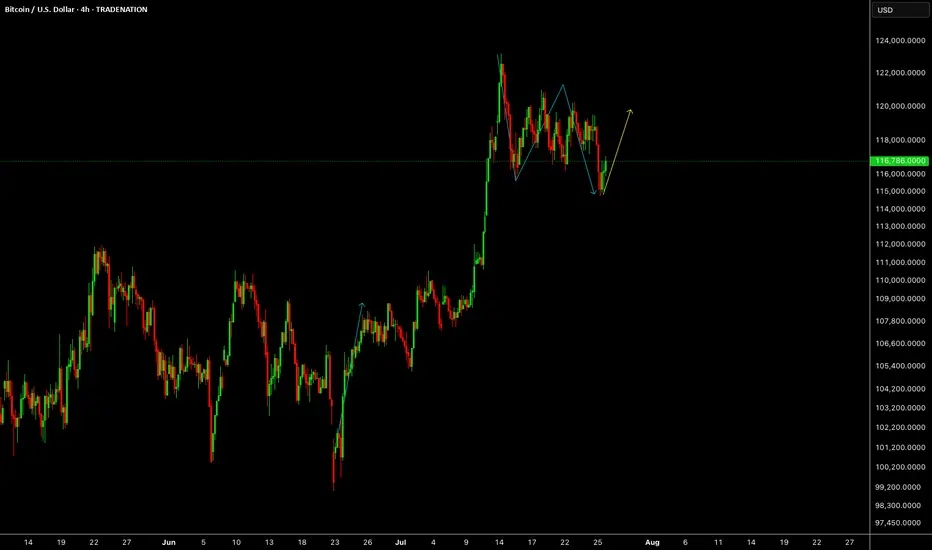
BTCUSDBTCUSD is correcting for more upside, last drop can happen just to complete the structure before upside starts again.
Disclosure: We are part of Trade Nation's Influencer program and receive a monthly fee for using their TradingView charts in our analysis.
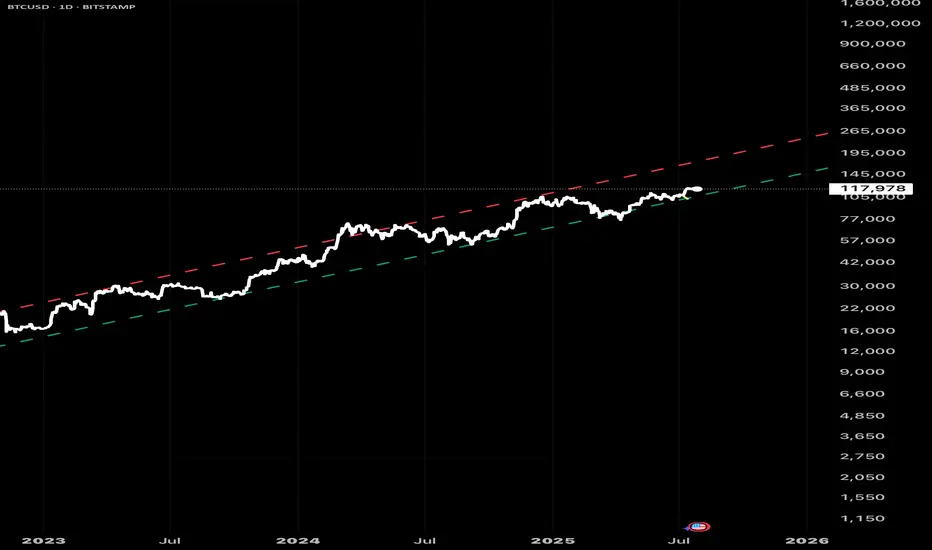
Bitcoin prediction (no fluff)I made this trend many months ago.
Thought I would share it with anyone considering BTC as a hedge against fiat inflation.
No candle sticks movement predictions.
No wedges.
No Fibonacci sequence.
The real mover of BTC is basically Stock-to-Flow corrected (downward) by BTC movement which doesn’t occur on exchanges (which is challenging to quantify).
But vague data suggests that OTC inventory is dwindling by the week.
Therefore, once OTC transactions go to zero, BTC will break upward through the top of this channel and approach the S2F.
BTC SELL?A nice short opportunity for sell on Btc/Usd.
Intraday trade.
If it get continuation BTC could drop to lower levels.
Aiming for at least 3R
Let’s see how it plays out.