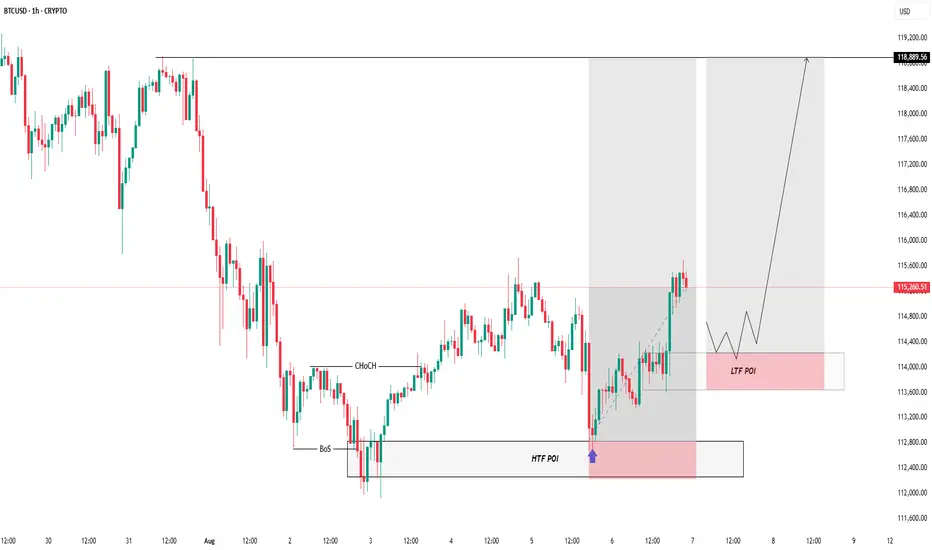
BUY CONTINUATION ROAN MAPO FOR BTCUSDexpect price to retest towards a lower time frame Point of interest , for the re entry of the second entry , with repect to this adhere to proper risk management including use of proper volumes and no of position ,,,,
#manage ur trades well
#risk what u can afford to lose
BTCETH.P trade ideas
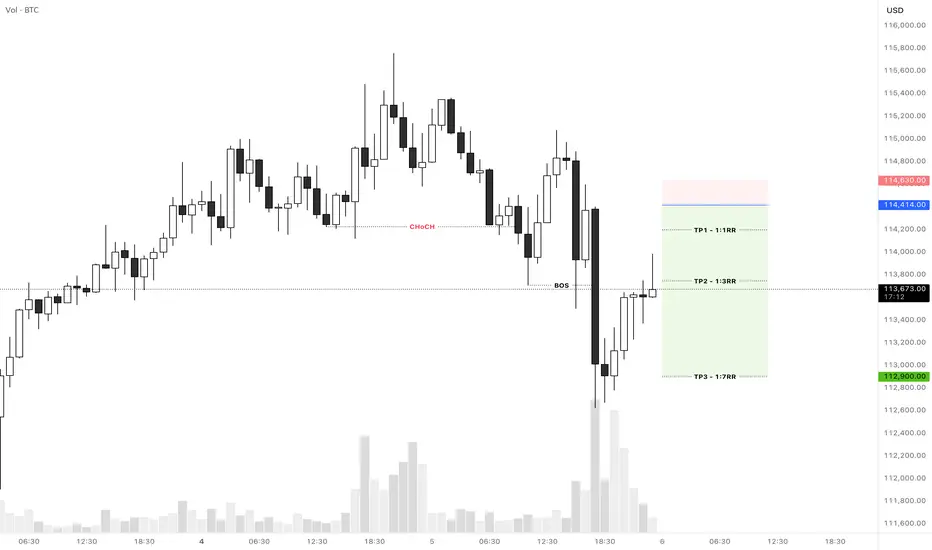
Bitcoin Short SetupHi everyone.
In Bitcoin 1H TF we have a CHoCH followed by a BOS and a pullback, I think it is possible the price meet this area and then continue to go down...
Let's see what happens...
Good luck
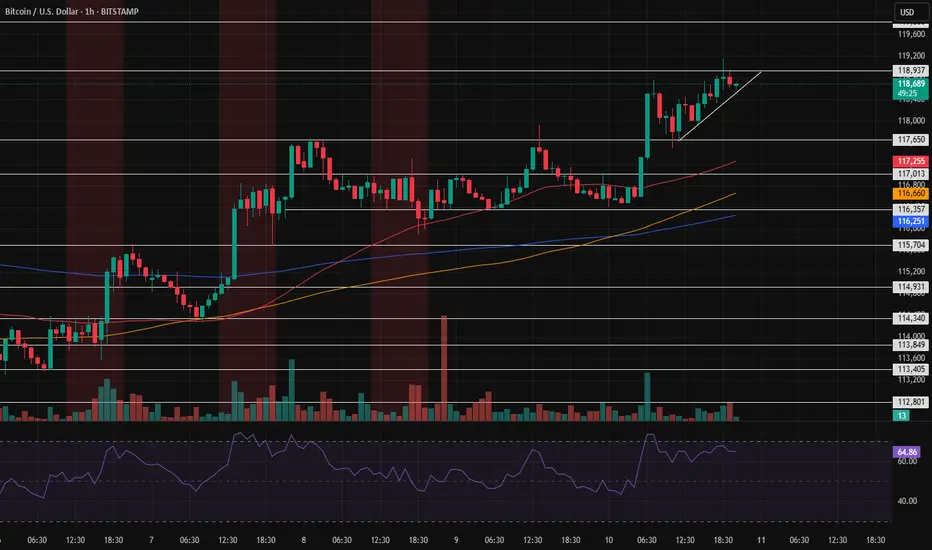
Price correction to 117.650.The price in this area needs a short and temporary rest/correction before moving higher. It is expected to correct to the mentioned price level, at which point we can decide whether the price intends to make a deeper correction or rebound from that area.
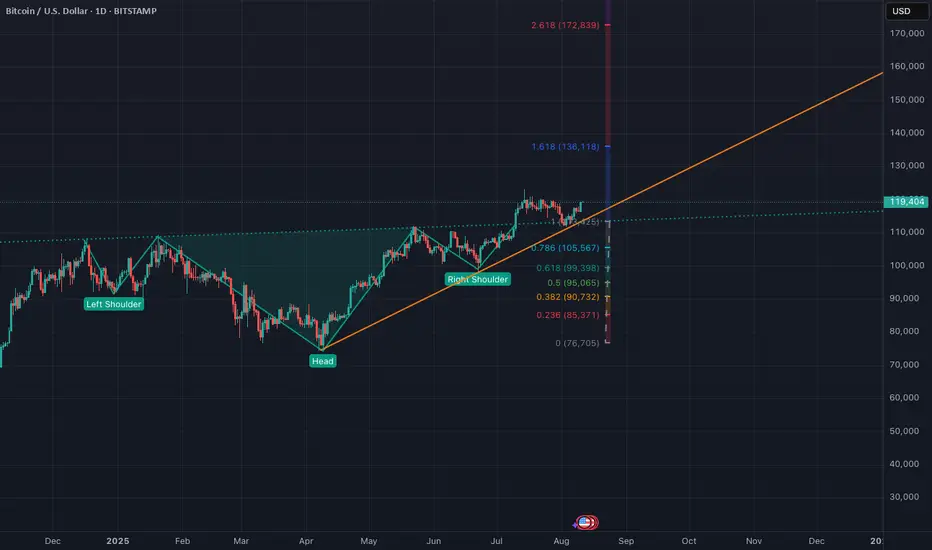
BTC Inverse H&S w/ retest + Fib extensionsBTC playing out an inverse head and shoulders pattern with a retest at the neckline, possible rally extensions coming out of the breakout determined by fibonacci levels
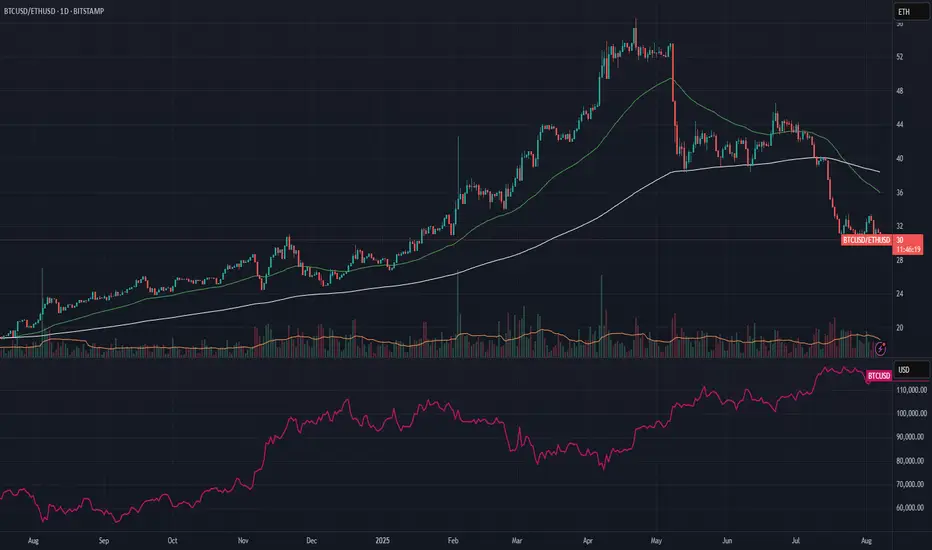
btc/ethThe BTC/ETH ratio, or Bitcoin/Ethereum exchange rate, represents the amount of Ethereum (ETH) that can be purchased with one Bitcoin (BTC). It's like an exchange rate between two cryptocurrencies, where BTC is the base currency and ETH is the quoted currency. For example, if the BTC/ETH ratio is 0.05, it means that 1 Bitcoin can buy 0.05 Ethereum.
In simpler terms:
The BTC/ETH ratio shows how many units of Ethereum are worth one Bitcoin.
This ratio is dynamic and constantly changes based on the supply and demand of each cryptocurrency.
If the ratio rises, it means that Ethereum is appreciating in value relative to Bitcoin, and vice versa.
Importance:
This ratio is important for traders and investors who want to understand the value relationship between the two most popular cryptocurrencies on the market.
Tracking the BTC/ETH ratio helps identify trading opportunities and understand market trends.
It is a useful tool for evaluating the relative performance of each cryptocurrency and making more informed investment decisions.
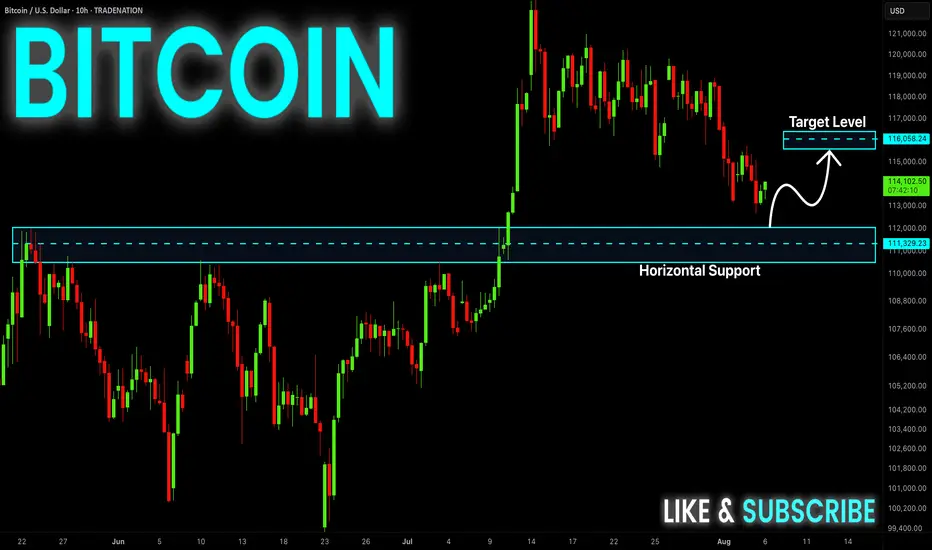
BITCOIN Swing Long! Buy!
Hello,Traders!
BITCOIN went down from
The highs but a strong support
Level is below around 112k$
So after the retest we will be
Expecting a local bullish rebound
Buy!
Comment and subscribe to help us grow!
Check out other forecasts below too!
Disclosure: I am part of Trade Nation's Influencer program and receive a monthly fee for using their TradingView charts in my analysis.
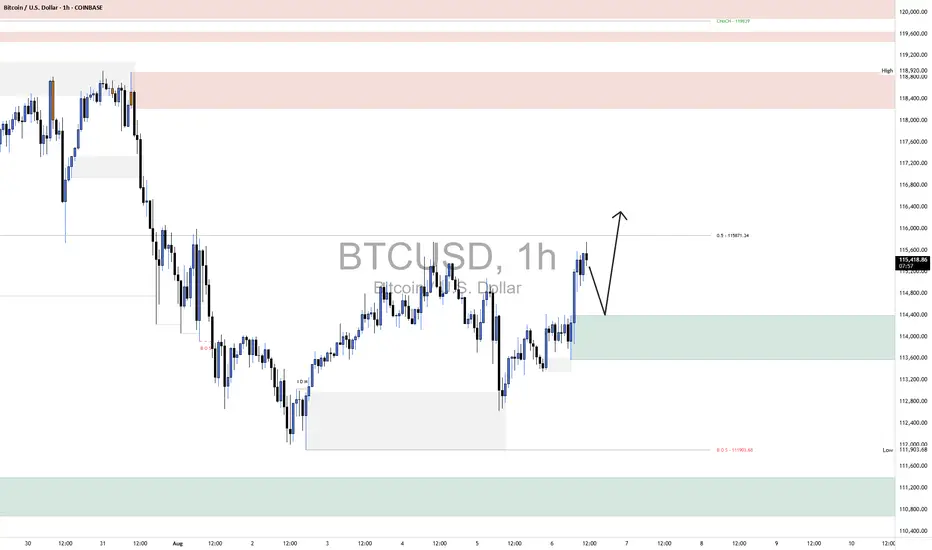
BTCUSD LongThe broader market structure on BTCUSD remains bullish following a clean Change of Character (CHoCH) at 119,839, which signaled the end of the previous downtrend. This was later confirmed by a Break of Structure (BOS) to the upside. After forming a higher low near $111,903.68, price has steadily climbed, creating a sequence of higher highs and higher lows. This structure suggests the market is in a bullish continuation phase.
A strong demand zone is evident between $113,800 and $114,400, where buyers previously stepped in aggressively, leading to a sharp rally. The price barely consolidated in this area before moving upward, confirming it as a solid zone of interest. Above current price, there's a large supply zone between $118,400 and $119,600, where price last dropped sharply—indicating strong selling pressure.
Currently, price is trading around $115,300, just below the 0.5 retracement level at $115,871, and has printed bullish momentum candles into this resistance area. The most likely price action is a pullback into the green demand zone ($114,400–$114,000) before resuming upward toward the supply zone around $118,400–$119,600.
Trade bias: Bullish
Expected direction: Upward after a possible pullback
Invalidation level: Break below $113,800 would invalidate short-term bullish bias
Momentum condition: Momentum currently favors buyers, with strong bullish candles and higher lows
Candle behavior: No signs of exhaustion yet, indicating strength in the move
Bitcoin Long August TradePretty simple setup.
17% stop loss and target Long Trade.
Re-evaluate in September.

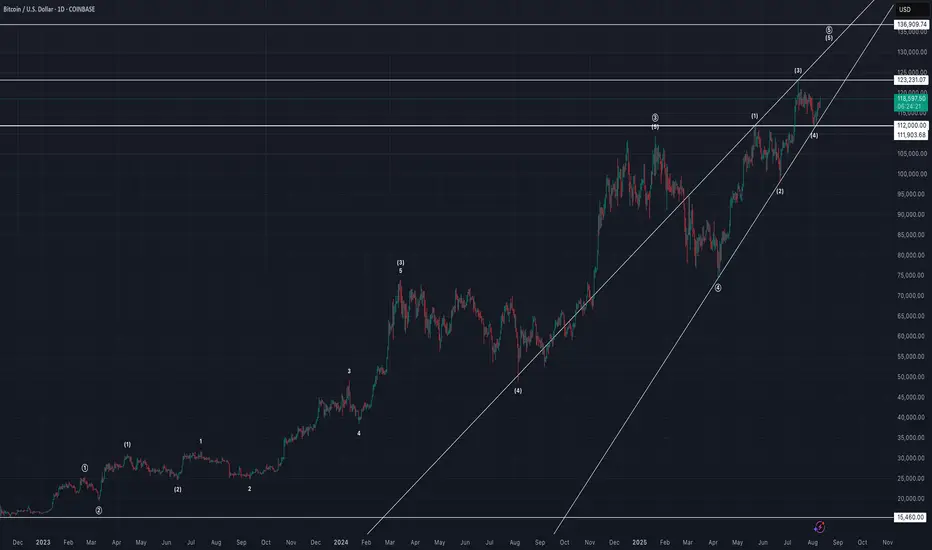
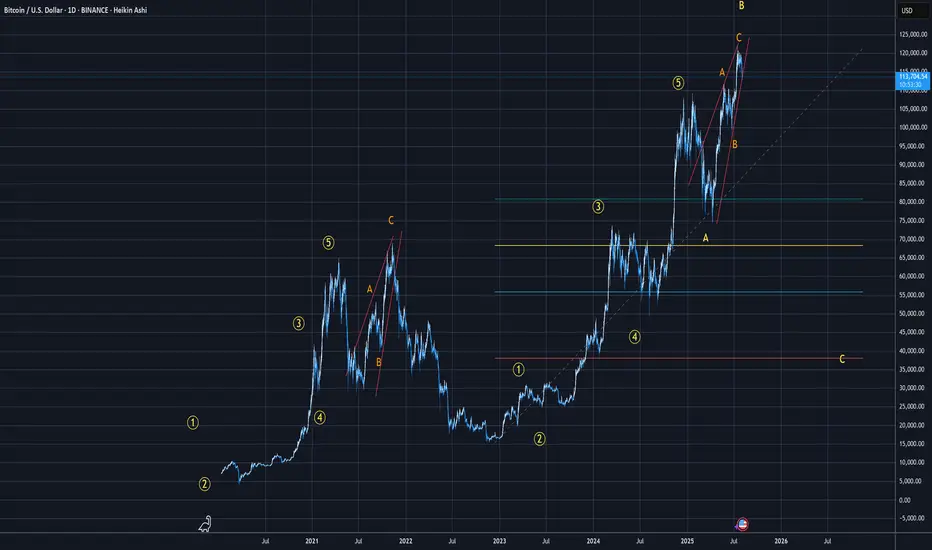
BTCUSD weekend analysisTechnical analysis of BTCUSD from November 2022 low, Coinbase exchange.
This Elliott Wave count has BTCUSD in ending diagonal wave (5) of ((5)) with wedge formation, (4) of ((5)) overlapping (1) of ((5)), and (5) of ((5)) ending above 123231.07 but below 136909.74. Risk/reward favors bears as price gets closer to 136909.74. Count invalid above 136909.74.
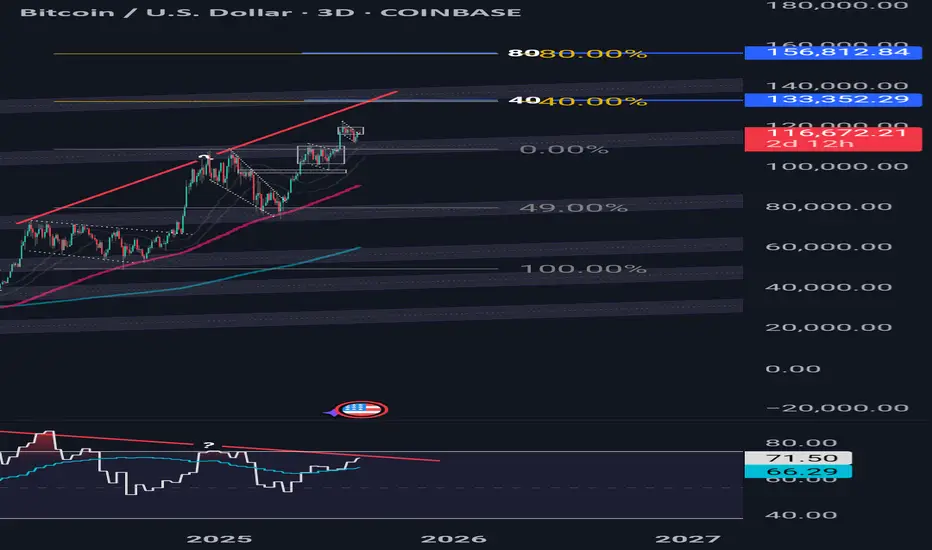
Bitcoin Still Going Strong...For nowBitcoin has been pushing up strongly since the start of the cup & handle in Oct-Nov of 2024.
But Bitcoin is showing weakness, where the bull flags you see on my chart are getting smaller the higher btc goes.
There is also negative divergence showing on my rsi, also signaling signs of weakness.
I do believe we are still bullish for now. But the first area to keep an eye on is between 133k-140k. If Bitcoin gets their I'll start to look for any shorting opportunities.
“Disclaimer: The information provided is NOT financial advice. I am not a financial adviser, accountant or the like. This information is purely from my own due diligence and an expression of my thoughts, my opinions based on my personal experiences, and the way I transact.
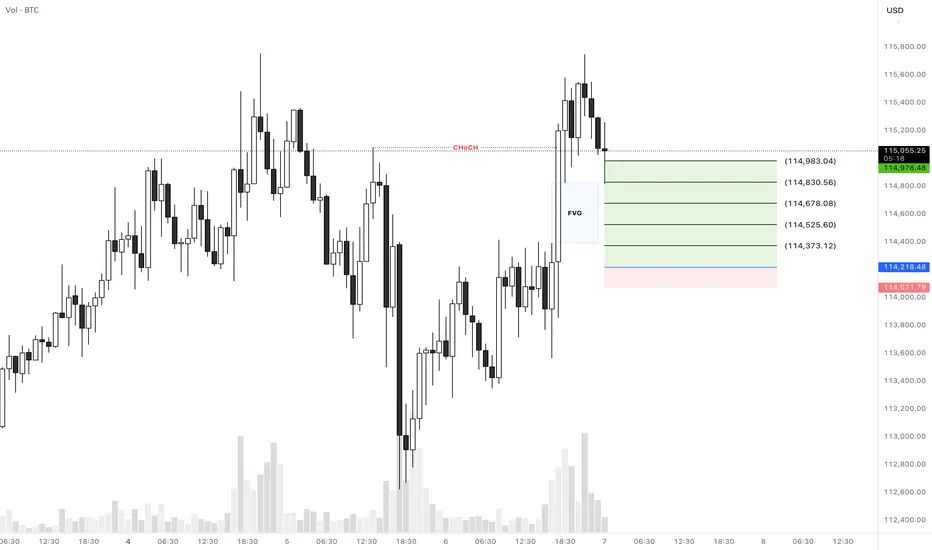
BTCUSD Long SetupHello everyone.
We have a CHoCH in 1H TF that it left a FVG area and it was touched a minute ago...
Let's see how does it reacts to this FVG area and if it didn't push the price up then we can expect our entry is valid...
Another thing that we should consider is that we're in down trend in 4H TF and the price didn't break the previous high for a CHoCH, so this trade would be a little risky so please consider the risk management...
Let's see what happens...
Good luck
BTCUSD 8/6/2025Come Tap into the mind of SnipeGoat, as he gives you a quick Market Breakdown of Bitcoins current Price Action. What is Price doing? Where is Price going? Come find out....
_SnipeGoat_
_TheeCandleReadingGURU_
#PriceAction #MarketStructure #TechnicalAnalysis #Bearish #Bullish #Bitcoin #Crypto #BTCUSD #Forex #NakedChartReader #ZEROindicators #PreciseLevels #ProperTiming #PerfectDirection #ScalpingTrader #IntradayTrader #DayTrader #SwingTrader #PositionalTrader #HighLevelTrader #MambaMentality #GodMode #UltraInstinct #TheeBibleStrategy

BTCUSD Technical Analysis – Supply Zone RejectionBTC/USD is currently reacting strongly to a visible supply zone around the $115,000 – $115,648 area, showing clear signs of rejection after testing that zone multiple times. This rejection aligns with the high-volume area on the visible range.
🔹 Key Levels:
🔵 Resistance Zone (Supply): $115,000 – $115,648
🔵 Mid Support: $113,975 (Previous structure zone)
🟠 Demand Zone: $112,391 – $112,700 (High interest buy zone with visible order blocks)
🔻 Bearish Expectation:
If price continues to respect the supply zone:
First Target: $113,975 – Minor support, may cause temporary bounce.
Second Target: $112,391 – Stronger demand area, possible bullish reaction expected here.
Red arrows mark the potential path BTC may take if bearish pressure holds.
⚠️ Note:
A break above $115,648 invalidates the bearish setup.
Wait for confirmation (e.g., bearish engulfing or break of structure) before entry.
📌 Trade Idea:
Sell Setup:
Entry: Near $115,000–$115,600
SL: Above $115,700
TP1: $113,975
TP2: $112,391
🔁 Follow for more BTCUSD supply/demand-based updates.
📊 #Bitcoin #BTCUSD #CryptoAnalysis #PriceAction #SupplyAndDemand #SmartMoney #TradingView

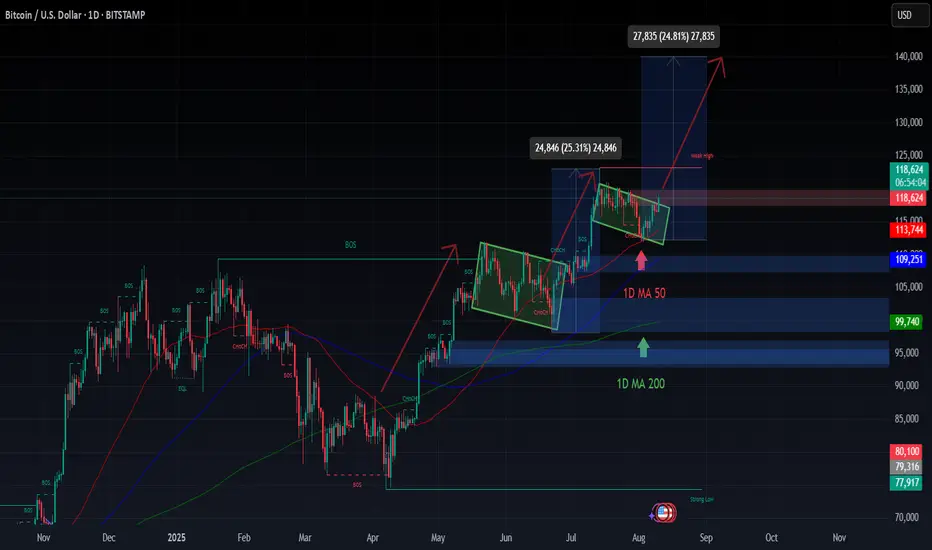
BTCUSD-BOUNCED 1D MA503 candles 🔒 holding tight, price ready to explode from top of Channel Down! Break this channel = Bull Flag confirmed, just like May-June!
MACD bullish cross loading… but 1/3 can be traps — stay sharp! ⚠️
🎯 Targets:
• $140K short-term 🚀
• $148K medium-term 🚀🚀
This move is LOADED — don’t blink!
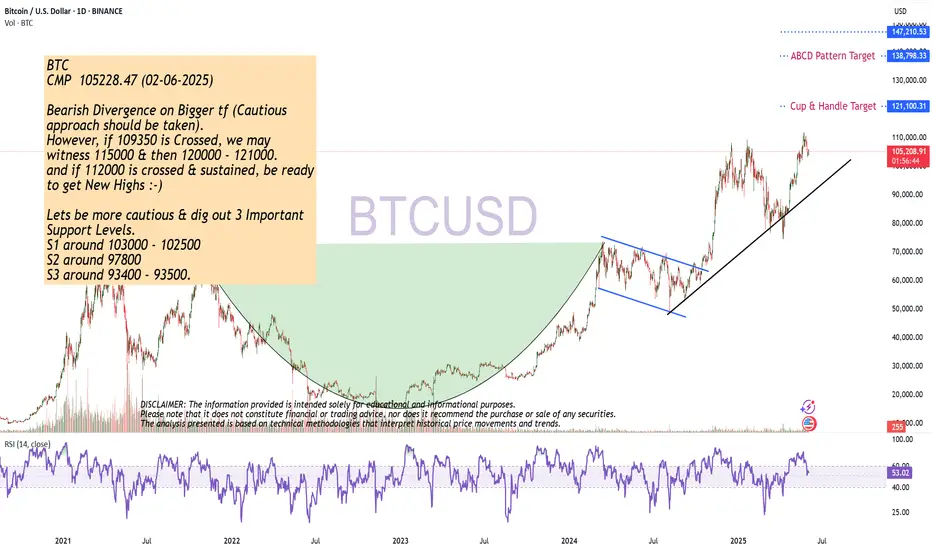
Bearish Divergence on Bigger tf
CMP 105228.47 (02-06-2025)
Bearish Divergence on Bigger tf (Cautious
approach should be taken).
However, if 109350 is Crossed, we may
witness 115000 & then 120000 - 121000.
and if 112000 is crossed & sustained, be ready
to get New Highs :-)
Lets be more cautious & dig out 3 Important
Support Levels.
S1 around 103000 - 102500
S2 around 97800
S3 around 93400 - 93500.
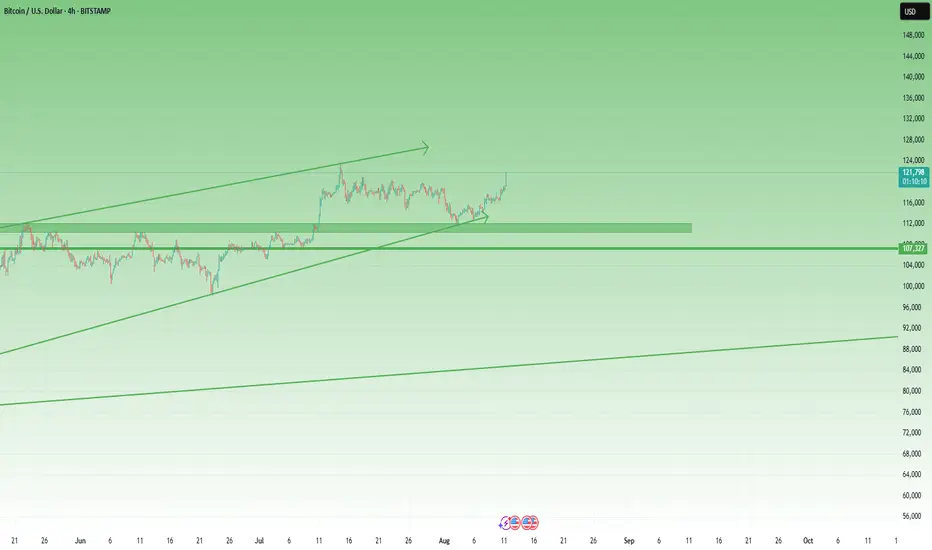
Bitcoin’s Game Has Changed: Fresh Support Zone, Targets Sky-HighHey Dear Friends,
Until recently, Bitcoin had been stuck in a range between 112,331 and 105,344 for quite some time. But that range has now been clearly broken. So, what does this mean? This zone, which used to act as resistance, is now expected to flip and act as support.
According to my weekly trading model, the long-term target levels I’m tracking for Bitcoin are: 127,818 – 137,000 – 146,000.
Since this is a weekly setup, it might take a while for these targets to play out. Even if we see pullbacks to the 112K, 105K, or even 100K levels, I expect to see strong buying pressure from that zone.
I’ll keep sharing regular updates as this setup develops.
To everyone who’s been supporting and appreciating my work—thank you, truly. Your encouragement means the world to me and keeps me motivated to keep showing up. Much love to all of you—I’m grateful we’re in this journey together.

BTC Bulls Back in Control – 130K in SightIn my previous BTC analysis, I highlighted that the price was sitting right in a confluence support zone, with strong odds for a bullish reversal.
That scenario played out well — bulls regained control. After a retest of the low pruces in the middle of last week and a modest initial bounce, momentum accelerated today, pushing BTC close to its previous all-time high at the time of writing.
Looking ahead, I don’t expect the old ATH to be a major obstacle for buyers. A clean break above should open the path toward 130K+ as the next logical upside target.
For now, as long as BTC trades above 114K, bulls have no reason for concern.
#BITCOIN - Short-Term Options [EXPLAINED]As expected, the price dumped below the descending channel , currently consolidating right below one's support level.
As expected, the price dumped below the descending channel , currently consolidating right below one's support level. On the chart I've described two possible options for the price movement: strictly positive and hmm.. okey.
Strictly positive: some consolidation below the support with, then quick retrace back inside the channel and new upward rally on the next working week. Entering LONG position will make sense after the breakout of the $116,500 resistance, not earlier.
Hmm.. okey: Bitcoin is not strong enough to come back inside the channel and dumps to $111,000 support level. Near this level we must see some consolidation to gather more power. Possible fakes down to $108,000. In some time (1 week+) we will have chances of going back up.
👉 Overall, the support of $111,000 is crucial right now. If we lose it, Bitcoin goes towards $100,000 and the current bullish phase might be considered as finished. For now we still have chances.

BTC PERPETUAL TRADE ,Short from $113,700
BTC PERPETUAL TRADE
SELL SETUP
Short from $113,700
Currently $113,700
Stoploss $116,800
Targeting $111,600 or Down
(Trading plan BTC go up to $115K
will add more shorts)
Follow the notes for updates
In the event of an early exit,
this analysis will be updated.
Its not a Financial advice

BTC about to dump, 88k must hold or else...BTC is testing support in the 116k area RN, it wont hold, so next support 97-98k. iI have the feeling this will not hold and a set up for an 88k cliffhanger is incoming.
is BTC dead again ?I was really bullish until wave 4 didnt really bounce between the 38 and 50
suddenly very bearish
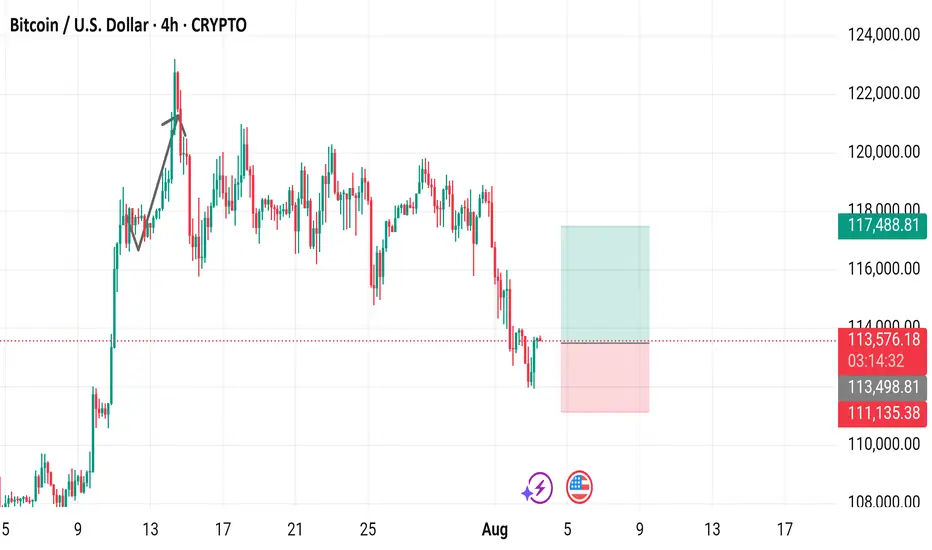
Bitcoin / U.S. Dollar 4-Hour Chart (BTCUSD)4-hour chart displays the price movement of Bitcoin (BTC) against the U.S. Dollar (USD) from late July to August 3, 2025. The current price is $113,570.31, with a 24-hour change of +$1,064.77 (+0.95%). The chart shows a recent upward trend followed by a sharp decline, with key levels marked at $113,570.31 (buy/sell price) and $111,135.38 (support level). The trading volume and price range are highlighted, with a notable drop below the $113,570.31 level as of 03:16:00 on the chart.
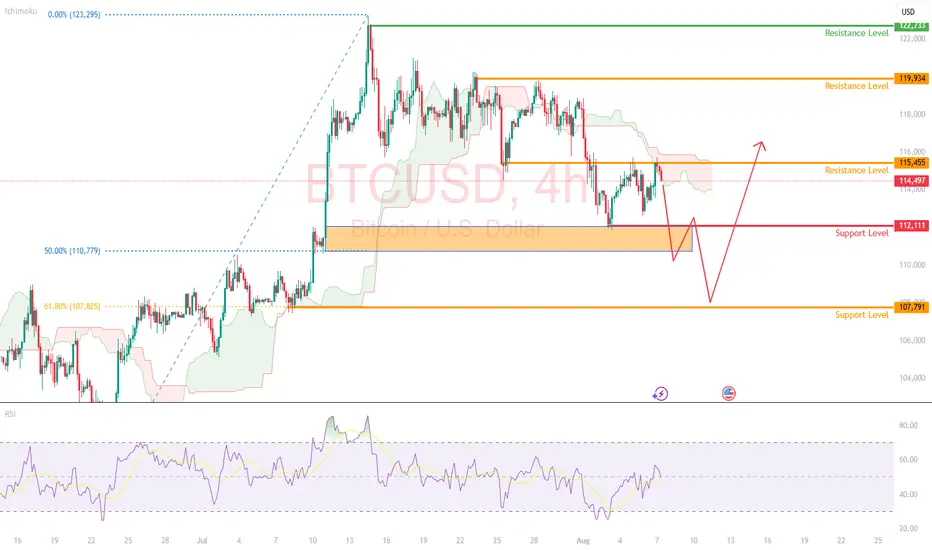
BTCUSD Retrace to ReboundBitcoin is currently trading around $114,500 price level and continues to be held below the $116,000 level.
Price remains in a short-term range between $112,000 and $116,000. But signs are emerging that a breakout may be brewing.
Ichimoku Cloud
BTC is trading into a bearish cloud, which further highlights the possibility of continuation within the range.
RSI
RSI is turning lower from the 60 level, away from the overbought region. This could indicate some downside to come (back into the range).
The Anticipation
Look for a possible break to the downside (below the support level of $112,000 and the 50% retracement level).
Eventually, we could see BTC retest the 108,000 support level before a strong rebound, with possibly a new ATH created.