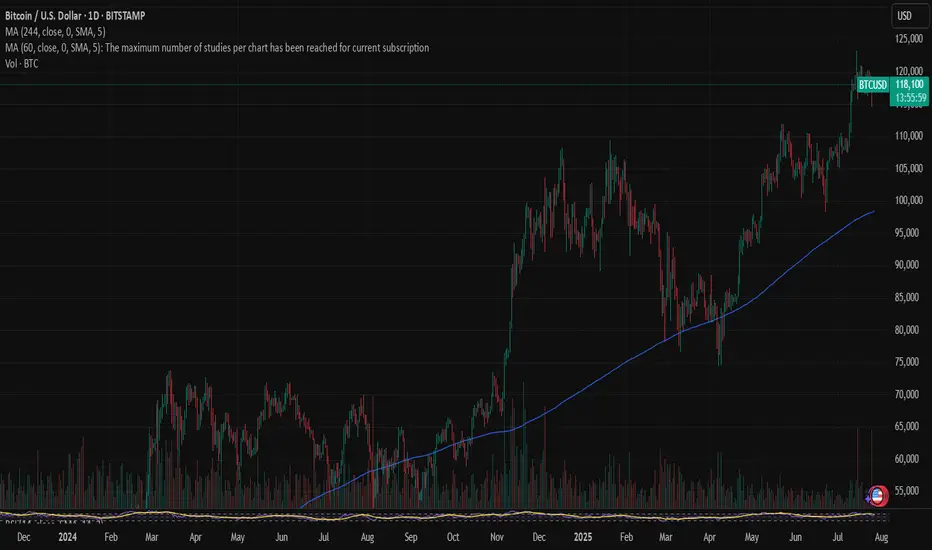
Bitcoin Daily shows us that a HUGE Hurdle has been crossed
The question I will answer in this post is "What is the significance of that Blue line that BTC PA is now sitting on"
On the Daily chart, we can see it has been tested as support and Held.
Previously, it was resistance..
So what ? This has happened many times before.
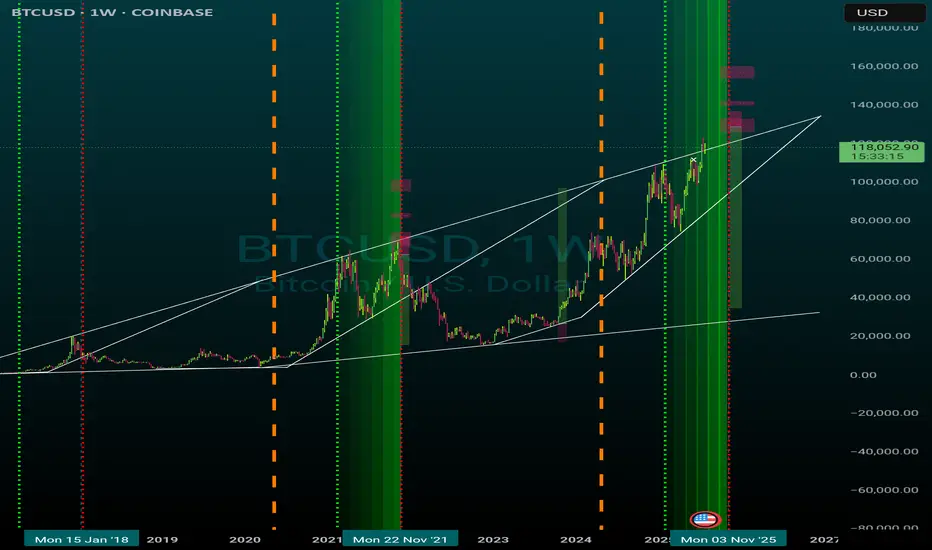
Lets zoom out and look at the weekly.
So, we see that the Blue line was also the rejection zone in 2021.
Infact, if you look, it has rejected BTC PA 5 times since March 2021 and we have finaly managed to get over it and seem to be comfortable using ot as support now.
This leaves the door open to move higher once PA is ready
But there is WAY MORE to this
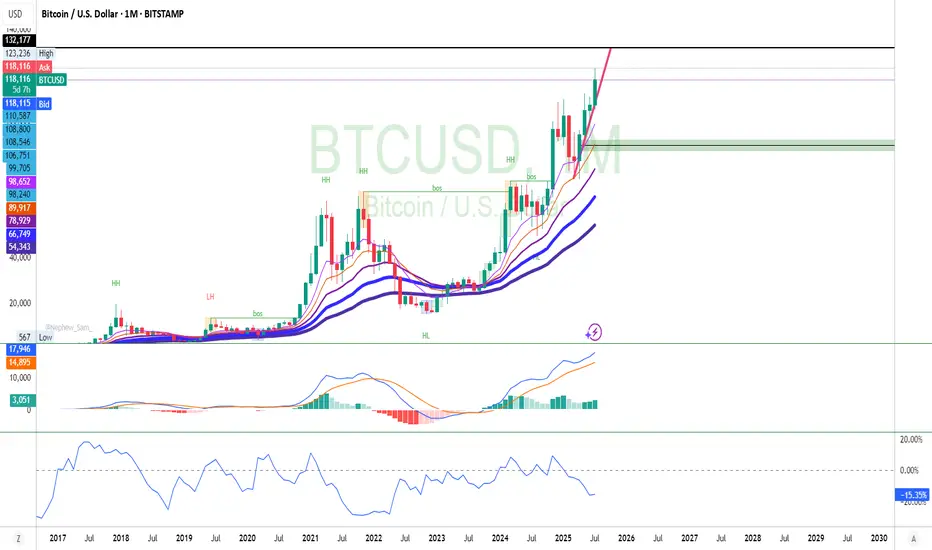
Lets look at the monthly chart
So now we see that that same Blue Arc has also been rejecting BTC PA since 2011.
That is nearly the entire life span of Bitcoin and it is certainly the entire life span of its current Bullish momentum since we entered the current channel we are in..
So, in many way, this could be seen as a new beginning, a New cycle.
We do need to remain cautious for now though. As we can see, we did get over this line in 2013 but fell back below......and of course, the possibility for this to happen again exists BUT we now have massive Corporate investment. This could stop that fall.
PA needed to get over this line or fall.
Should this fail to hold for now, we will return to lower lines of support, around 70K- 80K but I would anticipate a massive buying spree should that happen.
The next few months in Bitcoin are absolutely CRUCIAL.
We need to remain above this Arc.
And as I have shown months ago, this Arc is not just a line drawn freehand.
It is actually calculated and is part of a Fibonacci Arc.
The Monthly chart also shows us we are near the ATH Zone on a time span shown under PA on this chart.
We may not see the steep rise we have previously...but the Major Victory is remaining ABOVE this Blue Arc
Fingers Crossed
BTCETH.P trade ideas

Bitcoin: Spiked liquidations The optimism that held the market sentiment after the adoption of the Genius Act on July 17th, slowly faded during the previous week. As it was expected, traders were closing their positions in order to book profits, spiking the liquidations of positions. The price of BTC reached the lowest weekly level at $114,8K at Friday's trading session, however, it was only during the short period of time. The BTC swiftly recovered, turning back toward levels above the $118K. The highest weekly level reached was $120K.
The RSI is still holding high, around the level of 60, but went out from the overbought market side. This increases potential for a further move toward the oversold market side, however, it might take more than a week in order for the market to actually turn their course toward the downside. The MA50 is still diverging from MA200, indicating that the potential cross is still not in the store.
BTC continues to hold higher grounds, which indicates that investors are still eager to hold and buy this coin, especially on a dip, like it happened at Friday's trading session. Indications over potential short reversal of BTC are emerging on charts, however, the timing of it is unclear at this moment. In the week ahead there are several quite important US macro data scheduled for a release (NFP, PCE, Unemployment, JOLTs) as well as the FOMC meeting, which all might bring some higher volatility back on markets. BTC might also react, as a part of mainstream markets. At this moment on charts, there is indication that BTC might shortly test lower grounds, probably around the $116K level. If this level sustains the selling pressure, then BTC will revert back, most probably toward the $120K for one more time. Still, there are small odds that the $116K might be breached toward the lower grounds, in which sense, $112K will be level to watch. However, odds for this level are quite low at this moment.
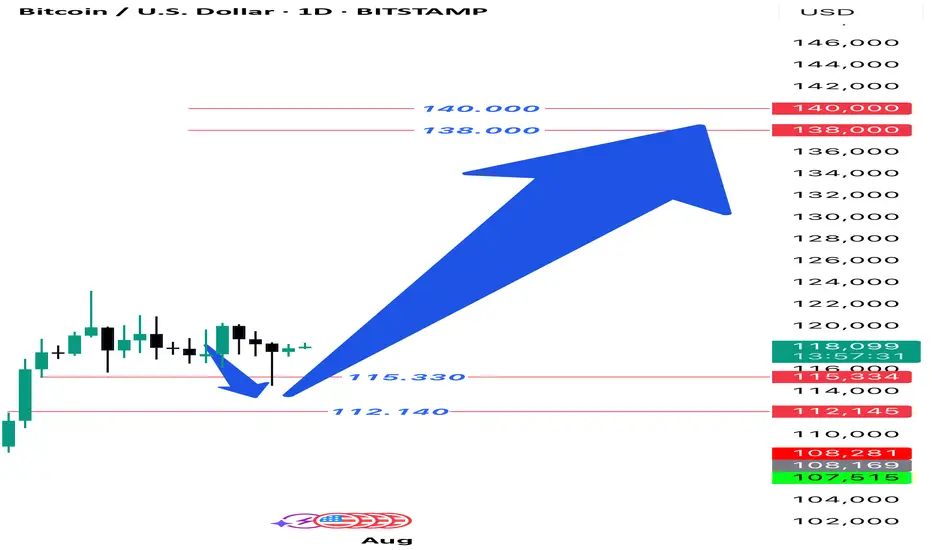
BTCUSD Daily Setup If you look back at my previous analysis of Bitcoin, you will notice that on the daily time frame, the price entered the specified range and then continued its upward trend, and we expect this upward trend to continue to the range of 138,000 to 140,000.
#XAUUSD #BTCUSD #ICT #OrderBlock #FundedTrader #TradingStrategy
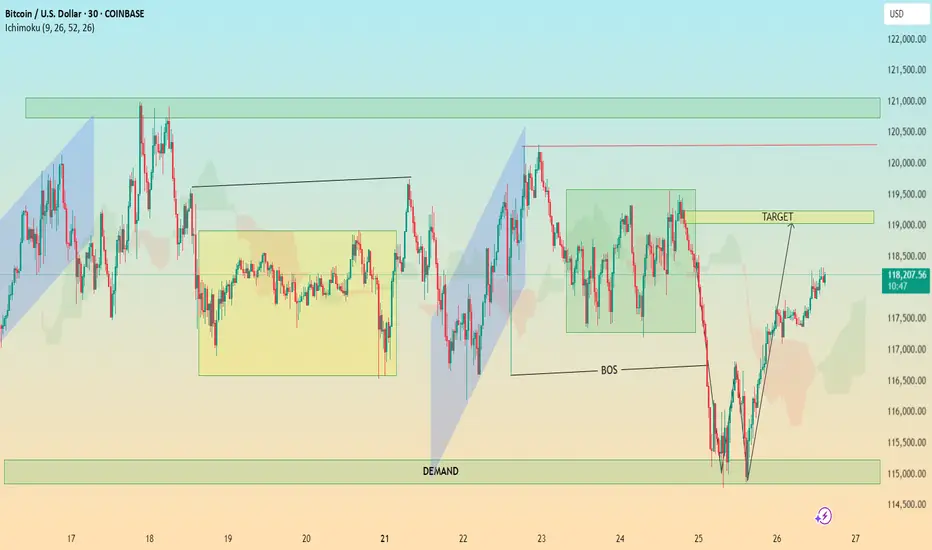
BTC In-Depth Technical Analysis: BTC/USD (30-Min Chart)🔍 In-Depth Technical Analysis: BTC/USD (30-Min Chart)
🟩 1. Demand Zone Reaction
Location: ~$114,500 – $115,500
Significance:
Price sharply reversed after a strong move into this demand zone.
This zone coincides with a liquidity grab below previous lows — textbook Smart Money trap.
Volume (if checked) would likely spike here, indicating institutional interest.
✅ Interpretation: Institutional demand stepped in, absorbing sell orders and triggering a reversal.
📉 2. Break of Structure (BOS)
Zone: Around July 24–25
Price broke below a key higher low, signaling temporary bearish structure.
However, this was quickly reclaimed after demand zone reaction — suggesting a fakeout BOS or a liquidity sweep.
✅ Interpretation: BOS caused shorts to enter, but reversal suggests a bear trap and continuation higher. The BOS served to fuel a more aggressive bullish rally.
🎯 3. Target Zone
Marked Target: ~$118,900–$119,200
Why This Area?
It aligns with a previous consolidation zone / supply before the sharp drop.
Also overlaps with Ichimoku cloud resistance and previous highs — strong confluence.
✅ Interpretation: Price is likely to face resistance here. If broken with strong momentum, bullish continuation to the next supply zone (~$121K) is possible.
⛓️ 4. Market Structure Analysis
Higher Lows Forming after demand reaction.
Price is forming a bullish market structure with an ascending wave pattern.
A break and retest of the $119K zone could lead to a mid-term rally.
Failure to break could result in:
A pullback to the $117,000 area
Or a deeper retest of the demand zone
✅ Trading Plan Options:
Bullish Bias: Buy pullbacks above $117,000 with $119,000 as target
Bearish Bias: Wait for strong rejection at $119,000 to short back to $115K
☁️ 5. Ichimoku Cloud Insight
Price has moved above the cloud, suggesting momentum shift to the upside.
The cloud is twisting bullish, supporting short-term bullish trend.
However, flat Kumo tops around $119K = likely rejection zone.
✅ Interpretation: Ichimoku confirms bullish potential, but price must close above the cloud + $119K zone to sustain trend.
📌 Key Takeaways for Publishing
Chart Idea Title:
“BTC/USD Demand Zone Reversal | Break of Structure & $119K Target in Sight”
Summary Description:
Bitcoin has reclaimed bullish momentum after a sweep into the $115K demand zone. A break of structure triggered shorts, but demand absorption led to a sharp reversal. Now, price is approaching the key $119K supply zone — a critical level that could determine if this is a short-term rally or the beginning of a new trend. Watch for either a clean breakout or a rejection for a possible retest of $117K or lower. Confluence from Ichimoku, BOS, and market structure support the analysis.
Why Your Chart Might Be Lying to You And (How to Fix It) !Hello Traders 🐺
Ever clicked the “Log” button on your chart and suddenly everything looked different?
Yeah, you’re not alone...
Most traders ignore it.
But understanding the difference between a Linear and Logarithmic chart can literally change how you see price action — especially if you’re into long-term moves or trading volatile markets like crypto.
Let’s break it down real simple 👇
🔹 Linear Chart (a.k.a. the default)
This is what most charts use by default.
It measures price change in absolute terms.
Meaning: the distance from $10 to $20 is exactly the same as from $20 to $30 — because in both cases, price moved $10.
🧠 Sounds fair, right?
Not always. Here's why...
Let’s say a stock goes from $1 to $2 — that’s a 100% gain.
But if it goes from $100 to $101 — that’s just 1%.
✅ Linear Chart – Pros
Simple and easy to read
Good for short-term price action
Better for assets with small price ranges
Familiar to most beginners
❌ Linear Chart – Cons
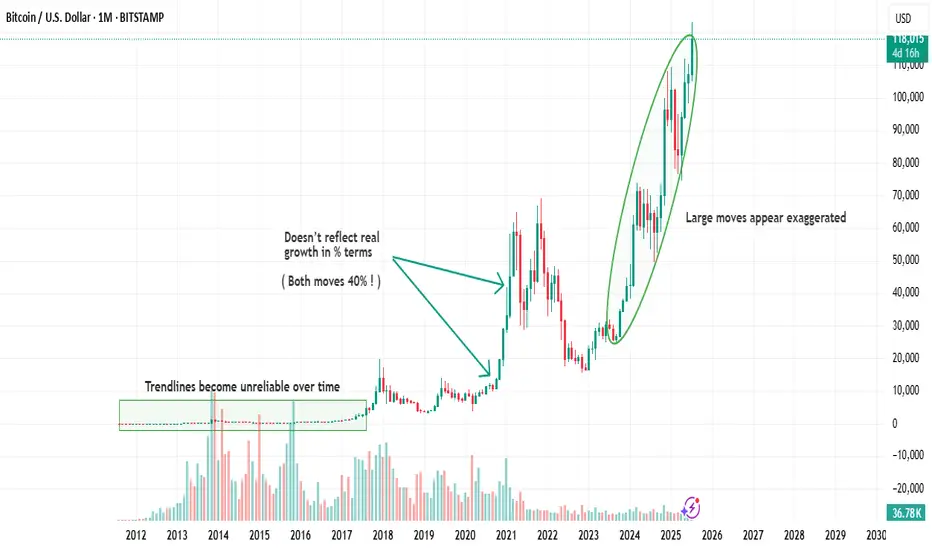
Misleading in long-term charts
Distorts large percentage moves
Trendlines become unreliable over time
Doesn’t reflect real growth in % terms
🔹 Logarithmic Chart (Log Scale)
This one shows percentage-based price movement.
Now, going from $10 to $20 (100% gain)
and going from $100 to $200 (also 100% gain)
look exactly the same on the chart — which actually makes more sense when analyzing growth.
It’s super useful when:
✅ You’re analyzing big moves over time
✅ You want to draw accurate trendlines in long-term charts
✅ You're dealing with assets that grew 5x, 10x or more
✅ You care about % gains instead of raw price
❌ Log Chart – Cons
Less intuitive for beginners
Not useful for low-volatility assets
Small price moves may look insignificant
here is an example of the same chart but in the Log Scale :
As you can see on the chart above there is huge difference in accuracy when you use Log scale
for the high volatile asset such as BTC specially in the long term movements .
🆚 So, When Should You Use Each One?
Situation Use Linear Use Log
Small price changes ✅ ❌
Day trading / scalping ✅ ❌
Long-term analysis ❌ ✅
Parabolic or exponential moves ❌ ✅
Drawing long trendlines ❌ ✅
Final Thoughts
If your chart looks weird when you zoom out…
If your trendlines don’t quite fit anymore…
Or if you’re analyzing something that went 10x…
🔁 Try switching to Log scale — it might just clean up the noise.
Small toggle. Big difference.
And also remember our golden rule :
🐺 Discipline is rarely enjoyable , but almost always profitable. 🐺
🐺 KIU_COIN 🐺
Time to Wait and Watch
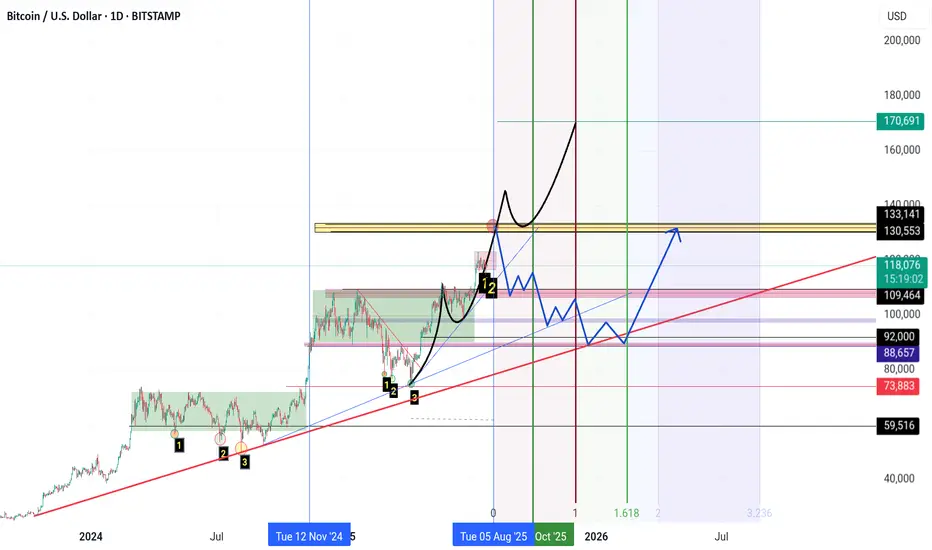
**"The $133K zone remains Bitcoin’s key resistance level.**
If Bitcoin fails to break this resistance for any reason and forms a **reversal candle** in this area,
I expect a **correction phase** to begin, with the market entering **panic sell mode.**
**First support** lies at **$110K.**
Further support levels are **$100K, $92K, and $88K** respectively.
If the price drops to the **$74K zone**, it’s time to **sell everything you’ve got** (yes, even your kidneys!) and **buy Bitcoin.**
However, if **$133K is broken to the upside**, we’re heading for **$140K, $150K, and $170K**… and **then** the real **panic selling** begins."
Bitcoin Who is buying and never taking profits?
The cycle are only cycles if the experience repetition.
Can we experience the full previous wave is the question.
Beyond ICT & SMC: The Mathematical Revolution in Zone TradingIn the world of trading, there's a fundamental divide between traders who rely on subjective interpretation and those who trust mathematical precision. While concepts like ICT (Inner Circle Trader), SMC (Smart Money Concepts), and naked chart analysis have gained popularity, they all share one critical flaw: they're based entirely on personal interpretation.
The Subjectivity Problem
Ask ten ICT traders to mark their Order Blocks, Fair Value Gaps, or Breaker Blocks on the same chart, and you'll get ten different answers. Why? Because these concepts rely on:
Personal bias in identifying "significant" levels
Subjective interpretation of market structure
Discretionary decision-making on what constitutes a valid setup
Emotional influence on analysis
The same issue plagues SMC, CRT (Candle Range Theory), time-based analysis, and naked chart trading. One trader's "liquidity grab" is another trader's "breakout." One person's "strong support" is another's "weak bounce zone."
The Mathematical Solution
This indicator eliminates this guesswork entirely. Instead of relying on subjective interpretation, it:
Calculates exact entry levels using mathematical formulas based on session params
Identifies precise support/resistance zones
Standardises signals across all timeframes, ensuring consistency whether you're on 1m or 15m charts
Removes emotional bias by using algorithmic detection of significant price levels
Numbers Don't Lie
While an ICT trader might debate whether a level is "mitigation" or "inducement," our indicator simply states: "Entry at 1.0847, Stop at 1.0832." No interpretation needed. No second-guessing. Just mathematical precision derived from actual price action.
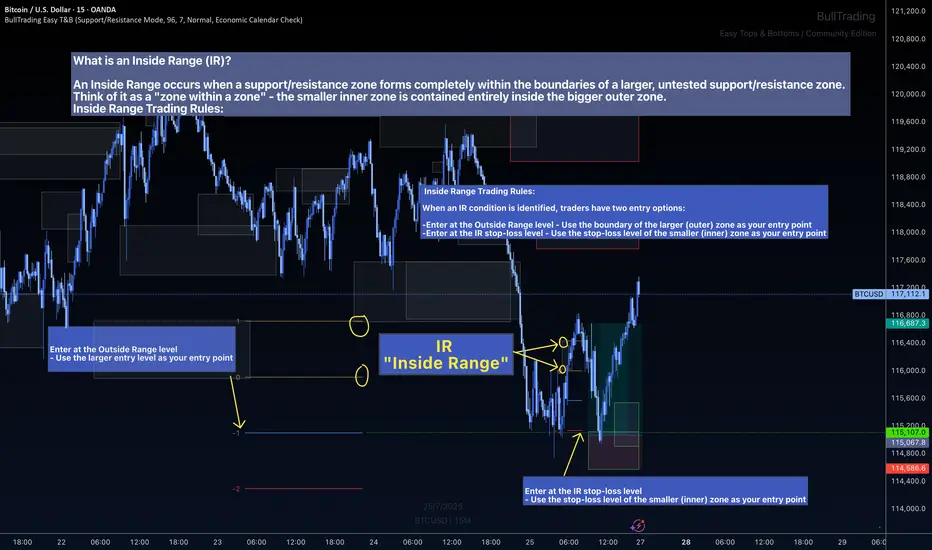
The Inside Range Advantage: When Zones Within Zones Create Superior Trading Opportunities
Most traders miss one of the most powerful setups in technical analysis: the Inside Range (IR). While ICT traders debate "nested order blocks" and SMC followers argue about "refined zones," you can easily identify Inside Ranges with this indicator and mathematically identify these high-probability setups with zero ambiguity.
What Makes Inside Ranges Special?
An Inside Range occurs when a new support/resistance zone forms completely within an untested larger zone. Think of it as the market revealing its hand twice – first showing you the broader area of interest, then pinpointing the precise level within it.
The Mathematical Edge
While discretionary traders struggle to identify these setups consistently, this indicator:
Automatically detects when a smaller zone forms within a larger untested zone
Calculates two precise entry options without any guesswork
Eliminates the confusion of nested levels that plague subjective analysis
Two Entries, Zero Confusion
Documentation and full trading system instructions can be found on the indicator's publication
When an IR forms, the indicator provides exactly two mathematically-derived entry options:
The Outside Range entry – Using the larger zone's entry level
The IR Stop-Loss entry – Converting the inner zone's stop level into an entry point
Compare this to SMC's "refined OB" or ICT's "nested FVG" concepts where traders endlessly debate which level is valid. With Inside Ranges, there's no debate – just two clear, calculated levels.
Inside Ranges represent areas where institutional interest overlaps. The larger zone shows initial interest, while the smaller zone within reveals refined positioning. By mathematically identifying these setups, you're trading where smart money has shown its hand twice.
Real Consistent Precision
Instead of squinting at charts trying to identify subjective "zones within zones," let mathematics do the heavy lifting.
In trading, consistency beats creativity. Stop drawing arbitrary lines and hoping for the best. Start trading with mathematical precision.
Documentation and full trading system instructions can be found on the indicator's publication →
Trade with confidence. Trust in mathematics. Trust in your Edge.
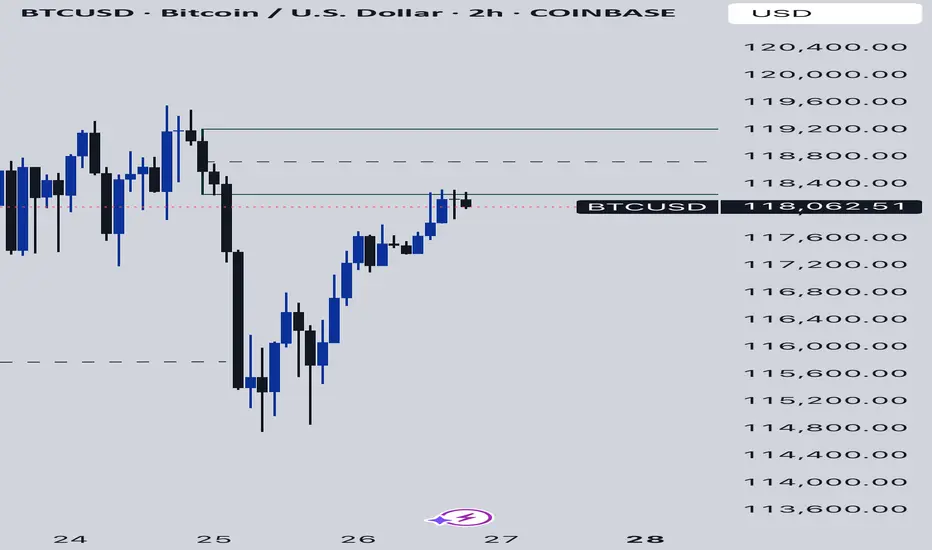
Btcusd techinical analysis.Btcusd techinical analysis next move posibale at h2 time frame not finchinal advice.
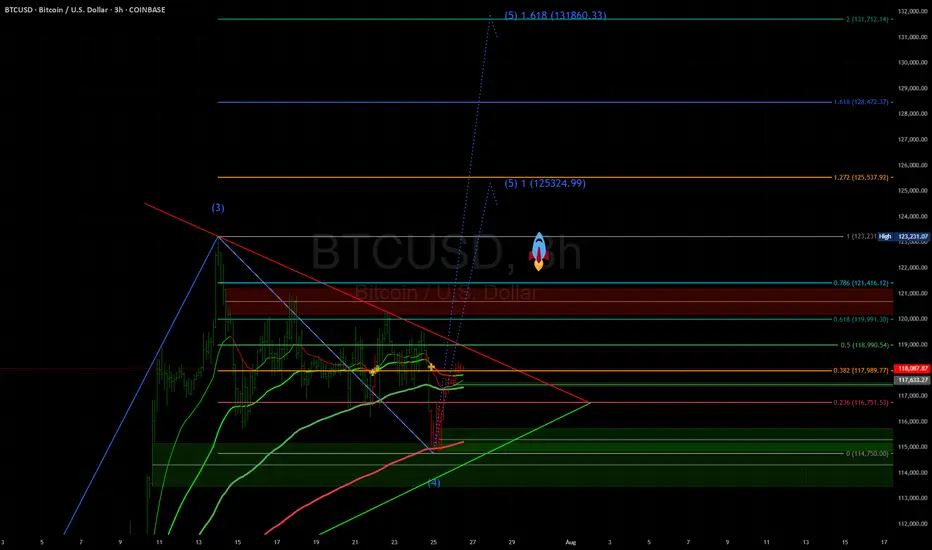
Bitcoin – “topping-zone” update, grounded in the play-book 1️⃣ Big-picture wave count
We are deep inside cycle wave ⑤; sub-wave ③ delivered the textbook power surge, and price has now produced the final “pin” beyond the wedge roof – a move that often marks the last heartbeat of a fifth wave before the engine cools
.
The spike paused almost exactly at a 1-for-1 projection of wave ①, which is one of the three classic objectives for a non-extended wave ⑤ (0.618 ×, 1.0 × or 1.618 × wave ①)
.
Translation: price has reached the textbook exhaustion zone that the slide deck flags as “start thinking about profit-taking”.
2️⃣ What the internals are whispering
The manuals remind us that momentum should start to lag into a wave ⑤ – that’s exactly when bearish divergence appears and warns that the impulse is running out of stamina .
We now have that divergence across the three-day pane, lining up perfectly with the theory. In the past, that signal has kick-started either:
a shallow wave-four-type pullback (23.6 – 38.2 % of the entire leg) if the up-trend is still healthy, or
a full ABC retrace back to the 38 – 50 % pocket when the whole five-wave sequence is complete.
3️⃣ Fibonacci map – unchanged edges, new mid-points
Layer Why it matters (per slides)
117 k – 118 k 0.382 extension cluster and sub-wave ③ peak – first ceiling.
123 k wick 1.0 × wave ① – often the maximum for a regular wave ⑤
.
126 k – 131 k 1.618 overlay of the sub-waves – only reached if wave ⑤ “blows off”.
109 k 23.6 % retrace of the whole advance – first landing pad for a normal pullback
.
103 k – 99 k 38–50 % retrace – where a completed impulse usually rests before the next macro move.
4️⃣ Likely path from here (probabilities courtesy of the slide guidance)
Scenario Odds What you’d expect? How the slides back it up?
Truncated top – the wick was the high ~60 % Price rolls over swiftly; three-leg drop towards 109 k unfolds within weeks. Divergence in a ⑤ is a tired market; truncated fifths are common when wave ③ was extended
.
Mini blow-off to 126–131 k ~30 % Market reclaims the wedge roof quickly, squeezes short sellers, then stalls at 1.618 cluster. Slides label 1.618 × wave ① as the “stretch target” for an extending ⑤
.
Magazine-cover 139 k print <10 % Needs vertical follow-through and no weekly divergence – neither is present. Only seen when sentiment is euphoric and momentum refuses to fade (not the case now).
5️⃣ How to turn this into trades (slide-rule style)
Trail profits, don’t chase: the slide on “profit-taking in wave ⑤” recommends feeding the position back to the market once equality or 0.618 targets print, rather than waiting for a collapse
.
Watch the 23.6–38.2 % retrace band: that zone is the historic sweet spot for a healthy reset after a parabolic run; if price bounces there with improving momentum, the up-trend can restart
.
If— and only if—price vaults the wedge roof again, leave a runner for 126–131 k, but tighten stops using the 78.6 % trailing method highlighted in the slides.
In plain English
Bitcoin has done everything a late fifth wave is supposed to do: overshoot a channel, tag a textbook fib target, and lose its breath while momentum lags. That doesn’t guarantee an immediate plunge, but history – and the curriculum we’ve been working through – say a meaningful pullback is now the path of least resistance. Prepare for a cooling phase toward the low-100 k region; if we sprint instead, treat it as a bonus round, not the baseline.

Bitcoin (BTC/USD) Weekly Analysis. Bull Market Top1️⃣ Key Market Structure - Elliott Wave Analysis
📉 Elliott Wave Progression:
BTC is in Wave 5️⃣, which historically marks the last bullish impulse before a potential correction.
Wave 3️⃣ was strong, confirming the trend continuation.
Now BTC is approaching the potential Bull Market Top 🚀.
🟢 Current Market Position:
BTC is forming Wave 5, targeting $117K - $139K as per Fibonacci extensions.
The final Wave 5 completion zone is projected within this range.
2️⃣ Fibonacci Retracement & Extension Levels
📊 Fibonacci Levels to Watch:
📍 0.236 Retracement: $93,845.34 ✅ (Minor pullback support)
📍 0.382 Retracement: $85,842.61 ✅ (Stronger correction zone)
📍 0.5 Retracement: $79,876.11 ⚠️ (Critical mid-level support)
🎯 0.382 Extension: $117,331.51 (Potential first target resistance)
🎯 0.618 Extension: $139,205.03 (Bull Market Top Projection)
📌 BTC Weekly High: $109,358.01
📈 BTC Current Price: ~$99,449.97
3️⃣ Technical Indicators - Confirmation Signals
📊 MACD (Momentum Indicator)
✅ MACD Histogram is still positive ➝ Confirming bullish momentum.
⚠️ Flattening MACD lines ➝ Indicates momentum might be slowing.
📊 RSI (Relative Strength Index):
🔼 RSI is near overbought zone (~69-70)
⚠️ Possible local top - BTC might need a correction before further upside
4️⃣ Key Support & Resistance Zones
🛑 Major Support Levels:
🟢 $93,800 (0.236 Fib - Short-term pullback zone)
🟢 $85,800 (0.382 Fib - Stronger correction zone)
🟢 $79,800 (0.5 Fib - Must hold support for long-term bullish trend)
🎯 Resistance Levels - Price Targets:
🔴 $109,000 (Current High - Short-term resistance)
🔴 $117,000 (First Major Resistance - 0.382 Fib Extension)
🚀 $131,000 - $139,000 (Bull Market Top Zone - 0.618 Fib Extension)
5️⃣ Trading Strategy & Market Outlook
💹 Bullish Bias Until BTC Breaks Below $93,800
🎯 Target Areas for TP (Take Profit):
✅ Conservative Traders: Exit near $109,000 - $117,000
✅ Higher Risk Targets: $131,000 - $139,000
⚠️ Risk Management:
🛑 Stop-loss: Below $93,000 to protect against a deeper correction.
📈 Scaling In: Consider adding positions if BTC retraces to the 0.382 ($85,800) or 0.5 ($79,800) Fibonacci level.
💡 Summary & Final Thoughts:
✅ BTC is in the final Elliott Wave 5 move, targeting a potential Bull Market Top of $131K - $139K based on Fibonacci extensions.
⚠️ However, RSI is overbought, and MACD momentum is slowing, meaning a pullback to $93K or $85K is possible before the next move higher.
🚀 Bullish until BTC breaks below key supports. Watch $109K and $117K for short-term resistance.
📊 Strategy: Hold long positions with profit-taking targets at $117K, $131K, and $139K. Use $93K as a support level for risk management.

$BTC NEXT WAVE PROGRAMMED!bitcoin will load the next wave after the accumulation process it is in after the parabolic run
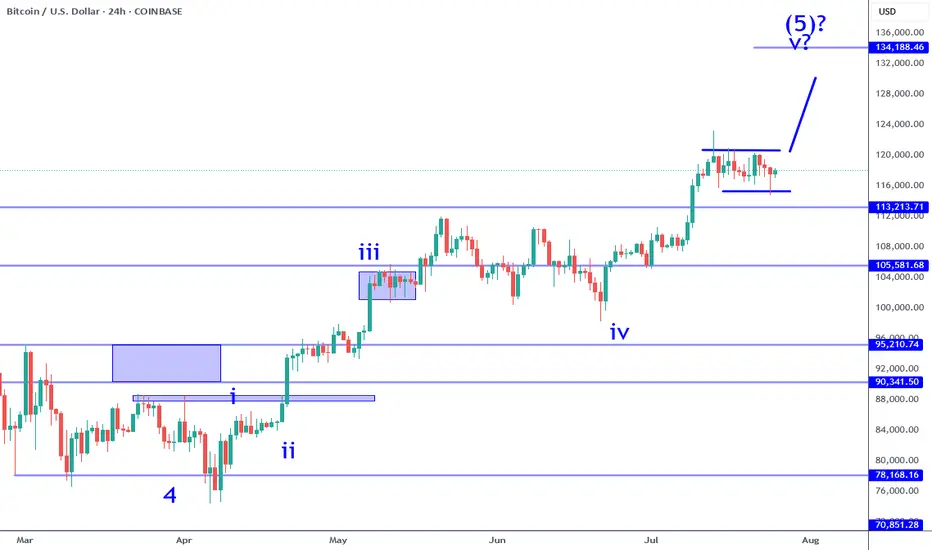
Bitcoin Still Consolidating For Wave 5 RallyBitcoin sub wave 4 consolidation continues to persist. While there was a failed break out over the previous week, it has not changed the bullish impulse at all. The current structure implies that there is a higher probability that one more leg higher (sub wave 5) is likely. It could be the coming week or next, it is all a function of catalyst. Keep in mind this consolidation can test as low at 113K and still be within the criteria of a wave 4. There are numerous opportunities in this situation when it comes to day trade and swing trade longs.
The break out: IF price pushes beyond 120K with conviction (large sustained candle on this time frame) that would be a swing trade long signal. IF there is no instant pullback (fake out), this can be the momentum required to test the 130Ks. Keep in mind, there is an inflection point in the 133K area which serves as a profit objective to measure from. Price can potentially go beyond that point, but participating in that is all about waiting and watching how price behaves. There is NO way to know how this will play out in advance. You have to adjust as new information becomes available.
The retest: if price pulls back into the 116K to 113K area and establishes a reversal on this time frame (or on adjacent time frames like 4H). This can appear in numerous ways: pin bar, engulfing candle, inverse head and shoulders, etc. This scenario would offer greater potential especially if the break out occurred soon after (high probability). IF the 113K level breaks instead, it will put the impulse structure into question. Meaning the probability of a wave 5 to follow will become lower.
This environment in my opinion is not easy to navigate for traders. People who bought into the alt coin weakness months ago are now getting paid and enjoying "alt season", which is great but not good if you are looking to buy something now with a longer time horizon in mind. Wave 5's often signal a corrective move is likely to follow and Bitcoin is potentially completing a very large magnitude Wave 5. I have been pointing this out for months. Most investors will ignore this because they will be biased by greed. The wise this to do is lock in profits along the way at inflection points such as whole numbers, price proportions (like 133K) and/or clear candle reversal signals after significant moves.
Thank you for considering my analysis and perspective.
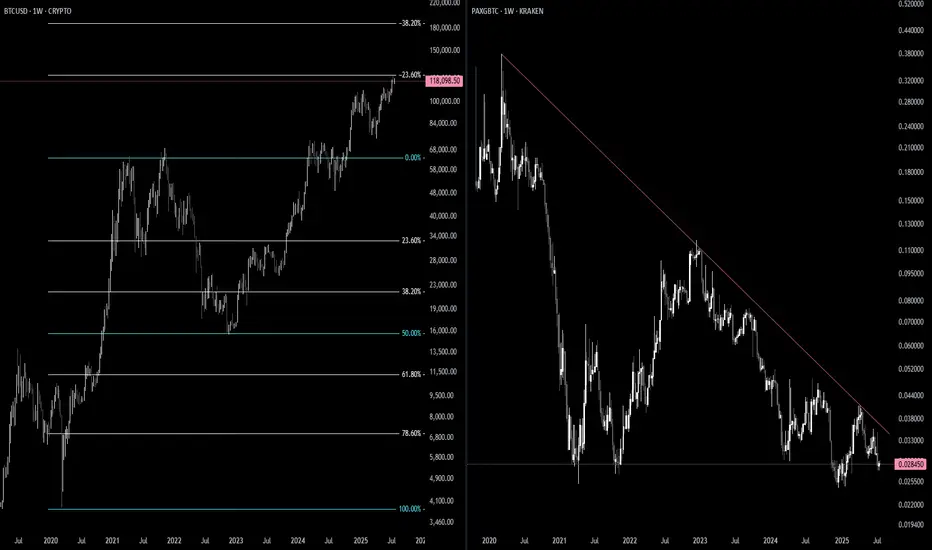
BTC / GOLD 2.0Here is another more zoomed out view of the inverse relationship of BTC to the PAXGold / BTC ratio. This is beautiful and perfect. One can see how they are practically mirrored opposite images of each other. Higher. SOON.
BTCUSD--SHORT--26_07_25--breaking orange trendline
--pullback and retest trendline between levels 119597,117411
--move down towards descending channel through 111658

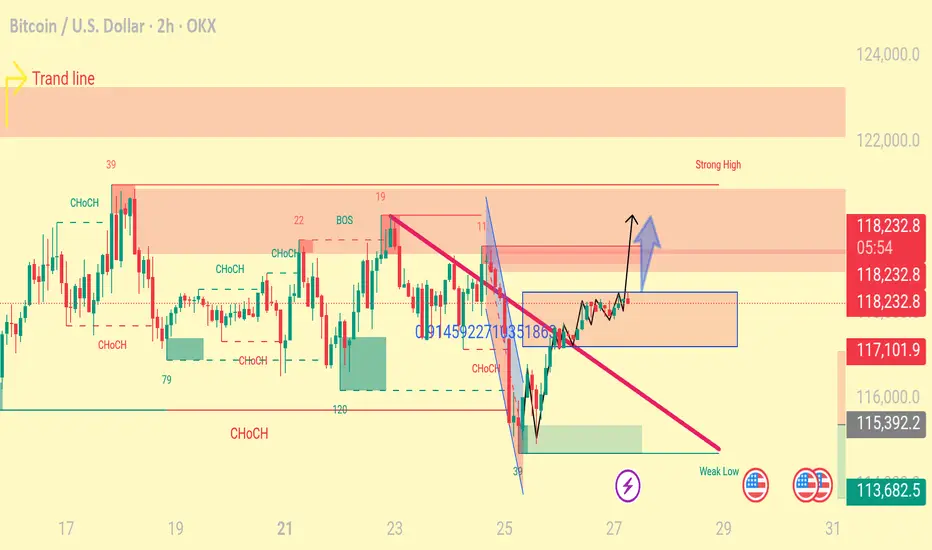
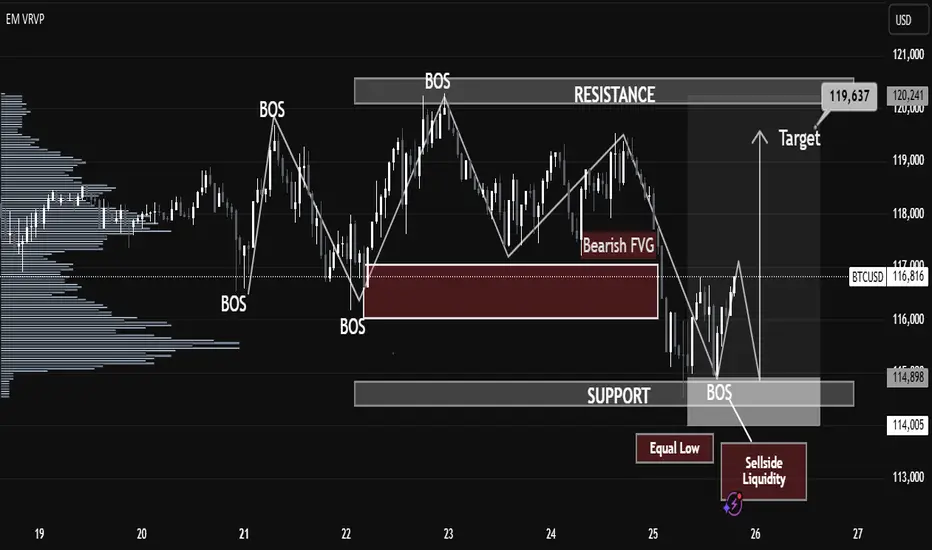
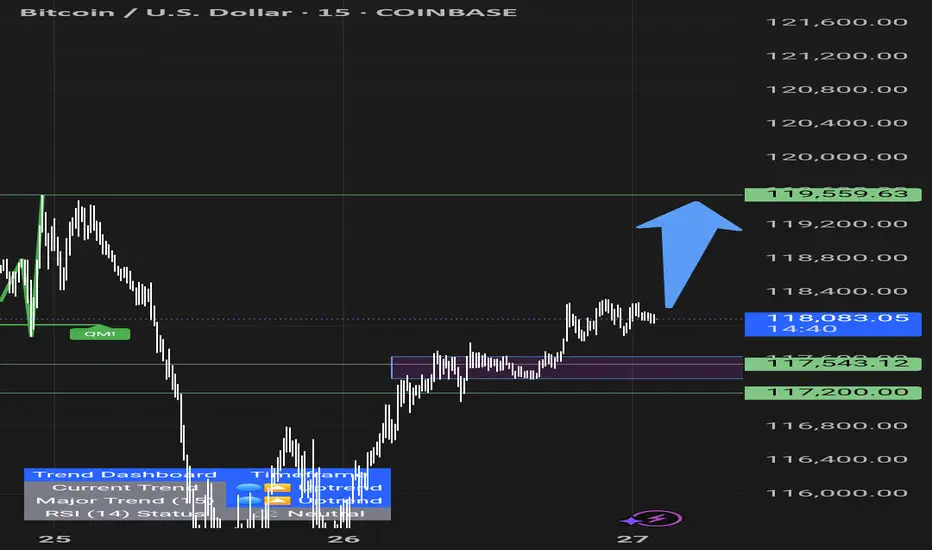
BTC Breaks Structure After Liquidity Grab! Massive Move Loading…BTC/USD Technical Analysis – July 25, 2025
Structure Overview:
The current BTC/USD price action showcases a classic market structure shift, with multiple Breaks of Structure (BOS), liquidity grabs, and a clear intent to revisit premium pricing zones. The chart follows a Smart Money Concepts (SMC) methodology, identifying key supply and demand areas.
Key Highlights:
🔹 Break of Structure (BOS):
Several BOS events indicate momentum shifts and short-term trend reversals. The most recent BOS near the support zone suggests a potential bullish move after liquidity sweep.
🔹 Sell-Side Liquidity & Equal Lows:
BTC swept the Equal Low level near $114,000, triggering Sell-side Liquidity. This liquidity grab is often a manipulative move by institutional players to collect orders before driving price higher.
🔹 Support Zone:
The support zone near $114,900–$114,000 is holding strong. Price wicked into this area, collected liquidity, and reacted with bullish intent.
🔹 Bearish Fair Value Gap (FVG):
A Bearish FVG exists around $117,500–$118,000, which may act as short-term resistance. Price could partially fill this gap before resuming direction.
🔹 Target Zone:
Projected target lies at $119,637, aligning with the prior resistance zone and offering a high-probability area for price delivery based on the current bullish market structure.
🔹 Volume Profile Support:
The volume profile suggests high volume accumulation in the current range, further supporting the possibility of a bullish expansion phase.
Forecast Summary:
Bias: Bullish (Short-term)
Entry Zone: Confirmed after BOS and liquidity sweep near support
Target: $119,637 (resistance zone)
Invalidation Level: Sustained break below $114,000
⚠️ Risk Note:
A rejection from the Bearish FVG or failure to break above $117,800 may cause a deeper pullback. Monitor reactions around key levels before continuation.
BTC 125k - $130KHello Traders,
Using Fibs and Elliot Waves I show possible BTC targets coming soon in the next leg up. Lets see how this plays out.
Bitcoin vs Global M2: Can Liquidity Predict the future?This chart compares Bitcoin’s price (daily) with a Global M2 indicator that includes the monetary supply of major economies like the U.S., Eurozone, China, and Japan.
It’s not a perfect global measure — but it gives us a reliable macro signal of what global liquidity is doing.
And when it comes to Bitcoin, liquidity is everything.
Why this matters:
Bitcoin is often seen as volatile or unpredictable. But when we zoom out and overlay it with liquidity flows (like M2), a powerful pattern emerges:
Bitcoin tends to follow global M2 with a ~10-week lag.
When M2 rises, Bitcoin often rallies weeks later. When M2 contracts, Bitcoin loses momentum.
This makes M2 a powerful leading indicator — not for predicting exact price levels, but for catching the direction of trend and regime shifts.
What this chart tells us:
M2 leads, Bitcoin follows.
The curves won’t align perfectly — but the macro structure is there.
Big expansions in M2 create a friendlier environment for risk assets like BTC.
This is the same logic used by macro strategists like Raoul Pal: liquidity drives everything.
Important disclaimer:
This doesn’t mean M2 tells you where price will be on a specific date. But it can help identify turning points — and confirm whether we’re in a reflationary vs contractionary environment.
Think of it as a weather forecast, not a GPS pin.
In other words:
This chart doesn't show the price. It shows the future.

Market shows signs of indecisionThe market is in a state of indecision, and no indicator or oscillator can help determine the next move — none of them are useful right now.
The market is waiting to make a decision, and so are we.
We need to stay patient and see which direction it chooses.
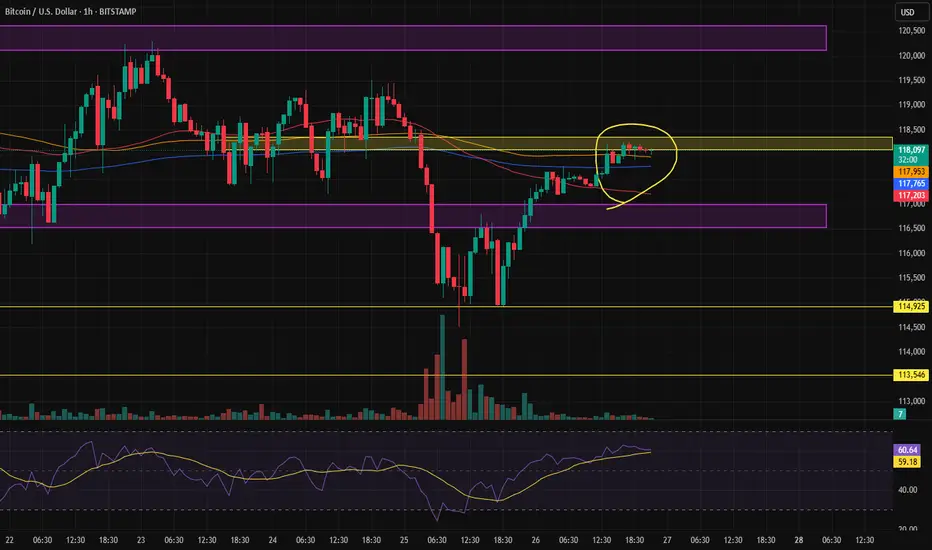
BTCUSD As BTCUSD fell back to 118k, we’ve some good break of structure to the downside with some good momentum seen from the H4 timeframe. Could this be giving us some good bearish sentiment? Or it’s just one of the mini-fluctuations pullbacks as they accumulate enough orders to push the BTCUSD markets even higher.
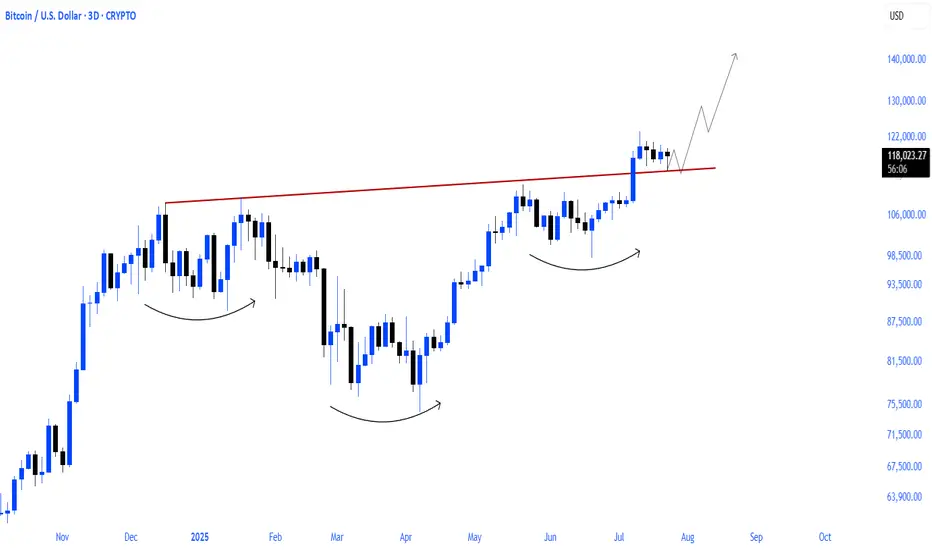
Bitcoin going up because of Cup and Handle!Bitcoin will continue to go up to finish it's measured move from the cup and handle chart pattern playing out. Looks like the text book image of a cup and handle. Lol. Perfection!
BTC at Multi-Factor Resistance: Wave Count Hints at Downside BTC is looking increasingly bearish as the price has risen to a resistance zone formed by multiple factors: trendlines, the POC (Point of Control), and moving averages.
The wave count also supports this bearish outlook / the bearish case.
