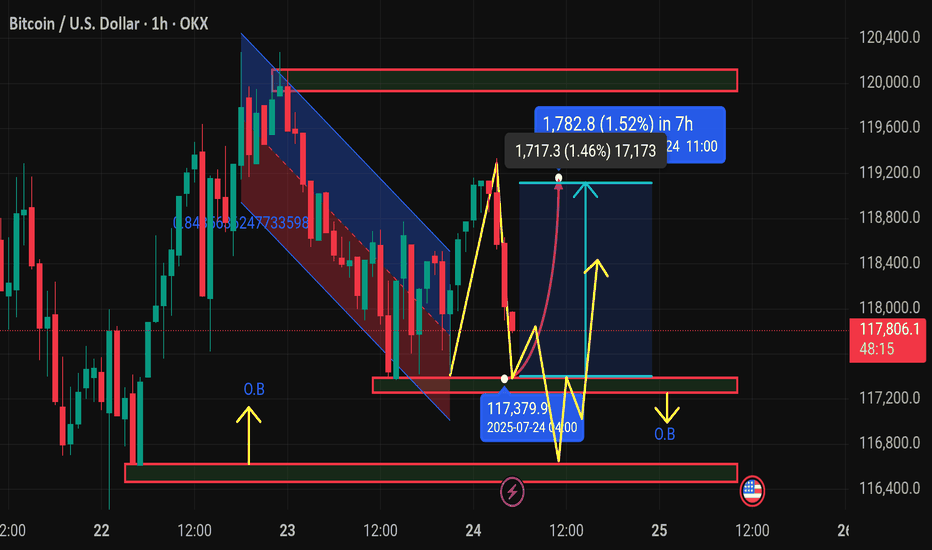
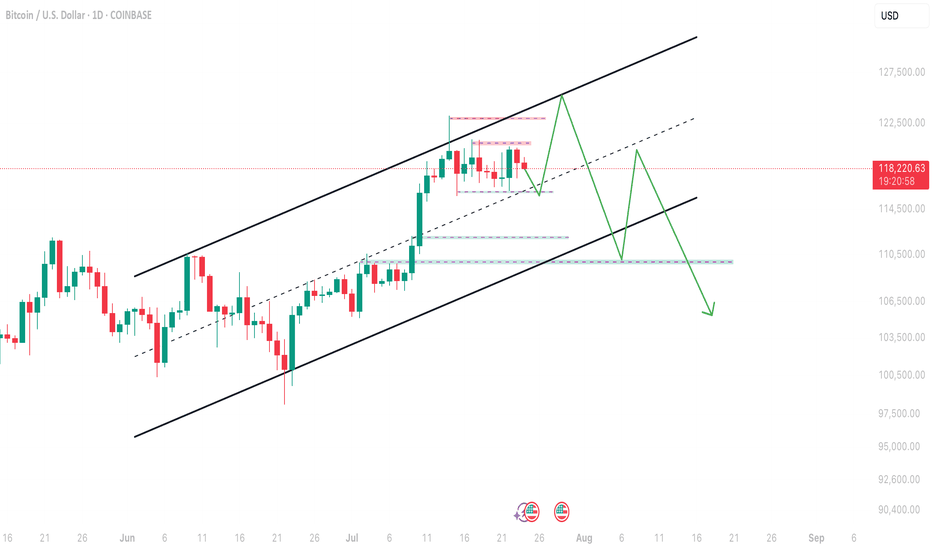
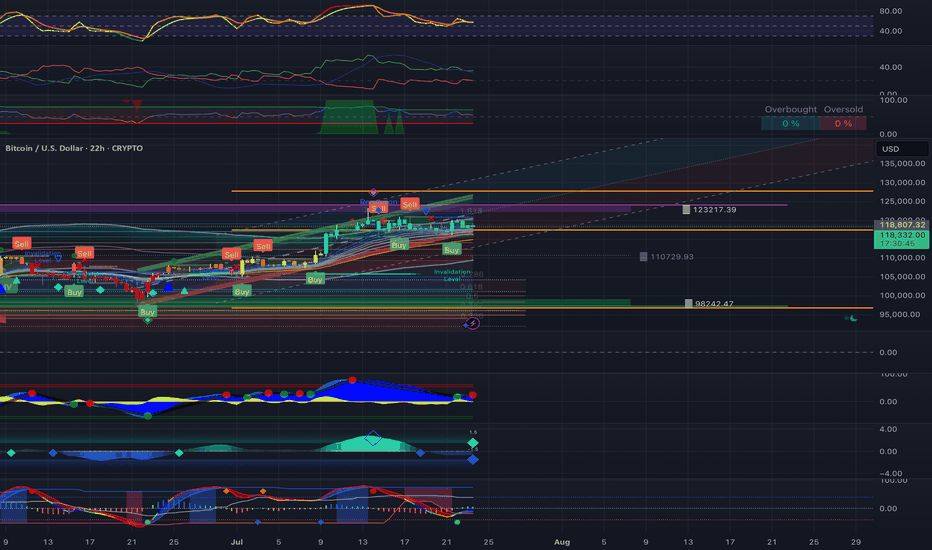
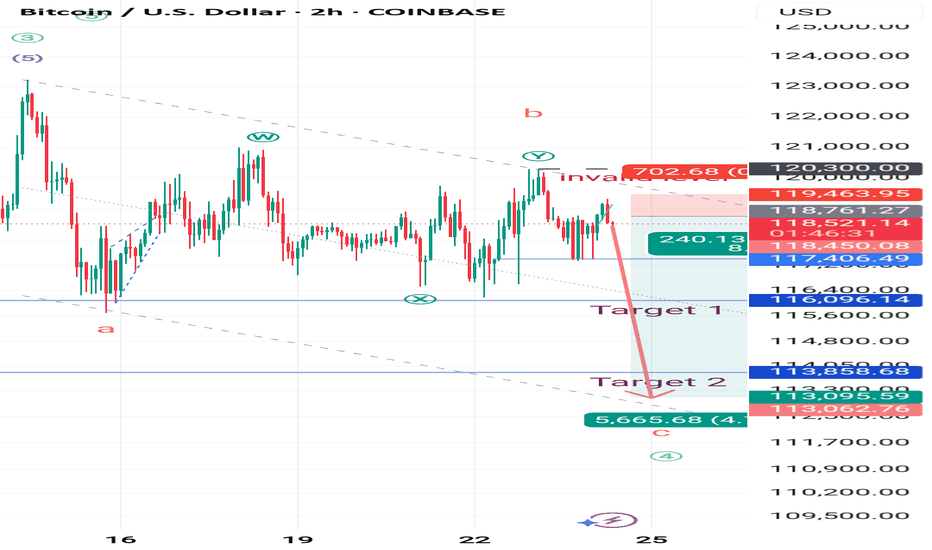
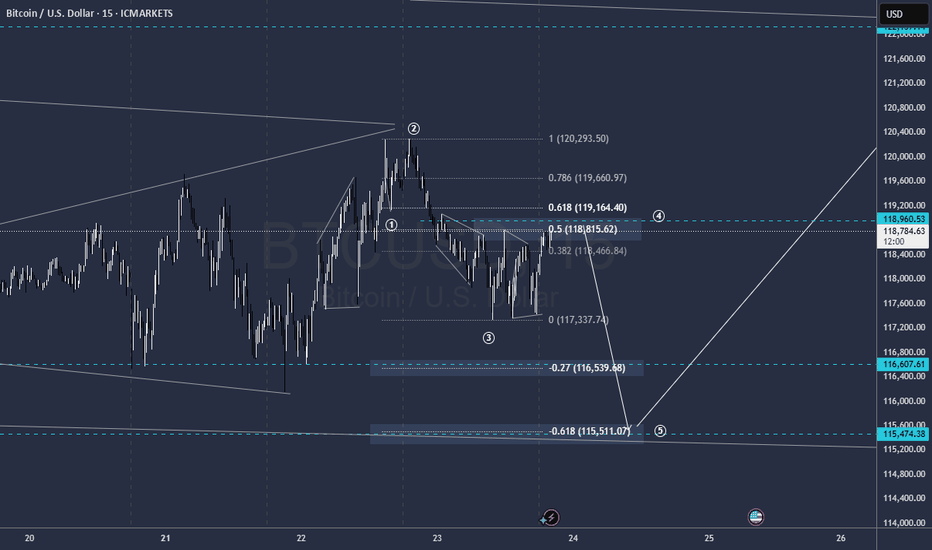
BREAKING – US to Unveil Key Crypto Report: Crucial Moment for BiIn what could be a watershed moment for the digital asset industry, the U.S. government is expected to release a major crypto policy report in the coming days. Sources suggest the report will outline a framework for regulating digital assets, including Bitcoin, stablecoins, and DeFi—potentially defining how crypto will be governed in the world's largest economy.
Why This Report Matters Now
Amid rising political and economic pressure, the U.S. is being forced to take a firmer stance on crypto. With the 2024 elections behind and growing institutional participation, Washington is no longer able to delay key decisions.
Expected highlights of the report include:
Clarification on whether certain crypto assets are securities
Guidelines for stablecoin regulation
A potential roadmap for central bank digital currency (CBDC) development
Recommendations on DeFi and wallet service compliance
The report comes at a time when market volatility and fragmented oversight have led to investor uncertainty and inconsistent enforcement across states and agencies.
Possible Scenarios: Boom or Bust
Pro-Bitcoin Outlook
If the report favors clear rules, supports innovation, and endorses Bitcoin as a commodity (as the CFTC suggests), it could trigger a strong market rally. Institutional players sitting on the sidelines may finally enter.
Harsh Regulation
On the other hand, if the report leans toward heavy-handed enforcement—especially targeting self-custody, privacy, or DeFi—it could stifle innovation and lead to capital flight to offshore markets.
Neutral-but-Positive
A middle-ground report offering regulatory clarity without immediate enforcement could calm markets and lay the foundation for measured growth.
What’s at Stake for Bitcoin?
Bitcoin’s status in U.S. law remains technically undefined, though it’s generally viewed as a commodity. A clear statement reaffirming this status could fuel renewed institutional demand, ETF expansions, and deeper integration with traditional finance.
Conversely, if Bitcoin is lumped into broader regulatory restrictions, especially around AML or taxation, it could face new compliance burdens—dampening short-term momentum.
How the Market Is Reacting
Ahead of the report, Bitcoin has shown elevated volatility. Whales appear to be repositioning, with increased activity across derivatives markets and stablecoin inflows—indicating expectation of major movement.
Traders are watching key support at $56,000 and resistance near $60,000. A clear policy win could break this ceiling fast.
Conclusion
The upcoming U.S. crypto report could mark a historic regulatory pivot. For Bitcoin and the broader industry, the stakes are high: legitimacy, liquidity, and long-term growth—or repression and stagnation. One thing is certain—the days of regulatory limbo in the U.S. are numbered.
BTCETH.P trade ideas
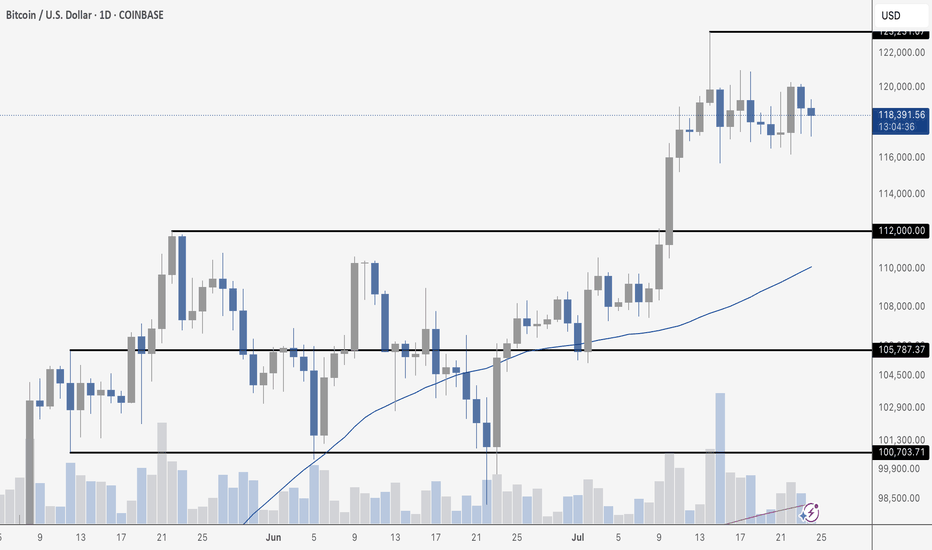
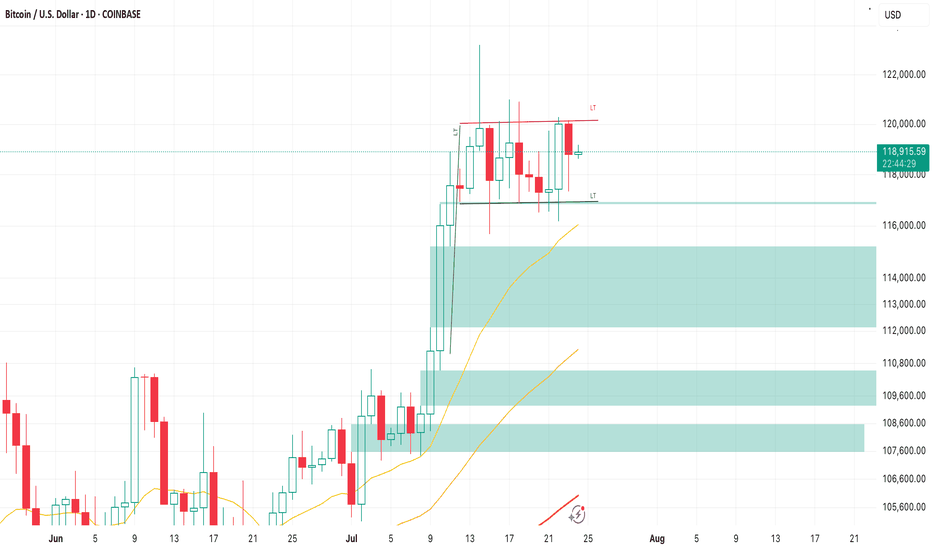
BTC CONSOLIDATESBitcoin is clearly consolidating after its recent breakout above $112K. Price is chopping between roughly $116K and $121K, taking a breather after last week’s rally. Tuesday marked the highest daily close in BTC history, but follow-through has been muted so far.
Volume is trending lower during this range-bound action, which is typical during consolidation. The 50-day moving average continues to rise and now sits around $110K, providing a strong cushion if price pulls back.
The structure remains bullish above $112K, but traders are watching for a breakout above $125K to confirm the next leg higher. Until then, expect more chop as the market digests gains.
BTC Ready to Start to 125KMorning folks,
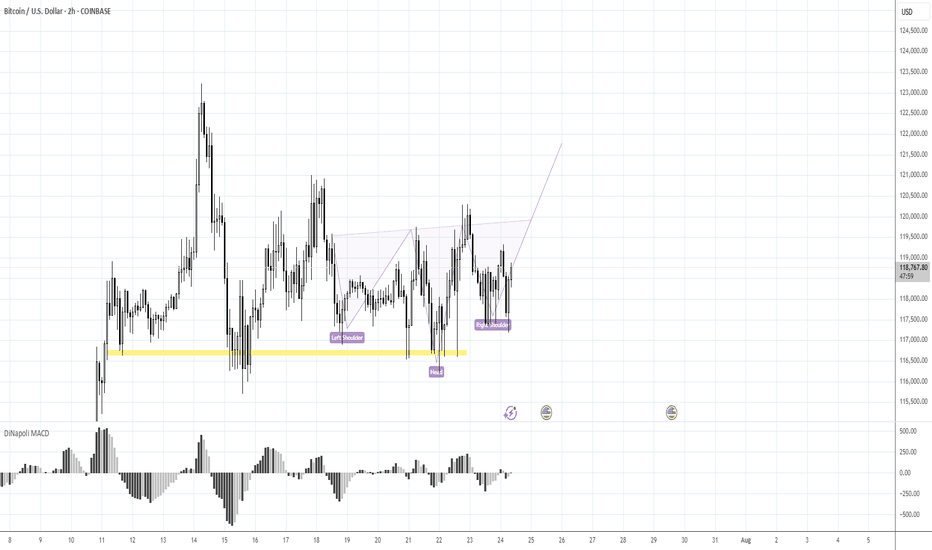
Better if you combine this update with previous idea. Now it seems that BTC stands in swamp action, flirting around 116K, which might be looking a bit bearish.
But by our view, this is not quite so. First is, triangle patterns as on daily chart as on 4H chart are look great and quite bullish. Pay attention that on 4H chart all sell-offs were bought out.
Our 1.16 lows that we set as vital ones for this scenario area still intact. So, it means that butterfly with 125K target that we discussed last time is also intact. I would say more. If you take a careful look at 1H chart - you could recognize reverse H&S pattern that could trigger all this stuff. It means that we're not in swamp, but at the point where the decision on long entry has to be made...
Take care
S.
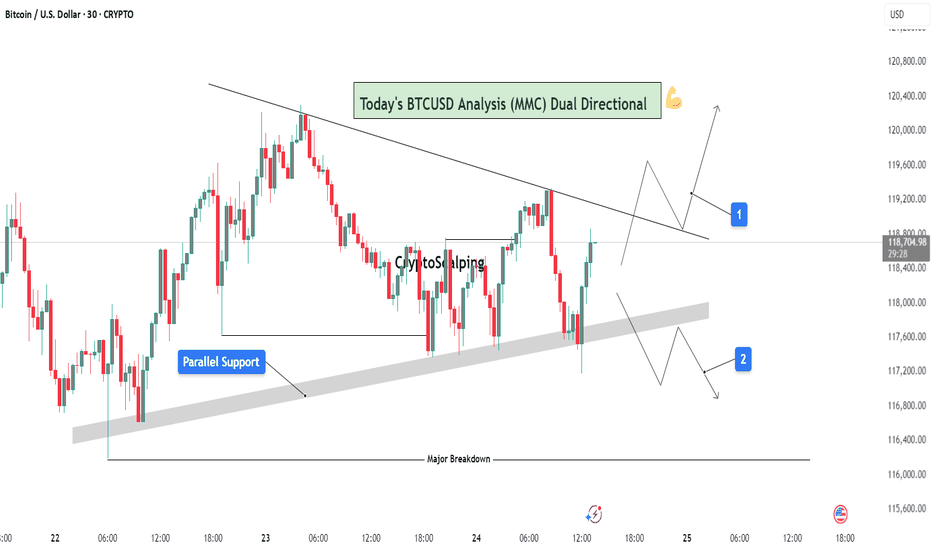
BTCUSD Analysis (MMC) : Dual Directional Outlook let's See🔍 1. Overview of Structure & Context:
On the 30-minute timeframe, BTCUSD is consolidating between two strong technical zones:
A descending trendline acting as resistance
A parallel rising support forming a compression zone
This wedge-like formation signals a potential high-impact move in either direction — a dual-directional outlook. Price is currently testing the midpoint between resistance and support, offering two reactive trade scenarios.
🟦 2. Key Zones Highlighted on Chart:
🔹 A. Parallel Support Zone (Dynamic Support):
A grey-shaded rising support has been tested multiple times.
Each bounce suggests buying strength near this diagonal zone.
This zone represents smart money accumulation potential under MMC concepts.
As price approaches this zone again, bulls are expected to step in if momentum aligns.
🔹 B. Descending Resistance Line (Supply Line):
The market is facing lower highs, a sign of bearish control at higher levels.
Each retest of this line has led to a rejection.
This line also acts as a liquidity magnet — price may spike above it to trap buyers before dropping (false breakout potential).
🧭 3. Scenarios and Trade Possibilities (Dual Directional Path):
✅ Scenario 1: Bullish Breakout – (Marked as Path 1)
If BTC breaks above the descending trendline with strong bullish volume, this confirms a structural breakout.
This setup targets:
First level: $119,600
Second level: $120,200
Once broken, the trendline can flip into support.
Ideal confirmation:
Bullish engulfing candle on breakout
Retest of broken resistance turning into support
Volume surge or momentum indicators turning bullish
⚠️ Scenario 2: Bearish Rejection & Breakdown – (Marked as Path 2)
If BTC fails to break resistance and breaks below the parallel support zone, it opens a bearish scenario.
Price may fall back to:
First level: $117,200
Final key support: $116,400 (Major Breakdown Zone)
This is a typical MMC-style mirror move: a structure break leading to liquidity run toward a previous demand zone.
Bearish confirmation:
Close below grey zone
Lower high formation near resistance
Increasing bearish volume / weak bounce
📐 4. Strategy & Trading Tips (MMC Application):
Under the Mirror Market Concepts (MMC), these zones are not just technical levels — they represent emotional price memory of both institutional and retail players.
Wait for the reaction, not prediction.
Use confluence tools (RSI divergence, volume, candle patterns).
Avoid trading inside the wedge — it's a trap zone.
Ideal entries are at breakout with retest confirmation or rejection from major zones.
📊 Risk Management Plan:
Entry Type Trigger Level SL Suggestion TP Range
Long Trade Break & retest above $118.8K Below $118.2K $119.6K → $120.2K
Short Trade Breakdown below $117.8K Above $118.2K $117.2K → $116.4K
🧠 Conclusion:
BTC is in a decision-making zone between a downward pressure line and strong support. A breakout could lead to a clean trend continuation, while a breakdown would trigger bearish momentum. The chart reflects precision MMC logic, offering a tactical map for day traders and scalpers to follow the smart money — not the noise.
Let the market decide direction. We just need to be prepared, not predictive.
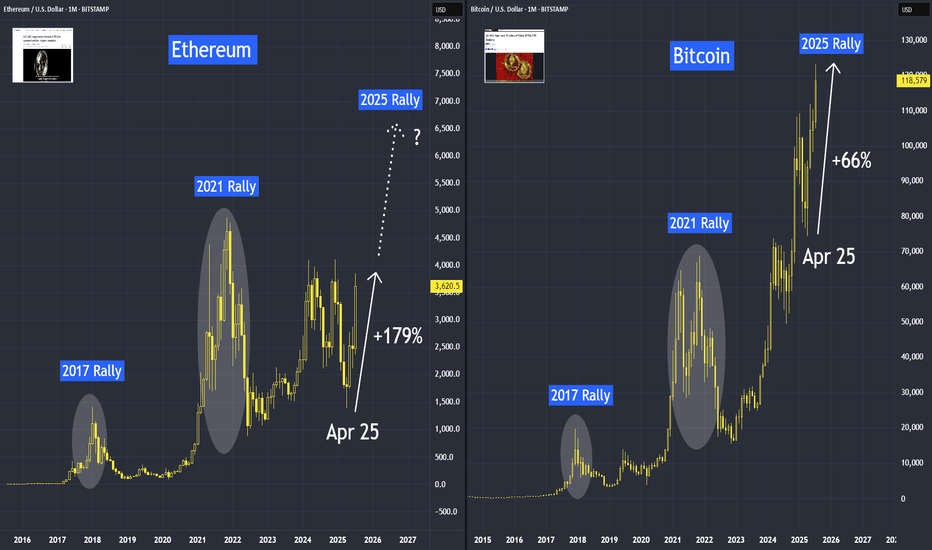
Ethereum is Trending HigherSince April trough, Ethereum has risen by 179%, delivering a higher rate of return than Bitcoin at 66%. But most of our attention is on Bitcoin, breaking above the 120,000 level.
Why is Ethereum quietly gaining ground —and what does the future hold for Ethereum?
Mirco Bitcoin Futures and Options
Ticker: MET
Minimum fluctuation:
$0.50 per ether = $0.05 per contract
Disclaimer:
• What presented here is not a recommendation, please consult your licensed broker.
• Our mission is to create lateral thinking skills for every investor and trader, knowing when to take a calculated risk with market uncertainty and a bolder risk when opportunity arises.
CME Real-time Market Data help identify trading set-ups in real-time and express my market views. If you have futures in your trading portfolio, you can check out on CME Group data plans available that suit your trading needs tradingview.sweetlogin.com
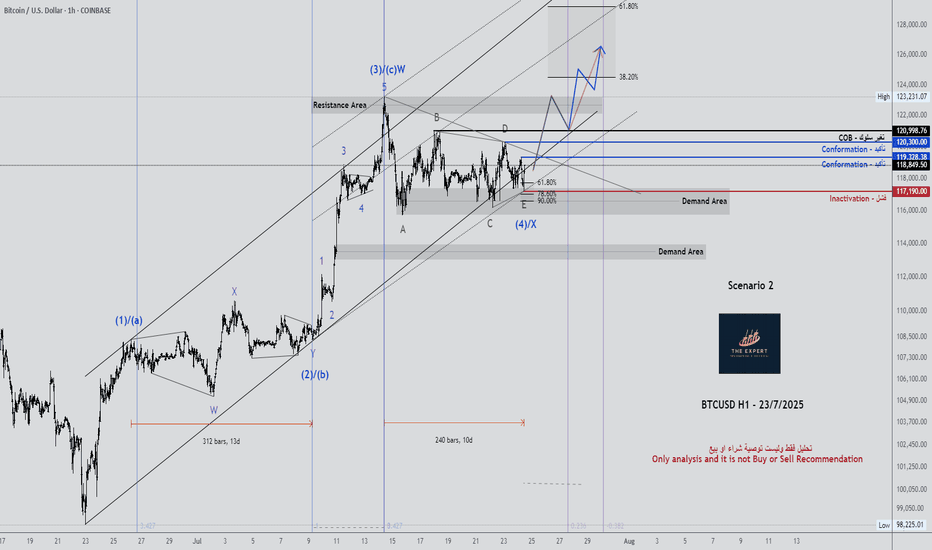
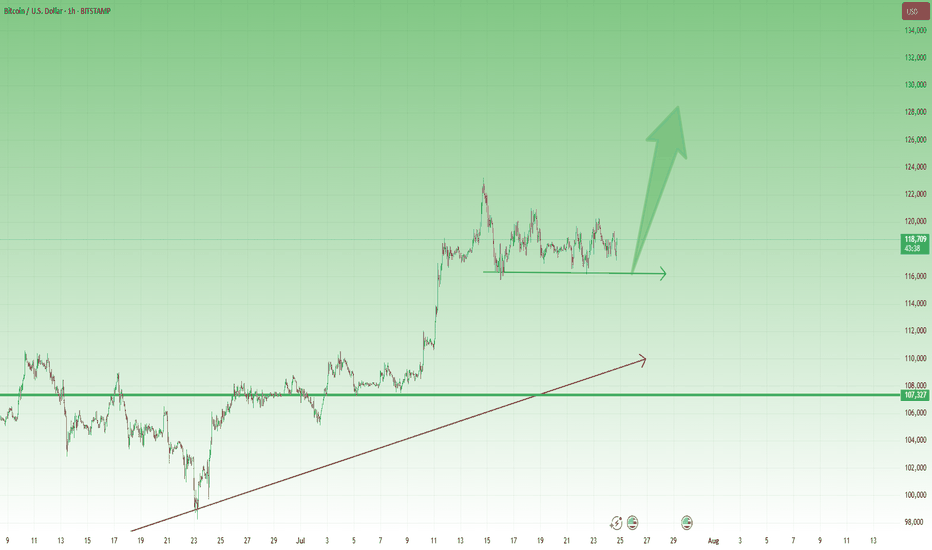
BTCUSD – Bulls Still in Control After New ATH 🔸 After the new All-Time High printed 10 days ago, Bitcoin entered a consolidation phase. So far, the market looks healthy and seems to be waiting for a trigger to continue the uptrend.
🔸 A clear support zone has formed around 116k, and as long as this level holds, bulls remain in full control of the market.
📉 For short-term traders and speculators:
Buying dips near 117.5k could offer solid risk/reward setups, with a target around 125k in case of a breakout.
Let’s see if the market gives us the trigger we’re waiting for. 🚀
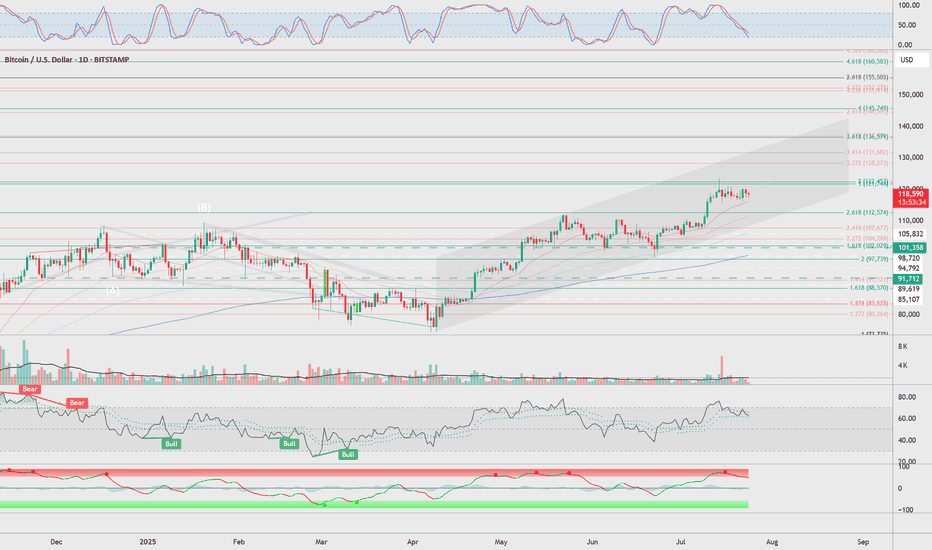
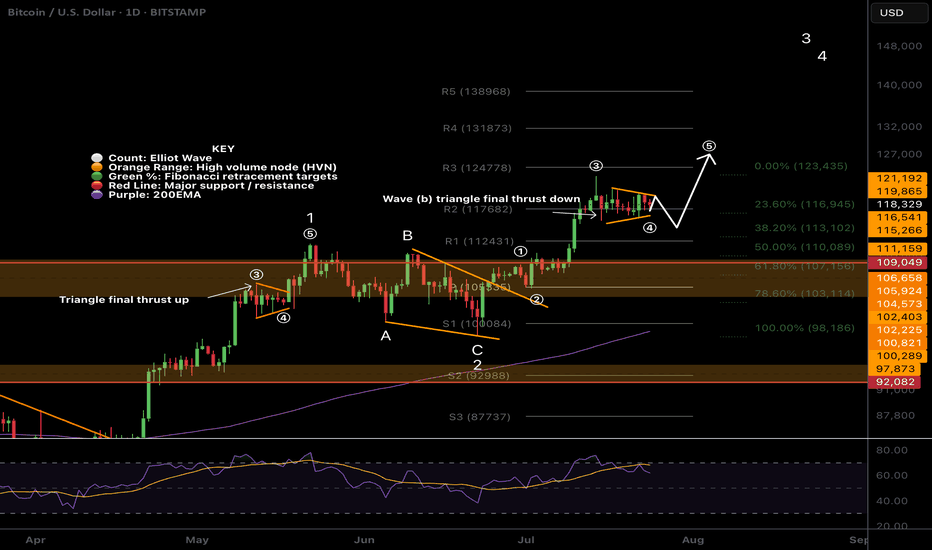
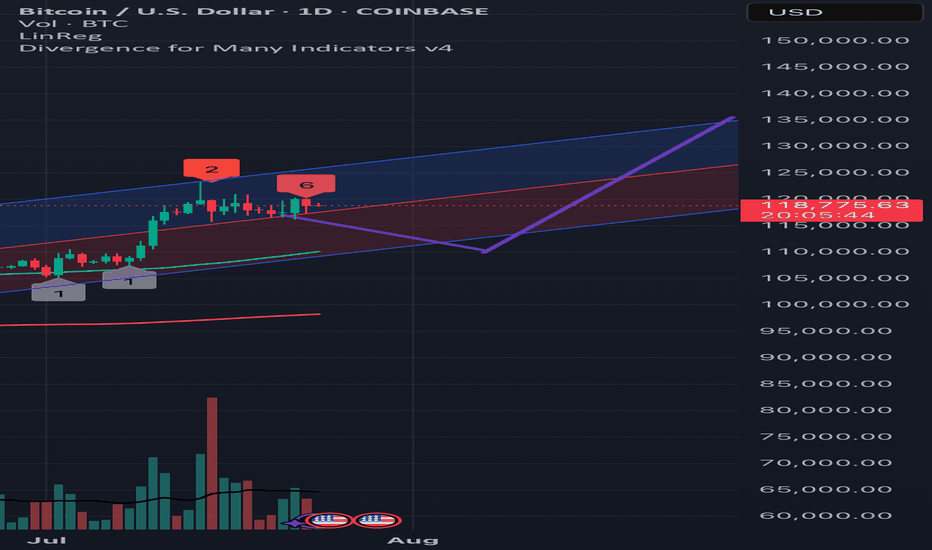
$BTC Wave (b) triangle?CRYPTOCAP:BTC Bitcoin appears to have competed wave 3 up, wave (a) down and now finishing a triangle in wave (b) which would result in a thrust down to around $113k before continuing to the upside in wave (5).
There is slight bullish divergence on daily RSI and wave (4) meets the Fibonacci retracement rules of between 0.236 - 0.382 adding confluence.
Previous all time high is expected to be tested as support on a larger correction, perhaps when the ascending daily 200EMA creeps up to the same level after we blow off.
Safe trading
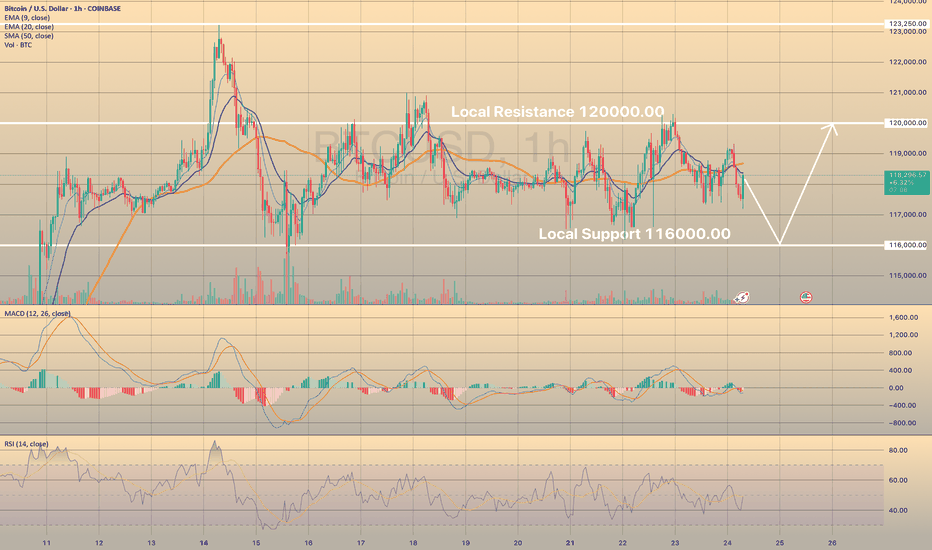
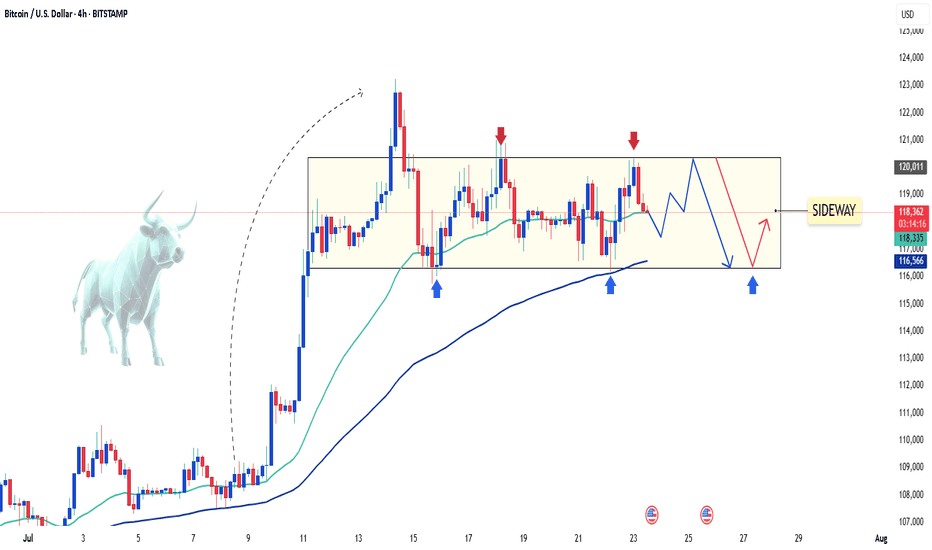
BTCUSD LOST SHORT-TERM BULLISH POTENTIALBTCUSD LOST SHORT-TERM BULLISH POTENTIAL
Bitcoin has been trading sideways since July 15th within a range of 116,000.00-120,000.00. Indicators show no signs of a new bullish/bearish trend.
How to trade sideways movements or range?
It is better to wait for a price to come close to one of the levels (support or resistance), then open buy/sell order. Or just pace a limit order and wait. Take-profit may be above/below the support/resistance levels with a stop-loss behind these levels (below for the support and above for the resistance).
So, the price decline towards 116,000.00 is expected, where potentially the price may rebound once again.
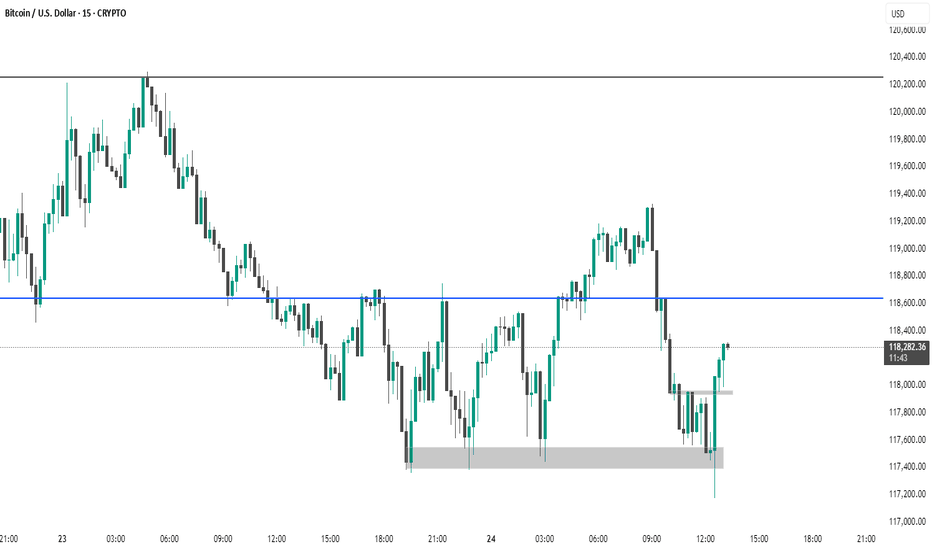
BTC #15-minute Bitcoin (BTC/USD) chartThis 15-minute Bitcoin (BTC/USD) chart shows a recent bullish reversal from a strong demand zone (highlighted in grey near $117,400). Price broke above a minor resistance (grey zone around $118,000) and is currently following an upward trendline. The next key resistance is around $118,600 (blue horizontal line), which may act as a target or reversal point. Bulls are currently in control as long as price respects the trendline and holds above the broken resistance.
thanking you
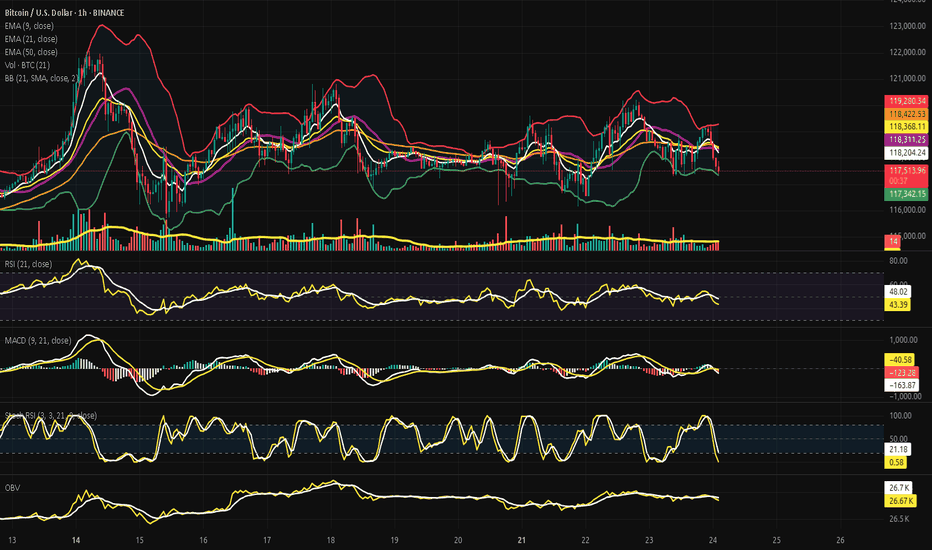
Bitcoin Awaits the Federal Voice - The Threshold of Compression.⊢
⟁ BTC/USD - BINANCE - (CHART: 1H) - (July 24, 2025).
◇ Analysis Price: $117.830,17.
⊣
⨀ I. Temporal Axis - Strategic Interval - (1H):
▦ EMA9 - ($118.267,48):
∴ The 9-period Exponential Moving Average (EMA9) was serving as immediate microstructural support until July 23rd, when a full-bodied bearish candle broke through it with volume below average but directionally firm;
∴ Post-break, EMA9 began to flatten, then bend downward, reflecting a tactical loss of bullish momentum within the intraday range structure;
∴ Price has attempted multiple recoveries toward EMA9 but has been consistently rejected at or below it, confirming its transition into resistance status.
✴️ Conclusion: EMA9 has transitioned from a dynamic support to tactical resistance, indicating a short-term trend deterioration and weakening of upward initiative.
⊢
▦ EMA21 - ($118.396,85):
∴ The 21-period EMA functions as the median layer of microstructure and has held relatively flat for several days, suggesting a compressed momentum environment;
∴ As of the latest price action, the EMA9 has definitively crossed below EMA21 - a classic tactical signal of microtrend exhaustion, especially when paired with lateral volume and a suppressed RSI;
∴ EMA21 remains unbroken since July 21st, reinforcing its role as an anchor level for short-term rejections and as a ceiling against breakout attempts.
✴️ Conclusion: EMA21 maintains structural weight as resistance, and the confirmed cross-under by EMA9 introduces a tactical shift into intraday bearish flow.
⊢
▦ EMA50 - ($118.434,93):
∴ The 50-period EMA, long considered the “defensive perimeter” of bullish short-term structure, had been flattening with slight upward bias since July 19th;
∴ However, in the last two sessions, it has shown the first measurable downward curvature, marking the decay of medium-term intraday bullish control;
∴ Price remains significantly below the EMA50, and multiple upside attempts have failed before even reaching it, reflecting market hesitation and lack of participation.
✴️ Conclusion: EMA50 has begun its first bearish slope since July 16th, indicating an eroded tactical bias and confirming loss of momentum from the bulls' side.
⊢
▦ Bollinger Bands (21, 2) - (Upper: $119.254,34 / Lower: $117.398,28):
∴ The Bollinger Bands have narrowed continuously over the last three sessions, forming a visible compression channel - a prelude to volatility expansion;
∴ Price rejected cleanly from the upper band on July 23rd and traveled to the lower band without support, closing two candles consecutively near the lower range;
∴ The Bollinger Median is aligned with the EMA21, reinforcing its status as the core compression axis and tactical gravity point.
✴️ Conclusion: Bollinger structure suggests imminent breakout scenario; current price behavior signals bearish volatility bias unless structure is broken with strong volume.
⊢
▦ Volume + EMA 21 - (Current: 13 BTC):
∴ Volume has declined steadily throughout the last five trading sessions, as seen in the downward-sloping EMA21 overlaid on the volume histogram;
∴ Recent bearish moves occurred on lower volume compared to previous weeks, indicating low conviction and possible manipulation-prone liquidity zones;
∴ There is no expansion in volume accompanying the most recent directional candles, confirming this as a phase of tactical disinterest rather than distribution.
✴️ Conclusion: Market participants are not committing capital - the tape is flat, silent, and manipulable, increasing the risk of abrupt fakeouts or shadow breakouts.
⊢
▦ RSI (21) + EMA 9 - (Current RSI: 45.55):
∴ The Relative Strength Index has remained below the 50-neutral mark for three sessions, with a confirmed downward slope and rejection from its 9-period EMA overlay;
∴ There is no sign of divergence, bullish or bearish, suggesting that price action is neither exhausted nor ready to reverse;
∴ RSI’s current position confirms momentum is negative but controlled - an environment of inertia rather than acceleration.
✴️ Conclusion: RSI confirms tactical weakness - directional force is absent, and momentum favors sellers in a low-intensity regime.
⊢
▦ Stochastic RSI (3, 3, 21, 9) - (Current: 4.32):
∴ The Stoch RSI has fallen into extreme oversold territory after failing to sustain a double-top formation near the 80-level earlier this week;
∴ The plunge occurred with speed and depth, signaling loss of buying initiative - often a precursor to passive rebounds without follow-through;
∴ Current readings near zero indicate the potential for technical retracement, but no reversal confirmation is present without RSI and MACD alignment.
✴️ Conclusion: The oscillator signals oversold status, but the context suggests any bounce would be corrective, not impulsive - a trap for premature long entries.
⊢
▦ MACD (9, 21) - (MACD: -95.69 / Signal: -129.37):
∴ MACD histogram shows initial contraction of bearish momentum, but remains submerged below the zero-line and far from a clean crossover;
∴ MACD line is attempting to turn up, but the signal line remains significantly below it, indicating lack of consensus between short and medium-term momentum;
∴ Previous fake signals from MACD in this range suggest caution divergence is visible, but -structure is weak.
✴️ Conclusion: MACD shows early signs of momentum divergence, but without structure or volume, the setup remains fragile and unconfirmed.
⊢
▦ OBV + EMA9 - (OBV: 26.69K):
∴ On-Balance Volume has entered a horizontal band with no structural incline or decline for three consecutive days;
∴ OBV's 9-period EMA is now perfectly flat, reflecting market indecision and a symmetrical distribution of volume over time;
∴ No bullish or bearish divergence is visible, indicating that volume flow is passive and non-directional.
✴️ Conclusion: OBV confirms tactical silence in the order book - structure lacks engagement, and accumulation or distribution is absent.
⊢
🜎 Strategic Insight - Technical Oracle:
∴ All indicators on the H1 chart converge toward a single message: tactical drift within a structurally neutral, low-volume regime;
∴ The EMA's are aligned downward, RSI is slipping without exhaustion, MACD offers unconfirmed divergence, and Stoch RSI is oversold without structure;
∴ This constellation presents a dangerous battlefield - one where silence reigns louder than signal;
∴ Breakouts are possible, but not probable without macro ignition.
⊢
∫ II. On-Chain Intelligence - (Source: CryptoQuant):
▦ Exchange Reserves + 9EMA - (All Exchanges):
∴ Bitcoin reserves on centralized exchanges have decreased from (~2.46M) to 2.41M Bitcoin over the past 30 days, but the decline halted on July 21st and entered a horizontal range;
∴ This plateau indicates a pause in the long-term outflow trend, suggesting that neither accumulation nor distribution is dominating;
∴ Exchange reserves are a key liquidity gauge, and flatlining implies equilibrium between withdrawal behavior and deposit pressure.
✴️ Conclusion: No liquidity threat from centralized exchange reserves - a neutral signal in an inert market.
⊢
▦ Funding Rate + 9EMA - (All Exchanges):
∴ The funding rate remains mildly positive across perpetual contracts, indicating a slight long bias - (+0.008);
∴ However, the rate is far from extremes that would signify either overleveraging or liquidation risk;
∴ Historical context shows that a funding rate near zero during price stagnation often precedes volatility expansion.
✴️ Conclusion: Cautious optimism present among derivatives traders, but not enough to drive trend - latent energy, directionless.
⊢
▦ Stablecoin Ratio + 9EMA - (All Exchanges):
∴ The ratio of stablecoins to Bitcoin on exchanges remains at all-time lows, signaling an environment with reduced buying power;
∴ This lack of fresh capital severely limits the capacity for breakout rallies, especially when combined with poor volume and flat OBV;
∴ No stablecoin inflows = no fuel for upward movement.
✴️ Conclusion: The market is liquidity-starved - stablecoin ratio confirms lack of bullish firepower.
⊢
▦ Realized Cap + 9EMA:
∴ Realized Cap has surpassed the $1 trillion mark for the first time, suggesting robust conviction among holders and long-term participants;
∴ This metric rises only when coins move at a profit, indicating that active participants are not capitulating but rather holding or consolidating;
∴ The Realized Cap trajectory diverges from flat spot price - an arcane sign of underlying strength.
✴️ Conclusion: Structural confidence remains intact at the macro level - price inertia belies silent conviction.
⊢
🜎 Strategic Insight - On-Chain Oracle:
∴ On-chain metrics whisper stability;
∴ No excessive optimism, no panic, just a dry and frozen battlefield;
∴ Exchange reserves are flat, stablecoin ratio is weak, but Realized Cap shows unwavering belief; ∴ If the market breaks, it will be macro-induced - not on-chain triggered.
⊢
✴️ Codicillus Silentii - Strategic Note:
∴ The gatekeepers are at the threshold:
Jerome Powell’s speech: July 25;
U.S. GDP Q2 (Preliminary): July 26.
∴ Both are macro-keystones that will either ignite movement or deepen compression. The tape is silent because the world awaits signal.
⊢
𓂀 Stoic-Structural Interpretation:
▦ Structurally Neutral - Tactically Bearish Drift.
∴ EMA's aligned downward, RSI below midline, OBV stagnant - no strength, no collapse;
∴ Bearish drift, but no conviction.
▦ Tactical Range Caution:
∴ Support: $117.400 - (lower Bollinger limit);
∴ Resistance: $118.900 - (EMA cluster + BB midline).
✴️ Final Seal: Bitcoin rests under the veil of compression. Eyes turn to Powell. Silence prepares the break.
⊢
✴️ Final Codex Interpretation:
∴ The chart speaks not in fire nor fury - but in breathless tension:
Each line, curved and silent, awaits the tremor of a greater voice;
The market is not weak - it is listening. And what it hears may not be price, but power.
∴ The candles drift beneath their own gravity:
The EMA's now form a declining constellation, dimming the tactical skies;
No reversal, no collapse - only weightless time.
∴ Volume is not a storm. It is absence:
And absence in markets is not peace - it is preparation.
∴ On-chain, conviction stands with sealed lips:
Reserves unmoved, stablecoins withdrawn, but Realized Cap ascends - as if the soul of Bitcoin advances, while the flesh waits behind.
∴ And above all - the macro sphere:
Two seals remain locked: Powell’s speech and GDP;
One whispers interest rates. The other shouts reality.
⊢
✶ This is not a trend. It is a pause in fate;
✶ This is not weakness. It is breath before the chant.
⊢
✴️ Conclusion Codex Interpretation:
∴ Bitcoin is in deliberate suspension - structurally stoic, tactically inert;
∴ A sovereign asset waiting not for buyers, but for context;
∴ The gate opens July 25th. Until then: silence reigns.
⊢
⧉
· Cryptorvm Dominvs · MAGISTER ARCANVM · Vox Primordialis ·
⚜️ ⌬ - Silence precedes the next force. Structure is sacred - ⌬ ⚜️
⧉
⊢
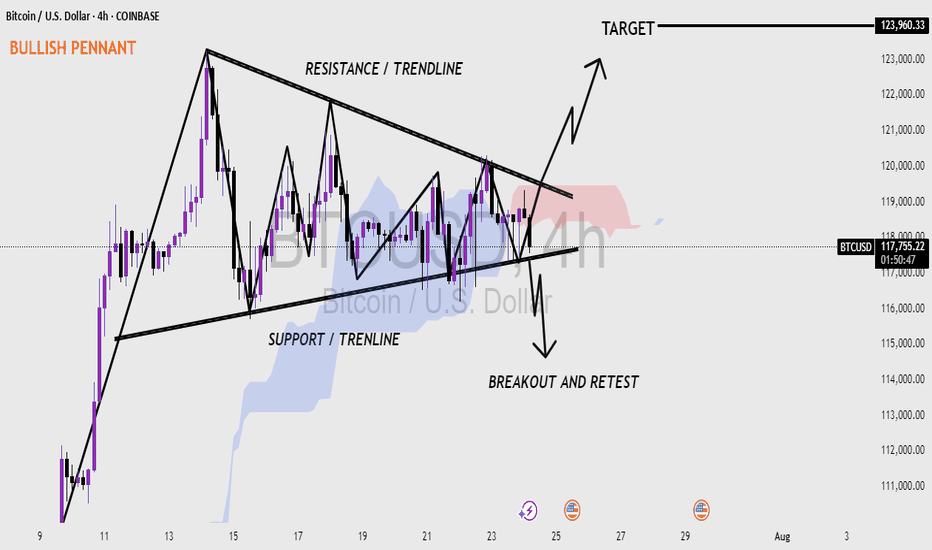
Bitcoin (BTC/USD) 4H CHART - BULLISH PENNANT PATTERN 📊 Bitcoin (BTC/USD) 4-Hour Chart – Bullish Pennant Formation
Bitcoin (BTC) forming a bullish pennant pattern on the 4-hour timeframe.
A bullish pennant often appears after a strong upward move, followed by a period of consolidation, and usually signals a continuation to the upside.
🔍 Key Highlights:
Pattern: Bullish Pennant – a continuation pattern that forms after a strong rally (flagpole), followed by a tightening price range.
Resistance Trendline: The upper black line showing lower highs — where price has repeatedly faced selling pressure.
Support Trendline: The lower black line showing higher lows — where buyers have been stepping in.
Breakout Zone: Price is nearing the apex of the pennant. A breakout above the resistance line would likely confirm the bullish move.
Target Projection: If the breakout is successful, the target is around $123,960, based on the height of the flagpole.
Breakout and Retest: The chart also shows a possible retest of the trendline after breakout, which is common and can offer a second entry point for traders.
Volume Watch: A valid breakout usually comes with increased volume. Monitoring this can help confirm the move.
📉 Downside Possibility:
If the price fails to break out and falls below the support trendline, it could invalidate the pattern and lead to a bearish move — possibly retesting the $110,000 area.
---
The market is at a decision point. If BTC breaks above the resistance and retests successfully, it could push toward $123K. However, traders should watch for both breakout confirmation and false moves.
Use Base-Anchored Fibonacci Retracement Formula🔹 Step 1: Base-Anchored Fibonacci Retracement Formula
🧮 Retracementₓ = Base + (Range × x)
Inputs:
• 🟢 Base = $74,458.42
• 🔴 High = $112,006.33
• 📏 Range = $112,006.33 − $74,458.42 = $37,547.91
📐 BTC Retracement Levels (Upward from Base)
1️⃣ Fib 0.236
= 74,458.42 + (37,547.91 × 0.236)
= 74,458.42 + 8,862.92
= $83,321.34
2️⃣ Fib 0.382
= 74,458.42 + (37,547.91 × 0.382)
= 74,458.42 + 14,362.66
= $88,821.08
3️⃣ Fib 0.500
= 74,458.42 + (37,547.91 × 0.500)
= 74,458.42 + 18,773.96
= $93,232.38
4️⃣ Fib 0.618
= 74,458.42 + (37,547.91 × 0.618)
= 74,458.42 + 23,285.25
= $97,643.67
5️⃣ Fib 0.786
= 74,458.42 + (37,547.91 × 0.786)
= 74,458.42 + 29,597.78
= $104,056.20
6️⃣ Fib 1.000
= 74,458.42 + 37,547.91
= $112,006.33
🚀 BTC Extension Levels (Beyond High)
📈 Extensionₓ = High + (Range × x)
1️⃣ Fib 1.618
= 112,006.33 + (37,547.91 × 0.618)
= 112,006.33 + 23,285.25
= $135,291.58
2️⃣ Fib 2.618
= 112,006.33 + (37,547.91 × 1.618)
= 112,006.33 + 60,767.17
= $172,773.50
3️⃣ Fib 3.618
= 112,006.33 + (37,547.91 × 2.618)
= 112,006.33 + 98,249.08
= $210,255.41
📊 Final BTC Levels
🎯 Target 🧭 Fib Level 💰 Price
TP1 0.236 $83,321.34
TP2 0.382 $88,821.08
TP3 0.500 $93,232.38
TP4 (High) 1.000 $112,006.33
TP5 1.618 $135,291.58
EXT2 2.618 $172,773.50
EXT3 3.618 $210,255.41
BTCUSDT pauses before the next big moveAfter a strong breakout in early July, BTCUSDT is now consolidating within a clear range between 116,000 and 120,000 USD. The price has repeatedly bounced from the bottom and faced rejection at the top, forming a well-defined sideways pattern on the H4 chart.
The EMA34 and EMA89 are providing solid support to this accumulation phase. If the 116,000 support zone holds and volume confirms, Bitcoin could resume its previous uptrend and aim for the 124,000 level.
At the moment, this looks like a “breather” zone before the market picks its next direction.
Personally, I’m still expecting another bullish leg—how about you?
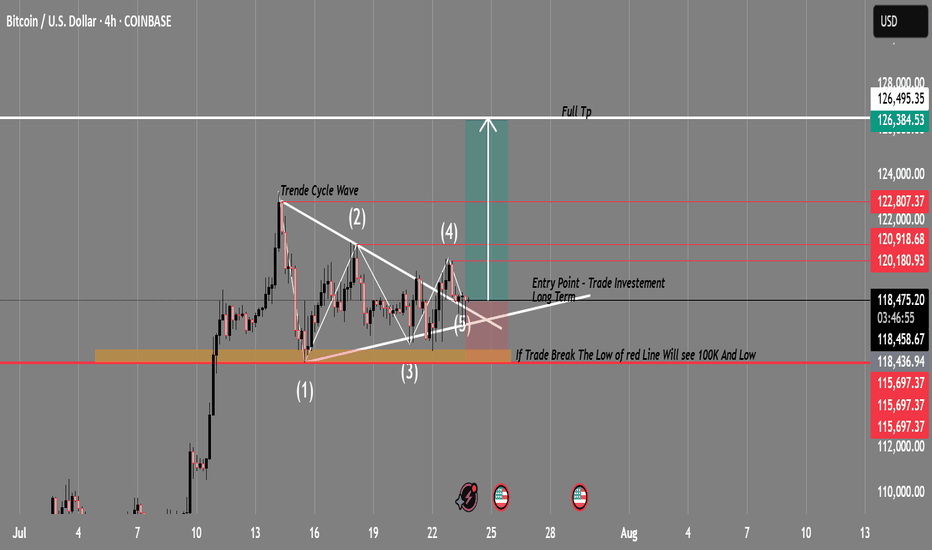
BTC/USD Swing Trade Setup | Breakout Imminent?Timeframe: 4H
Exchange: Coinbase
Strategy: Triangle Breakout + Wave Cycle Analysis
🔍 Technical Overview:
BTC is currently compressing within a symmetrical triangle pattern after completing a 5-wave cycle, suggesting a potential breakout is near. This structure indicates indecision — but also builds up momentum for a major move.
🔹 Wave Analysis: Complete cycle (1-5) within triangle
🔹 Support Zone: 115,697 (critical level — demand zone)
🔹 Resistance Breakout Target: 127,594 (measured move from triangle breakout)
🔹 Entry Point: Confirmed breakout above the triangle resistance (~118,500)
🔹 Invalidation: Strong 4H close below 115,697 = setup invalid
🔹 Risk/Reward: Favorable — breakout above resistance could trigger a strong bullish wave
🟢 Bullish Plan:
Entry: Break + Retest of upper trendline (~118,500)
Stop Loss: Below 115,697
Target 1: 122,800
Target 2: 126,384
Full TP: 127,594
🔴 Bearish Warning:
⚠️ “If price breaks the red support zone (115,697), BTC could drop sharply — possibly toward the 100K level and beyond.”
— a key invalidation level to monitor closely.
🧠 Conclusion:
This is a classic consolidation-to-breakout setup. Monitor volume and breakout confirmation before entering. If bullish momentum holds, this swing trade has great long-term potential.
💬 What do you think? Will BTC break bullish or drop to 100K? Drop your thoughts 👇
📌 Follow for real-time updates and future chart ideas!

