BTCUSD bigshortBitcoin could technically fall. Demand has increased significantly due to regulatory requirements. This surge in participants is temporary and should level off over the next 3 months.
BTCETH.P trade ideas
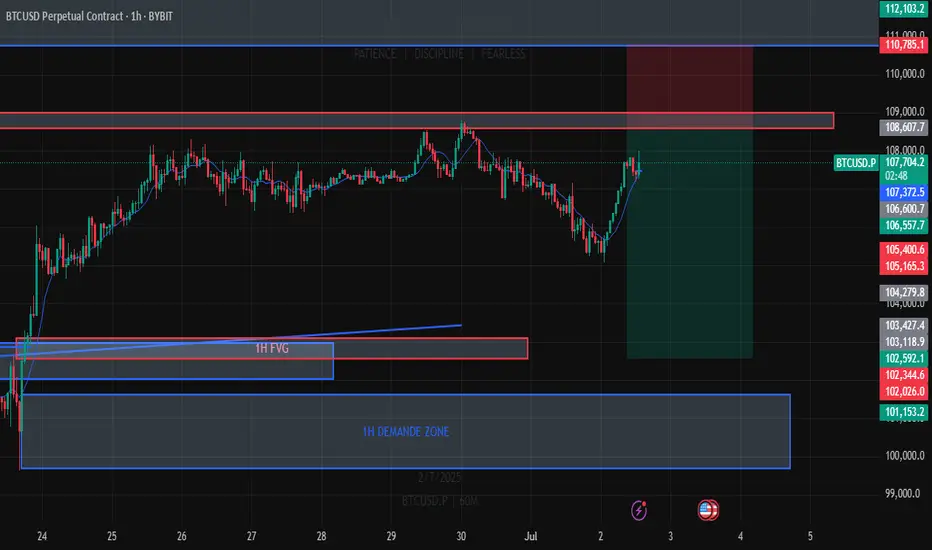
BitcoinBitcoin has fallen below the support area, resulting in the expected quick decline. The price is currently testing the resistance area and must reclaim this level; otherwise, we may see downward movement again. The key level to reclaim is between $106,800 and $107,000.
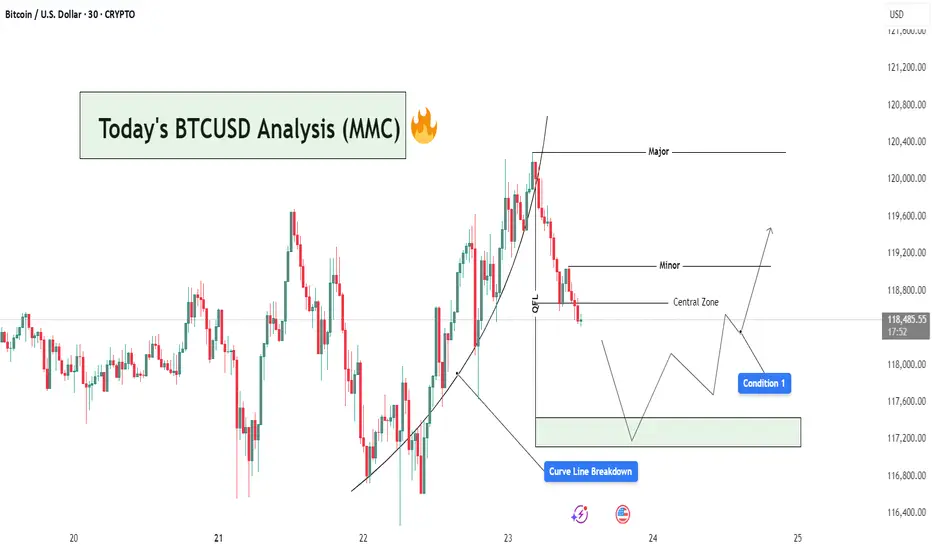
BTCUSD Analysis : Curve Line Breaked and Move Towards Target📊 Market Overview:
BTCUSD has recently completed a strong bullish leg, following a parabolic curve formation that led price into a Major Resistance Zone near the $120,400 level. This rally aligns with MMC principles where price forms momentum-driven structures before reaching high-liquidity zones (often ending in exhaustion).
📍 1. Curve Line Support & Breakdown – A Shift in Sentiment
Your chart shows a clear Curve Line that supported the bullish impulse. Price respected this dynamic support throughout the uptrend until a Curve Line Breakdown occurred—marking the first sign of bullish weakness.
In MMC strategy, this curve structure breakdown is critical:
It tells us the accumulation → expansion → exhaustion cycle is ending.
The market is likely entering retracement or distribution phase.
Price often seeks lower equilibrium, typically around the Central Zone.
🧠 2. QFL Zone (Quick Flip Level) – The Hidden Base
Immediately after the curve broke, price moved toward the QFL level, which represents a demand base from earlier structure. This zone acts as a short-term support and often produces a reactive bounce (but not always a reversal).
Watch closely:
If price respects this zone → temporary relief bounce
If it fails → we’ll likely see full test of Central Zone or lower demand levels
🟩 3. Central Zone – The MMC Decision Area
The Central Zone is a key horizontal level on your chart, defined between ~$117,300 and ~$118,200. This zone is marked based on:
Previous structure
Volume clusters
Demand imbalance
Why is this zone important?
It serves as the balance point between buyers and sellers.
A bullish reaction here could re-initiate a move toward Minor Resistance (~$119,200).
A failure to hold could open the door for deeper retracement toward the green demand box (~$117,200 or below).
🔄 4. Two Primary MMC-Based Conditions to Watch:
✅ Condition 1: Bounce from Central Zone
Price reacts from within the Central Zone
Forms bullish structure (double bottom, bullish engulfing, or reversal wick)
Short-term target becomes Minor Resistance (~$119,200)
If volume increases and price breaks above Minor, continuation toward Major is possible
❌ Condition 2: Breakdown & Bearish Continuation
Price fails to hold within Central Zone
Bearish structure forms (e.g. lower highs, breakdown candles)
Clean move expected toward next liquidity pocket at $117,200–$116,800
This would confirm market shifting into bearish control
📌 5. Minor vs Major Levels – Key Zones
Minor Resistance (~$119,200): Short-term target if bounce occurs
Major Resistance (~$120,400): Liquidity sweep zone, strong supply
Green Demand Box (~$117,200): If Central Zone fails, this becomes next bounce zone
📘 Final Thoughts:
This is a classic MMC setup in real-time:
Curve Formed → Broke
OFL + Central Zone → Now being tested
Next move depends on confirmation from buyers or sellers at Central Zone
Don’t trade emotionally — let price action give you confirmation before taking any positions. Watch the Central Zone behavior closely and manage risk based on scenario outcomes.
Price is approaching the bottom of the rangeAs mentioned in our previous analysis, the price had reached the top of the range. At that stage, we had two options: wait for a confirmed breakout to the upside, or take a reactive position anticipating a move toward the bottom. Now, we are seeing price action moving toward the lower boundary of the range.

Btcusdt techinical analysis.Btcusdt techinical analysis next move posibale at h1 time frame.not finchinal advice.

Bitcoin H4 | Crypto to remain elevated?Bitcoin (BTC/USD) is falling towards a multi-swing-low support and could potentially bounce off this level to climb higher.
Buy entry is at 116,242.45 which is a multi-swing-low support.
Stop loss is at 111,600.00 which is a level that lies underneath a pullback support.
Take profit is at 122,734.70 which is a swing-high resistance.
High Risk Investment Warning
Trading Forex/CFDs on margin carries a high level of risk and may not be suitable for all investors. Leverage can work against you.
Stratos Markets Limited (tradu.com ):
CFDs are complex instruments and come with a high risk of losing money rapidly due to leverage. 66% of retail investor accounts lose money when trading CFDs with this provider. You should consider whether you understand how CFDs work and whether you can afford to take the high risk of losing your money.
Stratos Europe Ltd (tradu.com ):
CFDs are complex instruments and come with a high risk of losing money rapidly due to leverage. 66% of retail investor accounts lose money when trading CFDs with this provider. You should consider whether you understand how CFDs work and whether you can afford to take the high risk of losing your money.
Stratos Global LLC (tradu.com ):
Losses can exceed deposits.
Please be advised that the information presented on TradingView is provided to Tradu (‘Company’, ‘we’) by a third-party provider (‘TFA Global Pte Ltd’). Please be reminded that you are solely responsible for the trading decisions on your account. There is a very high degree of risk involved in trading. Any information and/or content is intended entirely for research, educational and informational purposes only and does not constitute investment or consultation advice or investment strategy. The information is not tailored to the investment needs of any specific person and therefore does not involve a consideration of any of the investment objectives, financial situation or needs of any viewer that may receive it. Kindly also note that past performance is not a reliable indicator of future results. Actual results may differ materially from those anticipated in forward-looking or past performance statements. We assume no liability as to the accuracy or completeness of any of the information and/or content provided herein and the Company cannot be held responsible for any omission, mistake nor for any loss or damage including without limitation to any loss of profit which may arise from reliance on any information supplied by TFA Global Pte Ltd.
The speaker(s) is neither an employee, agent nor representative of Tradu and is therefore acting independently. The opinions given are their own, constitute general market commentary, and do not constitute the opinion or advice of Tradu or any form of personal or investment advice. Tradu neither endorses nor guarantees offerings of third-party speakers, nor is Tradu responsible for the content, veracity or opinions of third-party speakers, presenters or participants.

StairsteppingBitcoin ready for another breakout. If this is anything like previous cycles, likely see a 3-4 month uptrend that goes parabolic and off this screen.
Macro + regulatory tailwinds
BTC SHORTAs expected the high was taken out.
I just took a low-probability sell on $BTC.
Join me if you can
➡️stop loss- 121,111.81
➡️enter now.
➡️manage your risk.

BTCUSDBUY Call retest must
Quick trade setup 30min
Risk free your trade once reach point metioned
Looks bullish move

A quick update on BYCThe correction turned a littl complex but I still seing the same structure
Levels in the chart
GG

Wind up before the big pitch!The longer we coil here, the more vicious the move up will be. Put your tray tables in the upright position and prepare for takeoff...

BTCStill range bound but the breakout is inevitable
Imho these are BTC last big moves.
And we get to do it all over again

Bitcoin profit booking at this Price level 119675 Bitcoin is making higher high and giving flag fathernow in a range bound zone due to profit booking and and Here we may take a short trade sell 119500, sl-121800, tgt 1108500, 99500🚩🚩

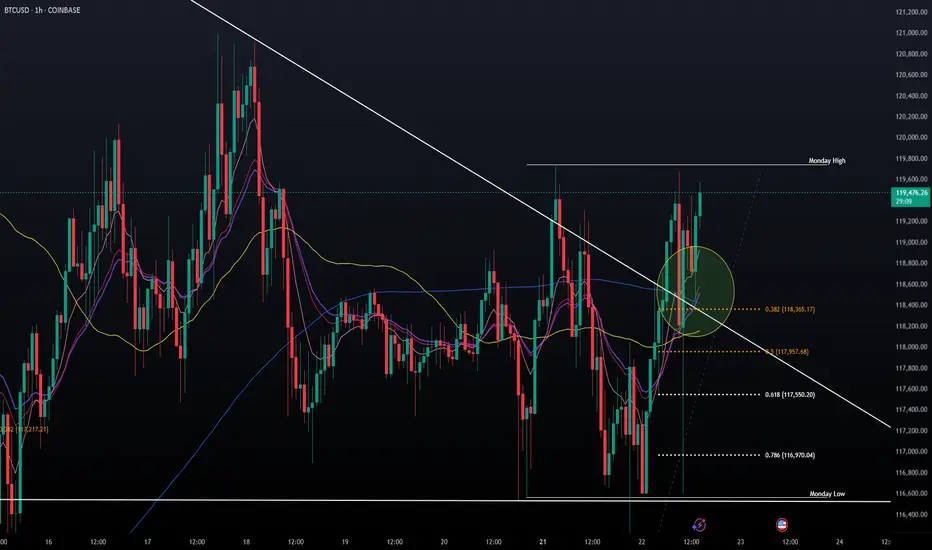
Confluent Factors much? Trending, Above EMA: 9,18,21 (angled up) + Above MA: 50,200 + Fib .382, Horizontal Support, Diagonal Support with triangle 70% completed. Was/is a great re-test to buy for the short term acct.
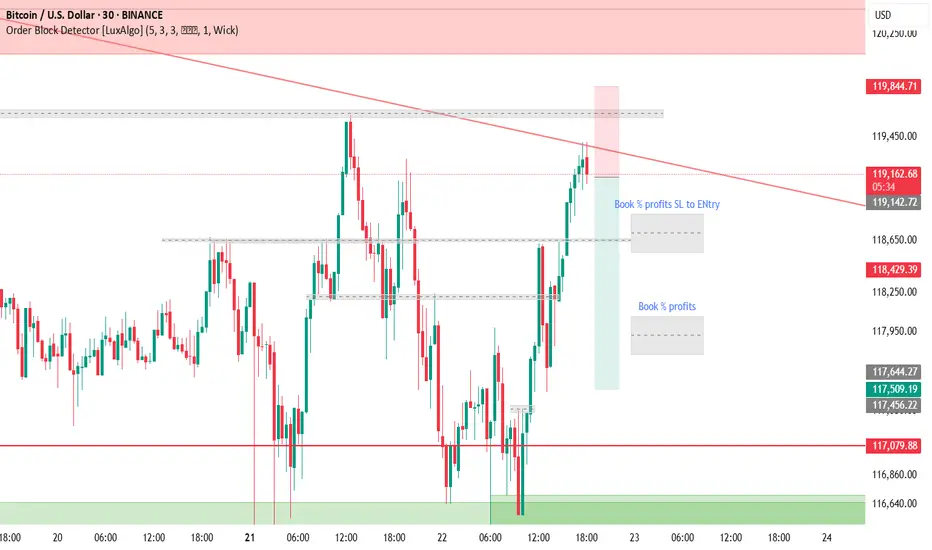
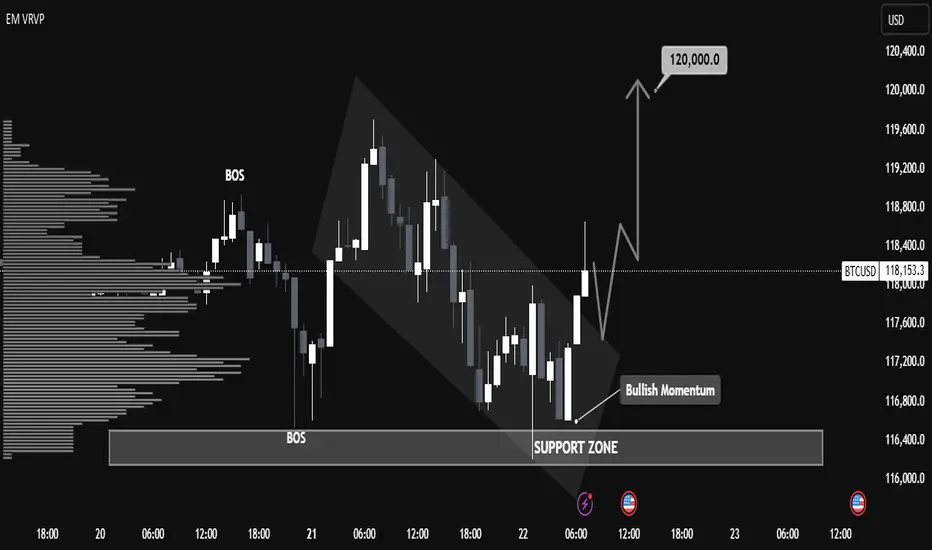
"BTC/USD Breakout Strategy: Identifying Bullish Momentum BTC/USD Technical Analysis – July 22, 2025
📈 Market Structure Overview:
The chart illustrates a recent Break of Structure (BOS) both to the upside and downside, indicating volatility and a shift in market sentiment. The price action formed a descending channel, followed by a breakout with strong bullish candles, suggesting a momentum reversal.
🧱 Support Zone (Demand Area):
Key Level: $116,400 – $116,900
This zone has acted as a strong demand level, with clear evidence of buying pressure pushing BTC higher after testing this area. The volume profile (VRVP) supports this, showing heightened trading activity at this price.
🔄 Bullish Breakout Confirmation:
A bullish breakout from the descending channel occurred just above the support zone, aligning with the label "Bullish Momentum".
The breakout candle has closed above minor resistance, which increases the probability of a trend reversal.
📍 Price Target:
The projection points toward $120,000, aligning with previous resistance and psychological round-number resistance.
This target is highlighted by an expected bullish leg after a possible retest of the breakout zone around $117,500 – $117,800.
🧭 Key Levels to Watch:
Support: $116,400 – $116,900
Retest Zone (Buy Opportunity): $117,500 – $117,800
Immediate Resistance: $118,400
Major Resistance / Target: $120,000
📊 Summary:
BTC/USD has shown a bullish reversal signal from a well-respected support zone after a descending correction phase. The current price structure, volume buildup, and breakout momentum suggest a high probability of continued upside movement toward the $120,000 mark. A successful retest of the breakout zone would provide a strategic entry for long positions with tight risk management.
BTCUSD RECAPBITCOIN has preformed as expected in short period of time can continue even more to the up side but will wait for good entries

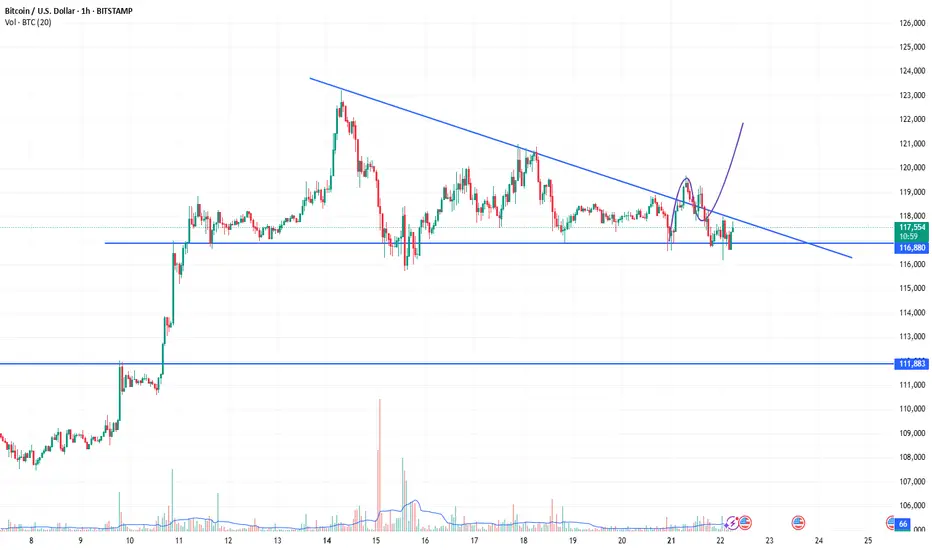
Bitcoin – Breakout Coming, But May Be a TrapBitcoin is trading within a well-defined bullish pennant structure on the 1H chart, with clear compression between a rising support and descending resistance. This pattern typically signals a continuation of the prior trend, but given the surrounding liquidity and recent FVG formation, the setup looks more nuanced. After a liquidity sweep earlier this session, price has rebounded and is currently respecting a newly formed 1H fair value gap within the pennant range.
Pennant Structure and Price Reaction
The consolidation is tight and clean, with buyers stepping in off the ascending trendline support. This area overlaps with a small FVG that has so far held as intraday support, suggesting active demand. Until this gap is violated, the structure remains intact and favors a breakout play to the upside. However, with a larger unmitigated FVG sitting just under 121,000 and a previous swing high forming a strong liquidity pool, the upside might be limited.
Buy Side Liquidity and Reversal Area
If price can push above the descending trendline, the next logical target is the buy side liquidity sitting around 120,800 to 121,200. That zone is also where sellers may step in, given it aligns with prior inefficiency and a probable stop hunt level. This makes it a high-probability reversal area. I expect price to take out that buy side before we get a meaningful shift lower again.
Displacement and FVG Reactions
Any clean displacement toward the upside, particularly into the 121k range, will be key to watch for rejection signs. Should we see rejection or an SFP at the liquidity zone, that would likely confirm the short-term top. At that point, I’d expect a return into the pennant or even a sweep of the trendline support again, setting up a deeper retracement.
Short-Term Expectations
In the immediate term, as long as price holds above the current FVG and trendline confluence, I expect Bitcoin to slowly grind higher and break out of the pennant. The objective is the liquidity above 120,800. Once that’s taken, I’ll be watching closely for signs of exhaustion or reversal patterns to get positioned short again.
Conclusion
Bitcoin is compressing within a bullish pennant and currently holding a fair value gap, suggesting bullish continuation in the short term. However, the real play may come after a sweep of the buy side liquidity near 121k, where I expect a bearish rejection and opportunity for downside positioning. The market structure remains neutral to bullish until that liquidity is tagged.
Disclosure: I am part of Trade Nation's Influencer program and receive a monthly fee for using their TradingView charts in my analysis.
___________________________________
Thanks for your support!
If you found this idea helpful or learned something new, drop a like 👍 and leave a comment, I’d love to hear your thoughts! 🚀

What do we need to know before investing?If you are thinking about investing money for the potential returns it offers, you should know that it may go well, but that there are always risks. That’s why we are going to give you some basic tips to bear in mind before making any investment decision.
How much money are you going to invest?
First of all, you need to decide how much money you want to put towards your financial investments.
The markets are subject to change
The financial markets are constantly fluctuating. The term volatility is the most commonused term to describe and measure the uncertainty provided by changes to theprices of financial assets.
Additionally, there are times in the market when the prices are more pronounced and every now and then there are crisis periods and asset prices fall dramatically.
Investing in financial markets means that we have to assume that our investments will always be subject to these types of fluctuations. If you are going to invest in the financial markets the money that you invest must be money that you will not need during the investment term.
That’s why, investing in order to obtain short term gains is inevitably associated with high risk. Furthermore, the larger our intended gains, the larger the associated risk. Always bear in mind that the greater the expected returns, the greater the assumed risk. Once again, be sure that you do not need the money that you are going to invest, as it may have losses.
The opposite can be said of long term investments, where the capacity to wait and overcome falls in the market means that you can assume more risk with your investments. With a long term vision you will avoid having to experience any possible losses with your investment period due to any eventual liquidity needs.
How much risk are you willing to take on?
Before investing it is important to know the risk you can assume. Every investor has their own risk tolerance level that they need to be aware of. Risks and returns go hand in hand, because for more returns you also need to take on more risk, and vice versa.
It is also good to know that just as with normal market conditions, those assets with a higher risk tend to suffer more fluctuations with their prices than those assets with less risk.
Therefore, in general terms:
When the forecasts for the financial markets are favourable and the market goes up, those assets with higher expected returns generally perform excellently.
Whenever the financial markets are going through uncertain times, those assets with higher expected returns, and therefore more risk, tend to perform worse.
You must start from a strong financial position
To invest you need to be at a point where your accounts are well under control, including your debts. We do not mean to say that if you have any outstanding credit you cannot invest, but it is essential that everything is in order and that you are in a situation where you can fulfil your financial obligations.
On the other hand, to build long term wealth, it is important that you assign part of your income to your savings, meaning that you have to invest with the money left over after making your payments while also saving part of what you earn.
It is important to keep a composed outlook
Now we know that investing bears its own risks and that the market is subject to change, it is essential to be composed when investing. When investing it is important to think positively, as if you don’t really believe that things will work out, why invest?
It is one thing to be cautious, and to know how much money to invest and what level of risk tolerance to assume, and another to think negatively each time there is a drop in the market. In reality, investing is a combination of caution and composure.
Diversification is the key to success
Somebody with less investment experience may make the mistake of putting all of their investment budget into just one thing. However, it is much better to have diverse investments, as while some investments may not quite work out as you would have liked them to, some do even better.
Losses are normal, and so are returns
We previously said that when investing it is important to stay calm, and that is true. In this regard, you also have to bear in mind that it is normal for some investments in your portfolio to not perform as well as you had expected.
We cannot predict the behaviour of the financial markets or of certain assets. We can also unexpectedly find ourselves with some assets that don’t perform as well as we had hoped. That is why we recommend, in addition to not risking more than you can invest, to diversify your investments well.
We have already said that investment involves risk, which is why it is good to know that if you are willing to invest, you are also willing to take on risks. If you are prepared to take on this risk, you can be successful in your investments.
Did you like it? Share with your friends
by HollyMontt
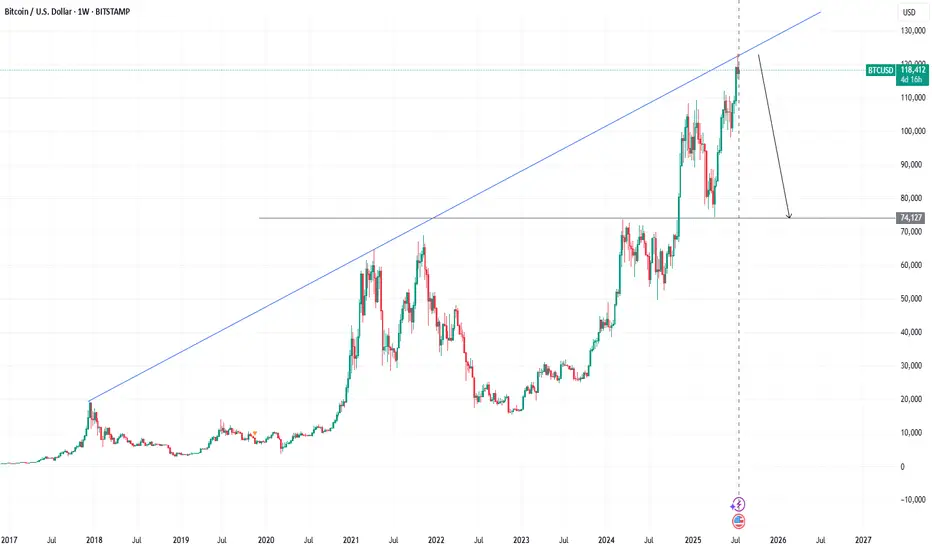
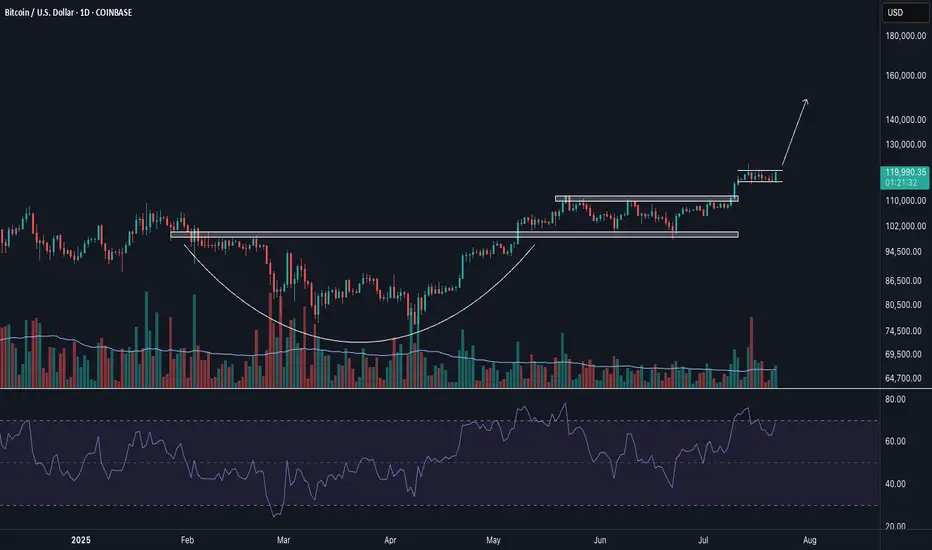
BTC/USD – Bullish Pennant Hints at Potential Continuation >$120KBitcoin remains in a strong uptrend, consolidating just below the $120,000 level after a powerful breakout from the $112K zone earlier this month. Price action has formed a classic bullish pennant pattern on the daily chart, characterized by converging trendlines and declining volume—a textbook setup for trend continuation.
The uptrend remains technically intact, with BTC well above its 50-day SMA ($108.7K) and 200-day SMA ($94.8K), both of which are rising and supportive of bullish momentum. The RSI at 63.2 reflects healthy, but not overbought, conditions, while the MACD maintains a positive crossover above the zero line, though it has started to flatten during the consolidation.
A breakout above the pennant resistance (~$119K) could trigger the next leg higher, potentially targeting a measured move toward the $128K–130K area. However, if sellers manage to push price below the lower pennant boundary and horizontal support at $112K, a deeper correction toward $100K cannot be ruled out.
Bias: Bullish continuation favored as long as price holds above $112K. Watch for a breakout to confirm upside momentum toward new highs.
Time frame: Medium-term (days to a few weeks)
-MW

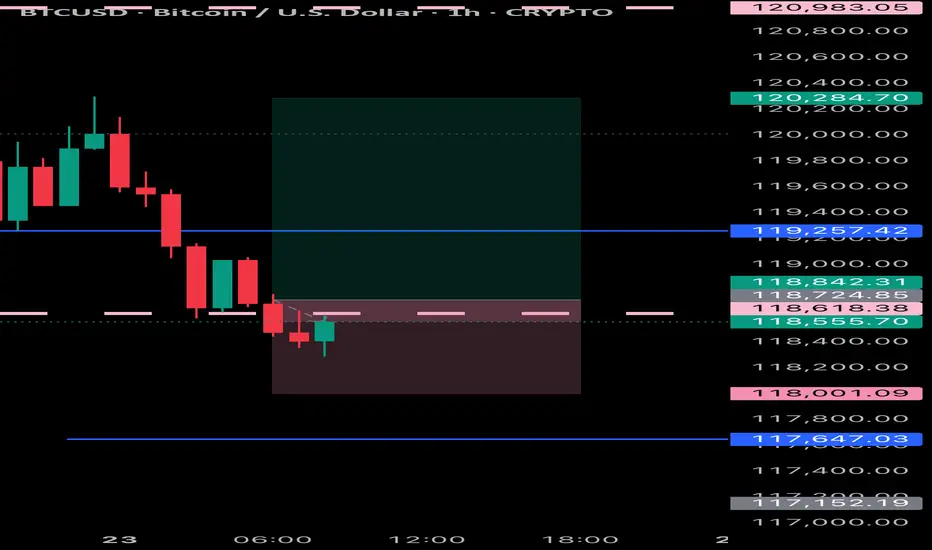
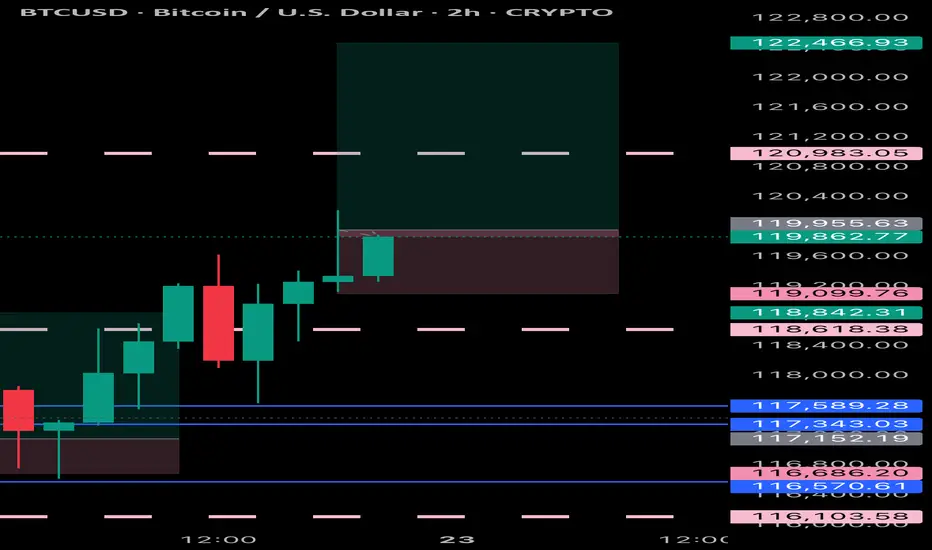
Btcusd:Huge trading opportunities and ideasBTCUSD's rebound after touching the position near 116180 this time is fast. From the trend observation. BTCUSD is still in a high consolidation stage. It has not broken the oscillation range for the time being. It can maintain selling near 120k. Buying near 11600 for range trading. It is expected that there will not be many trading opportunities in the London market. It will take until the New York market opens to see better trading opportunities.