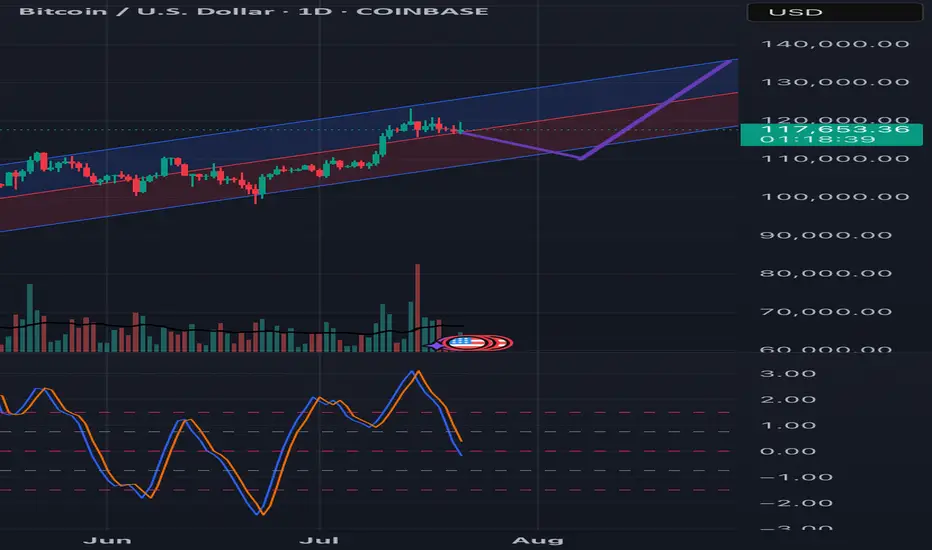
Healthy BTC Retrace in Trend Next Breakout Target 112K Then 122KBitcoin continues to respect the bullish market highlighted in our previous analysis, where the AB=CD structure pointed toward significant upside potential. The market has since retraced into a well defined re-accumulation zone, aligning precisely with prior expectations.
Price has held firmly above the round figure support ($100k), with the current structure confirming a healthy correction within trend.
As long as the re-accumulation zone between 104k–107k holds, momentum remains skewed to the upside. The projected 2.618 extension sits near the 122k mark, where the current setup aims to complete.
The broader structure still respects higher timeframe demand and ascending channel boundaries, keeping bullish continuation valid unless 100k decisively breaks. Watch for confirmation breakout above 112k to activate the next leg of the move.
If you found this analysis insightful, drop a like to support the work and leave a comment with your perspective whether you agree, disagree, or have an alternate scenario in mind. Let's grow together through collective insights.
BTCETH.P trade ideas

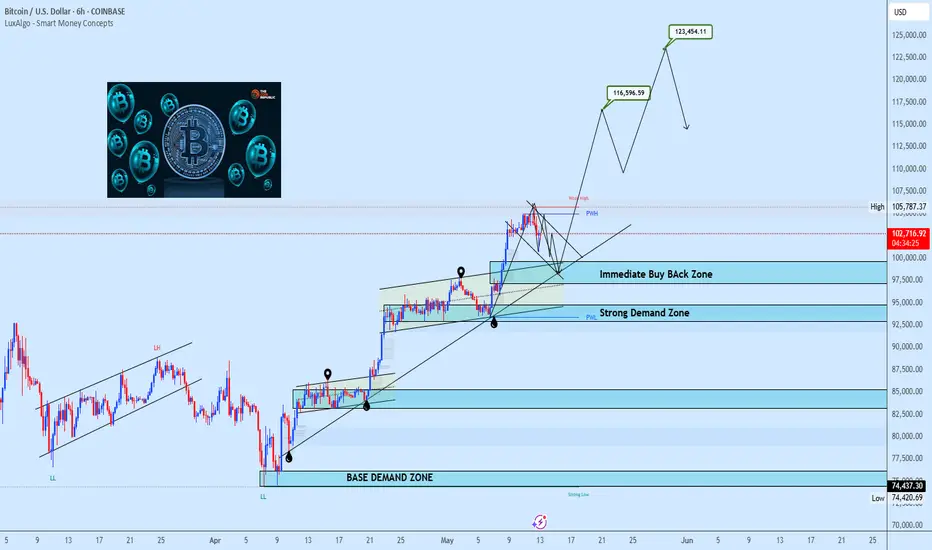
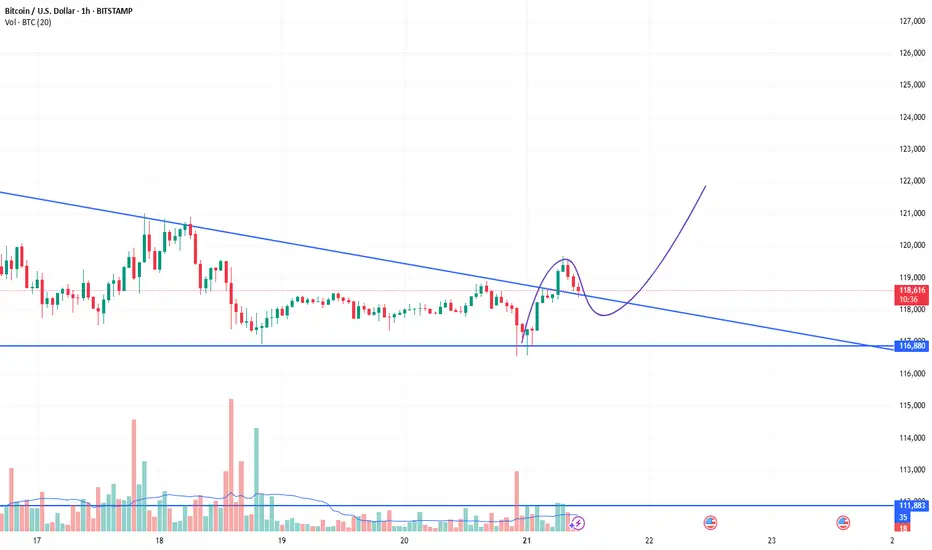
BTC Bulls Defend Key Zone Eyes on $123K Breakout ExtensionBitcoin has successfully completed a breakout above the prior weekly high structure, followed by a healthy pullback which is currently unfolding into a bullish pennant formation. The key highlight is how price is retesting the neckline zone with precision, which now doubles as a strong immediate buyback zone.
The reaction from this level is already showing strong bullish momentum, with price gearing up to challenge the previous ATH. A breakout above that resistance should unlock the path toward the projected $116.5k and $123.4k targets as shown on the chart. Failure to hold the Immediate Buyback Zone opens the door toward the Strong Demand Zone, which remains a valid re-accumulation point within this bullish cycle.
Stay sharp. The structure remains intact unless the neckline fails decisively.
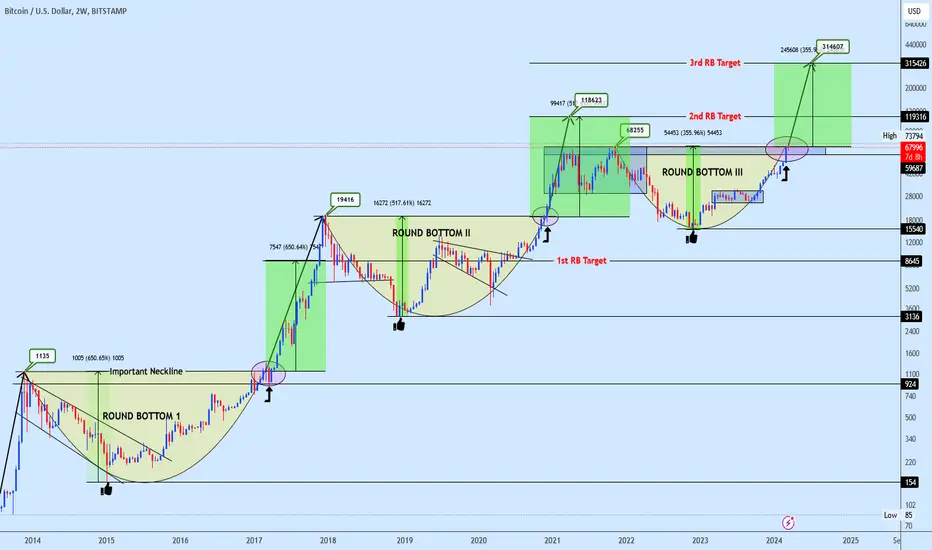
Bitcoin massive bullrun incoming!!!If historical patterns serve as a guide, we consistently observe the formation of a rounding bottom pattern on BTC preceding each bull run.
Presently, it appears we are on the brink of significant BTC movements this year. Notably, a critical support level indicated on the chart stands at 59k, extrapolated from historical data.
The target for the rounding bottom formation is distinctly delineated on the chart. This post will be continuously updated in a timely manner.
Do share your insights regarding this pattern.
BTC Long and ShortFor chart pattern, TP1 Reahced , mostly will go TP 2.Target swing high (TP 2) and Counter for swing low,after reaching TP2. What do you think guys
Bitcoin Weekend ForecastIts in the middel of wave 4 correction, impulses are tradeable
Levels Highlighted in the chart

BTCUSDThe market general trends sideways we haven't seen a major breakout to the upside or downside, so for this morning we will be favoring the upside b targeting 1:3, then we wait to see how price playout

Bitcoin’s Crossroads: Shooting Star Pressure vs. Bullish Pennantwe examine a classic battle of signals: the daily chart reveals a dominant shooting star candle—hinting at overhead resistance and possible downside risk—while the 4-hour setup unfolds a bullish pennant triangle, often a prelude to continuation moves. This presentation balances caution with opportunity, highlighting key breakout zones, invalidation points, and what traders should watch next. As Bitcoin hovers at this technical tension point, will bulls find the strength to punch through? Unfortunately bulls have been faked out and we currently have a confirmed candle open and close below the 50EMA on 4H. This confirms a strong pullback initiated by the shooting star on the daily chart to a potential target of $114k.

BTC 130 Minor pullback to regression channel bottom then attempt at HH. Bottom of daily regression channel is centerline of weekly regression. If channel support fails, 100 maybe.
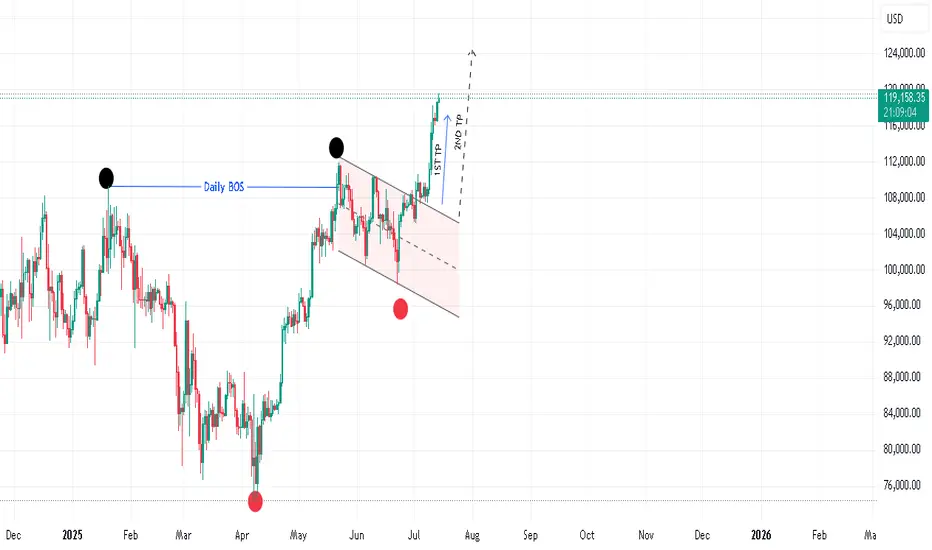
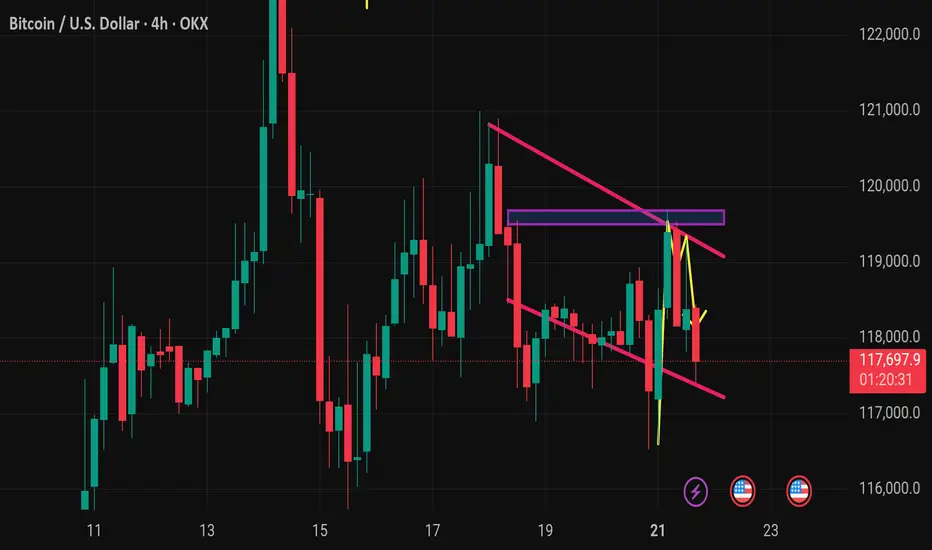
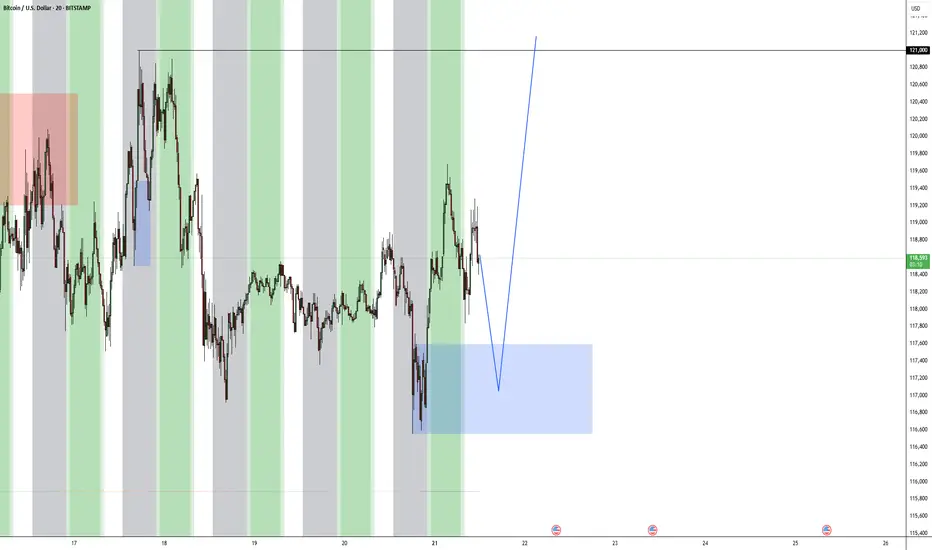
Bitcoin: Setup Builds for a Run Back Towards the HighsBitcoin is coiling within what resembles a bull pennant pattern, hinting at another bout of consolidation before the rally resumes. Trading near the lower end of the recent range, Monday’s pullback offers an appealing entry point, allowing longs to be established around current levels with a stop beneath the July 15 low for protection.
The downtrend from the record highs looms as the first hurdle, sitting around $119,700 today. A break above that level could prompt an accelerated move towards the current record high just above $123,000—an appropriate target for the trade.
Good luck!
DS

BTCUSD BULLYING Bitcoin is still respecting price and is buying can expect some nice moves (New Highs)
BTC Bottom Regression Channel RevisitFisher is head south and a breakdown to the bottom of the regression channel is likely.

BITCOIN BTC/USD PULLBACK STARTED BACK TO BUYZONE?Hey Traders so today looking at Bitcoin showing a strong Uptrend since April this year. Now showing more bullish momentum after a break above the narrow sideways channel at 112,000. Breakouts normally get retested. Also the best place to buy imo is right at the trend line.
The way I like to trade it is don't chase the market let it come to you. It takes patience but you will always get the best price for your trade if you are willing to wait. However some might disagree with this strategy and say you may miss the move because the market doesn't come back.
I say Who Cares if the market comes back or if it keeps rallying! 🤣
There is always another train at the station (anotherwords there are always other trading opportunities so if we miss one big deal we will another one. Most importantly we will find another one with the best price!
Anyway enough of my rant so if your bullish watch for that pullack to around 112,00-113,000 and put a stop loss below support at 107,500. It looks like a safe level not to get stopped out at.
However if Bearish wait for close below support at 107,500 before considering to sell a rally imo.
Good Luck & Always use Risk Management!
(Just in we are wrong in our analysis most experts recommend never to risk more than 2% of your account equity on any given trade.)
Hope This Helps Your Trading 😃
Clifford

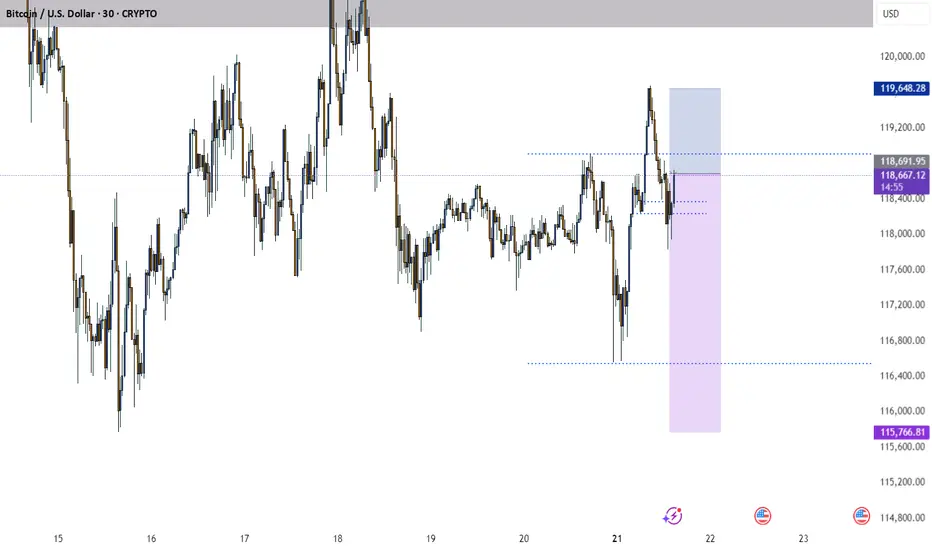
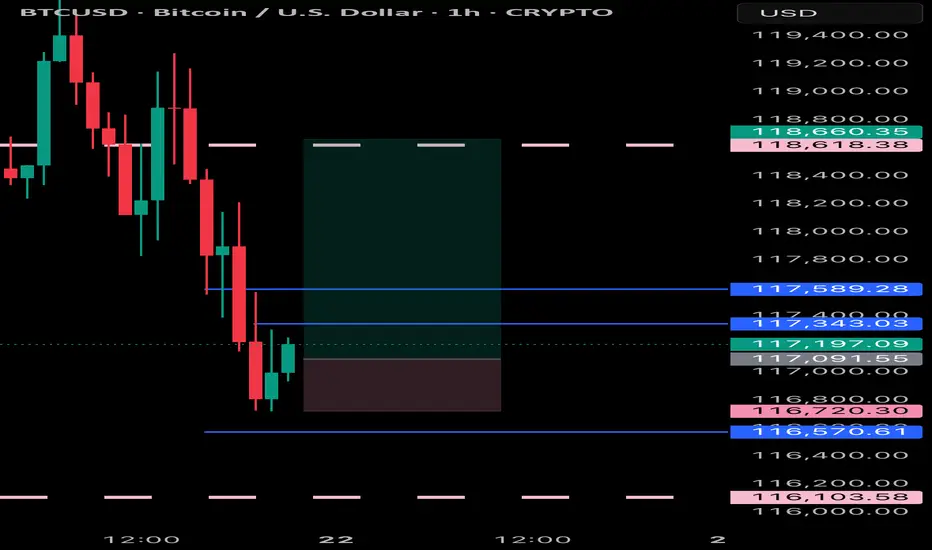
Btusdt techinical analysisThis chart shows a BTC/USD (Bitcoin to US Dollar) 30-minute time frame with a falling wedge pattern and potential bullish breakout setup. Here’s a breakdown of the key technical elements:
---
🔍 Chart Analysis Summary:
1. Pattern:
Falling wedge (highlighted by the converging pink trendlines): typically a bullish reversal pattern, especially after a downtrend.
Price has broken above the wedge, indicating a possible breakout.
2. Price Action:
BTC found strong support near $116,800.
After the breakout, the expected upward move is projected by the blue measured move box, targeting around $118,400–$118,800, a 1.36% gain (~$1,591).
3. Resistance & Target Zones:
First resistance zone: $118,400–$118,800 (wedge top and measured move target).
Next major resistance: $119,600–$120,000 area.
4. Support:
Strong support marked around $116,800 (purple zone at the bottom).
If BTC breaks below this, the bearish scenario could resume.
---
📈 Potential Trade Setup:
Bullish bias above wedge breakout.
Entry: Current level (if breakout holds).
Target: $118,400–$118,800.
Stop loss: Below $116,800 support zone.
---
Let me know if you'd like a bearish scenario, RSI/volume analysis, or a follow-up chart.

BTC Update – Short-Term Pressure Building
Bitcoin is still being pushed down below the BB center.
RSI is trending lower, and MACD is nearing a bearish crossover.
PSAR is hovering close to price, a warning sign.
This could still be a pause before the next leg up — but don’t ignore the signs.
And just a thought: Trump Media buying $2B in BTC might’ve marked a local top.
Prepare in advance.
Always take profits and manage risk.
Interaction is welcome.

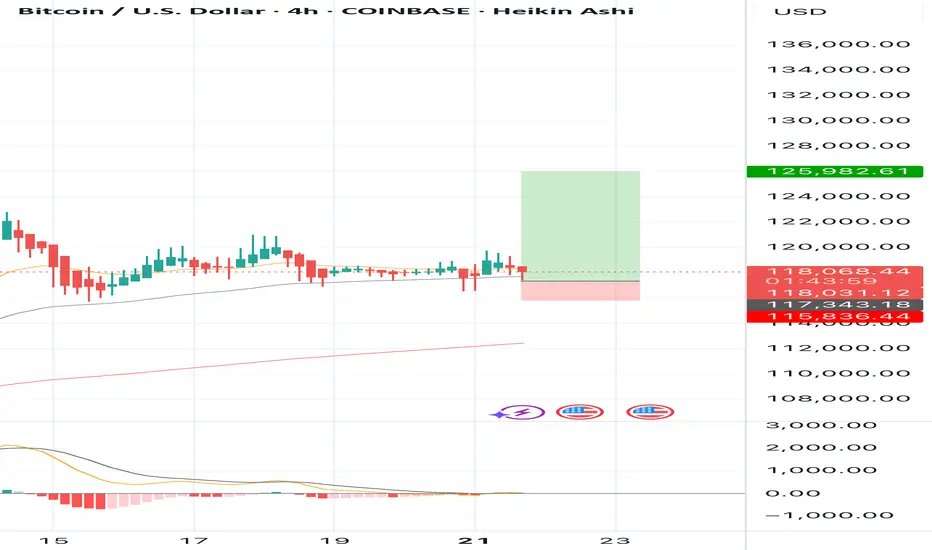
BUY BTCUSD now for 4h time frame bullish trend continuation BUY BTCUSD now for 4h time frame bullish trend continuation ...............
STOP LOSS: 115,836
This buy trade setup is based on hidden bullish divergence trend continuation trading pattern ...
Always remember, the trend is your friend, so whenever you can get a signal that the trend will continue, then good for you to be part of it
TAKE PROFIT : take profit will be when the trend comes to an end, feel from to send me a direct DM if you have any question about take profit or anything...
Remember to risk only what you are comfortable with... trading with the trend, patient and good risk management is the key to success here
vision paintingthis is sort of a game, i would like to play with anyone interested in chart riddles. i'm being very specific with my inputs, and coloring, painting a picture of what i need to see and when. painting whats there, guiding to where itll be. wondering if i could actually create art pieces here. hypothetically the 'paintings' would need to be back checked, to artificialy create any worth to it. market involvement is day/week trades. *no advice whatsoever. so, i think ill give it a go. from here onwards, these posts are the only ill post, with updates, within the comments of such post. happy trading
ballino
Second bull legI can sense a second bull leg forming right now. My last prediction was correct the market found some support from my demand zone but sadly it ripped right through it. Here is my second hope for a BTC bull run
BTCUSDBTCUSD also fell from a high level, reaching a high of around 119700, only 300 points away from the target of 120k. The price after the decline is now around 118600. Buying at a low level is the main focus. The reference buying point is 118500-118000. The target is above 120k. Stop loss 117300
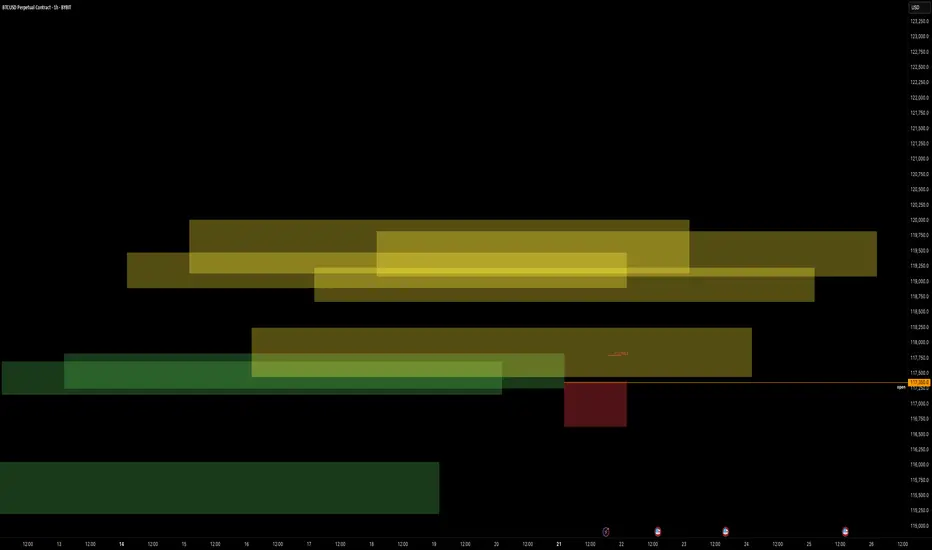
WEEKLY CLSBTC has formed a generous weekly range, I can already see a few candles closing inside of the range signaling a further downside to the 114K range where I will take most profit.
I will look for manipulation tommorow on wednesday and see if I can find more precise entries, if anything ask me in the comments and I will happily reply!
Good luck and do not over-leverage and remember be PATIENT!

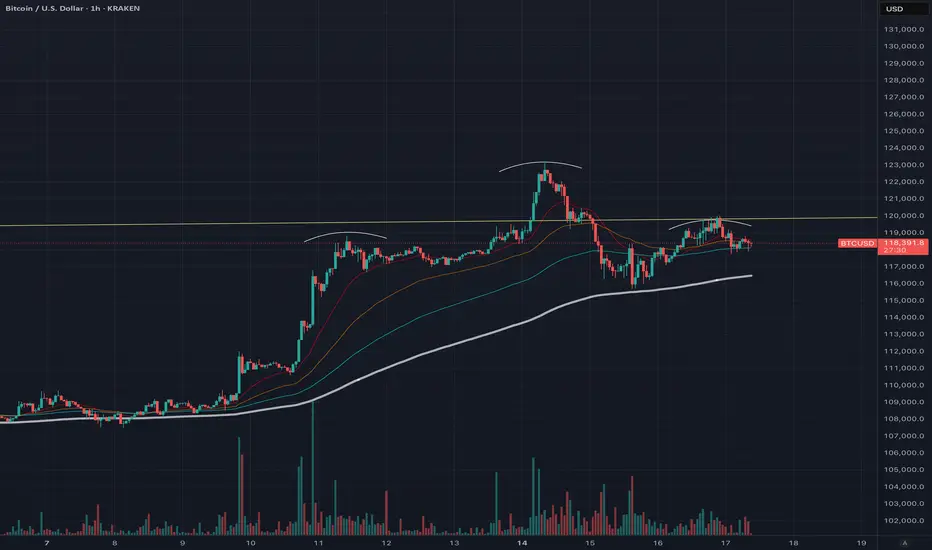
Head and shoulder pattern on hourly.
A reversal seems likely, so we should anticipate a pullback. The trading volume is decreasing while exchange volume is increasing, which suggests a potential market top based on previous trends. Greed is also on the rise. Although history doesn’t repeat itself, it certainly shows similarities. The BTC/GBP chart is indicating a double top pattern on the daily timeframe. An altcoin season may be approaching based on the ETH/BTC pair, signaling that the end of Bitcoin’s dominance could be near.
BTCUSD - BEARISH DIVERGENCE DETECTEDCAPITALCOM:BTCUSD
BTCUSD has been in a bullish trend over the past few hours and is now approaching the resistance at 119,500.00.
On the hourly chart, a bearish hammer has formed alongside a stochastic divergence, signaling potential downside.
⚡ This signal is reinforced by a strong resistance level above, adding weight to a possible pullback scenario.
📉 If BTCUSD rebounds from this level, consider Sell setups with take profit at the nearest support.
📈 If it breaks out, look for Buy opportunities on confirmation.
⚡ We use Stoch (14) to spot potential reversals when it exits overbought or oversold zones — helping you catch clear, confident entries.

SellRejection Level
Daily Volume
Market Structure Shift
London Session
Trend Line Break
Untapped Order Point