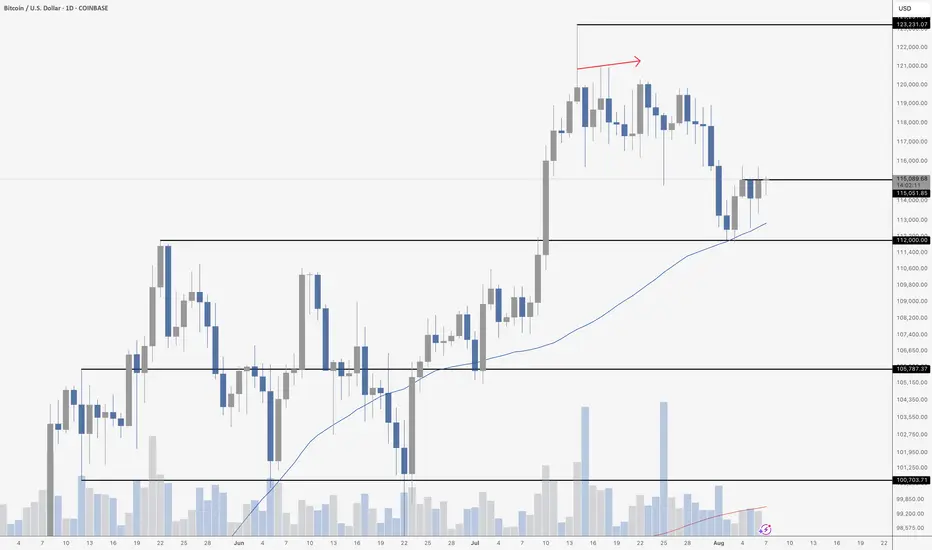
BTC ON THE EDGEBitcoin topped out at \$123,231 last month and has been pulling back ever since – but not in a chaotic way. The chart tells a familiar story: bearish divergence on the RSI as price made new highs, momentum quietly faded, and eventually the inevitable correction hit. Classic. Now we’ve pulled back into the \$112,000 region, which happens to align with a critical horizontal support zone and the 50-day moving average. This is where bulls need to make a stand.
The good news? The drop came on declining volume, suggesting there’s no real panic here. Sellers aren’t exactly stampeding for the exits. But let’s not pretend buyers have stepped up with any conviction yet either – this is a wait-and-see moment. If \$112K fails, things could accelerate quickly, with downside targets around \$105,787 and \$100,703. That red line lurking around \$97K is the 200-day moving average – the last line of defense before the structure starts to fall apart.
Momentum has reset and the RSI is hanging around the neutral zone. That’s not bullish, but it’s not death either. It just means we’re in purgatory – waiting for the next move. If the uptrend is going to stay intact, we need a higher low right here, right now. Bulls better start buying their own bags.
BTCETH.P trade ideas

Bitcoin Tightening@e are currently on the 4th straight daily candle that has either opened or closed at $15,051 - pretty crazy. We all know that Bitcoin is choppy, consolidating at the moment. But this has become a clear level to watch in the short term.
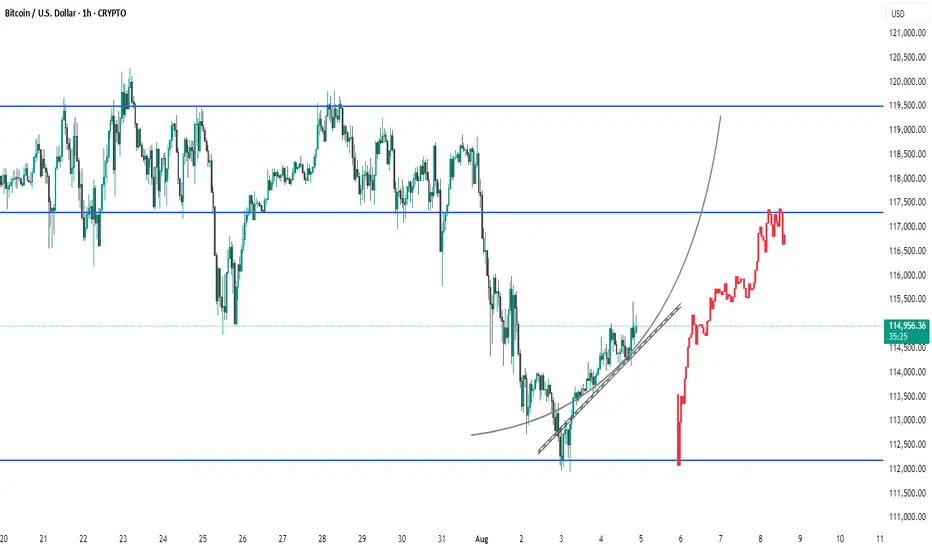
BTC #This 1-hour Bitcoin (BTC/USD) chart showThis 1-hour Bitcoin (BTC/USD) chart shows a clear recovery from recent lows, breaking through a resistance zone around $115,000. The projected red path suggests a bullish continuation toward the $117,000–$119,000 area, supported by a parabolic curve and upward trendlines. However, the price is currently facing resistance near $117,000, as indicated by the minor rejection at the top. Key support lies near $112,000 if the bullish scenario fails.
BITCOIN Will Move Lower! Short!
Take a look at our analysis for BITCOIN.
Time Frame: 4h
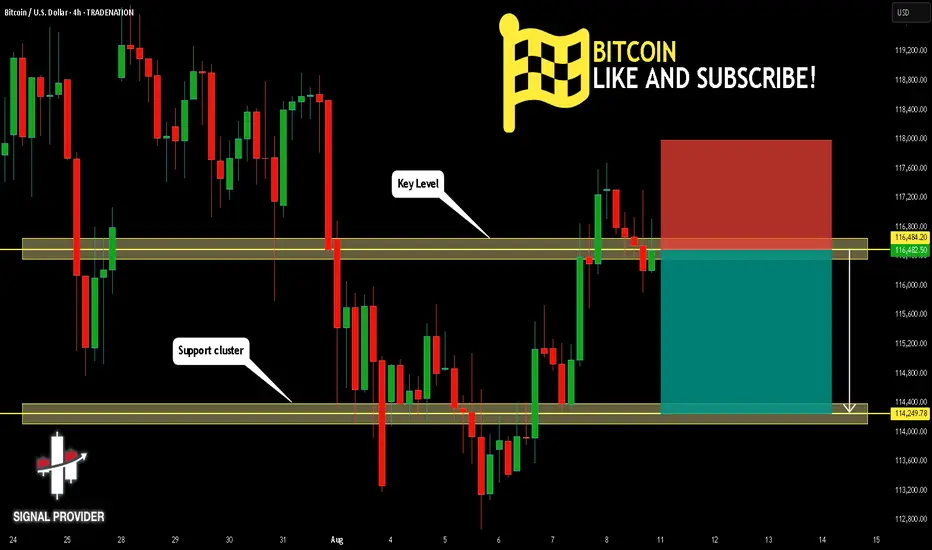
Current Trend: Bearish
Sentiment: Overbought (based on 7-period RSI)
Forecast: Bearish
The price is testing a key resistance 116,484.20.
Taking into consideration the current market trend & overbought RSI, chances will be high to see a bearish movement to the downside at least to 114,249.78 level.
P.S
The term oversold refers to a condition where an asset has traded lower in price and has the potential for a price bounce.
Overbought refers to market scenarios where the instrument is traded considerably higher than its fair value. Overvaluation is caused by market sentiments when there is positive news.
Disclosure: I am part of Trade Nation's Influencer program and receive a monthly fee for using their TradingView charts in my analysis.
Like and subscribe and comment my ideas if you enjoy them!
Bitcoin Found Support at $112kAfter making a new all-time high at $123,000, Bitcoin fell back down to test the previous high at $112,000 as expected in the previous post. In technical analysis, previous resistance tends to become support and for now we are seeing that $112k level hold as support with price bouncing up off it today and is trading back above $114k. We currently have the 50-day price average(50sma) right at that $112k level adding extra support for price as well.
As for the lower price indicators:
The PPO is showing the green PPO line holding above the 0 level which indicates that long-term momentum remains bullish. For short-term price momentum to turn bullish we would need to see the green PPO line cross back above the purple signal line.
The ADX indicator shows the purple -DI line rolling over after rising, and the green +DI line is beginning to rise indicating that the bear strength is weakening, and the bull strength is increasing. For long-term bull strength, we would need to see the green +DI line cross back above the purple -DI line, and for the background histogram bars to rise.
The TDI indicator shows the green RDI line holding above the 40 level which keeps the long-term bull trend intact. Generally, you want to see the RSI line trending between 40-80 as a sign of trend strength during a bull market. The green RSI line is also crossing back above the lower Bollinger Band after briefly crossing below it during the decline. In general, price will continue to decline when the RSI is below the lower BBand so getting back above that level is nice to see here. Next we would want to see the green RSI line move back above it's purple signal line, and back into the upper half of the Bollinger Bands.
I bought the dip into the $112k-$113k level as I expect this level to hold as support going forward. Next up, we're likely going to see a re-test of resistance at the new all-time high of $123k. From there, I'm still expecting a test of the 1.618 fibonacci extension at $135k.

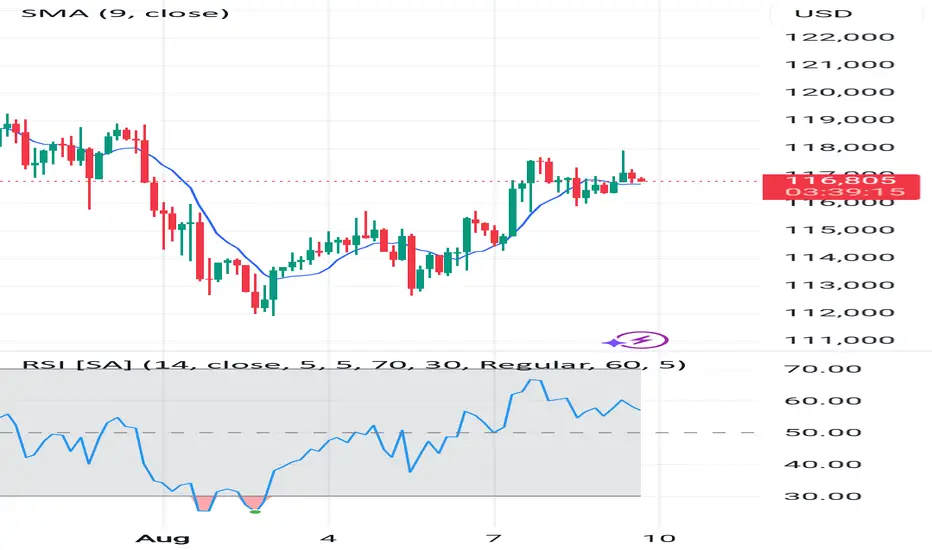
BTC/USD 4-Hour Technical Analysis – August 9, 2025Bitcoin (BTC) is currently trading around $116,877, showing signs of recovery after a recent pullback. On the 4-hour chart, price action is holding above the 9-period Simple Moving Average (SMA), suggesting short-term bullish momentum.
Price Action & Trend
Over the past few sessions, BTC has formed a higher low pattern, indicating buying interest at lower levels. The recent breakout above $116,000 signals renewed bullish sentiment, but the price is facing resistance near $118,000–$119,000. A decisive close above this zone could open the door for a rally toward $121,000–$122,000.
RSI Analysis
The Relative Strength Index (RSI) is currently around 60, staying in bullish territory but not yet in the overbought zone. This suggests there is still room for further upside before any major correction pressure sets in.
Key Levels to Watch
Resistance: $118,000 – $119,000, then $121,000 – $122,000
Support: $116,000, followed by $114,500 and $113,000
Outlook
The short-term trend remains positive as long as BTC holds above $116,000. However, failure to break the $118,000–$119,000 resistance area could trigger a short-term pullback toward $114,500. Traders should watch for a confirmed breakout for potential continuation plays.
BITCOIN Will Go Lower! Sell!
Please, check our technical outlook for BITCOIN.
Time Frame: 9h
Current Trend: Bearish
Sentiment: Overbought (based on 7-period RSI)
Forecast: Bearish
The market is trading around a solid horizontal structure 113,260.21.
The above observations make me that the market will inevitably achieve 107,826.27 level.
P.S
We determine oversold/overbought condition with RSI indicator.
When it drops below 30 - the market is considered to be oversold.
When it bounces above 70 - the market is considered to be overbought.
Disclosure: I am part of Trade Nation's Influencer program and receive a monthly fee for using their TradingView charts in my analysis.
Like and subscribe and comment my ideas if you enjoy them!

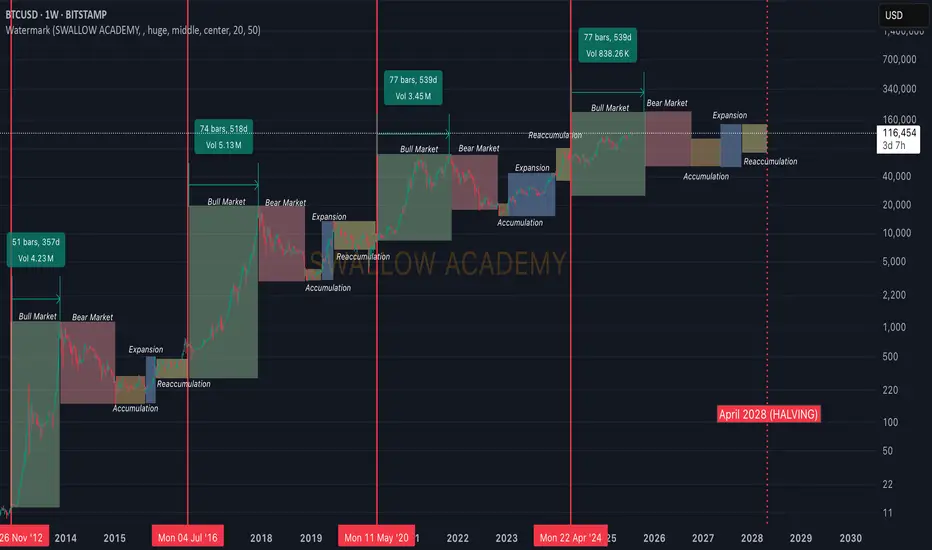
Bitcoin(BTC): History Never Lies | 3-5 Months Before Bear MarketBull Market - Bear Market - Accumulation - Expansion - Reaccumulation: this is the pattern we have been going with since 2012, where currently, after some help from Trump, in combination with the 2024 halving, we had really good upside momentum, which formed the new ATH and led us into the bull run that we have been looking for (by we I mean most traders).
Now, since the last time we shared this kind of analysis on the markets, we have successfully entered the bull market, where currently, based on previous bull runs, we still have around 90-150 days left of further upside movement, which would be a perfect opportunity for altcoins to have their momentum as well.
But bear in mind, each cycle is different, so we have to be ready for anything. What we see is that 2026 should be a bearish year, so be ready for that!
Swallow Academy
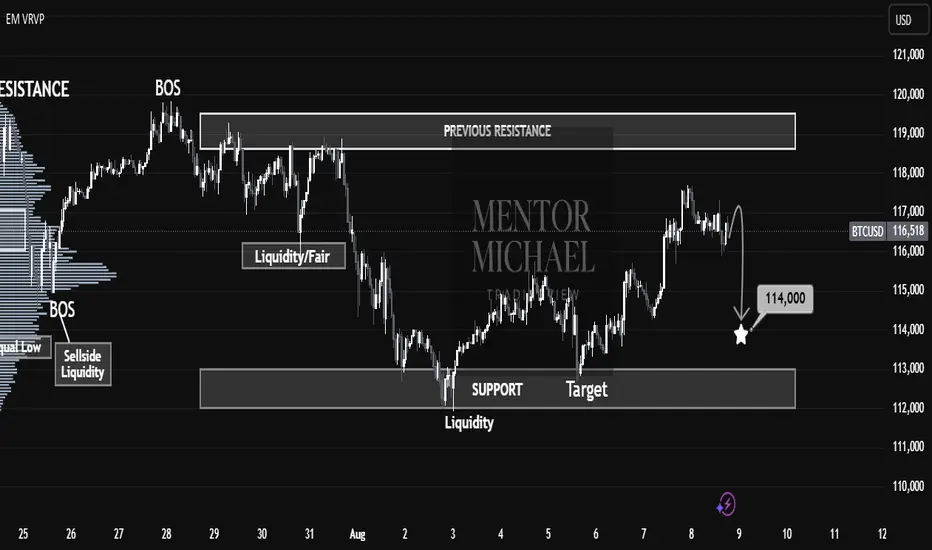
BTCUSD – Bearish Retracement Towards Key Liquidity Zone📊 BTCUSD – Bearish Retracement Towards Key Liquidity Zone
BTCUSD is currently trading near 116,425, showing signs of a potential bearish retracement after testing the previous resistance zone around 117,000–119,000. The chart structure highlights multiple Break of Structure (BOS) points, confirming shifts in market sentiment.
Technical Breakdown
Previous Resistance Rejection
Price failed to hold above the 117,000 mark, indicating strong selling pressure from the prior supply zone.
The rejection aligns with a liquidity grab above the recent highs, suggesting smart money distribution.
Liquidity & Fair Value Gaps
There’s a visible Liquidity/Fair Value Gap from the late July rally, which may now act as a magnet for price.
The market tends to fill these inefficiencies before deciding the next major trend move.
Target & Support Zone
The next key support and liquidity pool rests between 113,500 – 114,000, highlighted as the target zone.
This area has confluence with previous accumulation phases, making it a probable point for a bullish reaction if tested.
Volume Profile Context
Volume nodes indicate heavier trading activity below current levels, suggesting that a drop towards 114,000 could be met with increased buyer interest.
Market Outlook
Primary Bias: Short-term bearish retracement.
Immediate Target: 114,000 liquidity zone.
Invalidation: A daily close above 117,500 may shift sentiment back to bullish, opening the path toward 119,000–121,000.
Trading Insight:
Aggressive traders may look for short setups below 116,500, targeting 114,000. Conservative traders may wait for price to tap into the support/target zone for potential long opportunities with tight risk management.
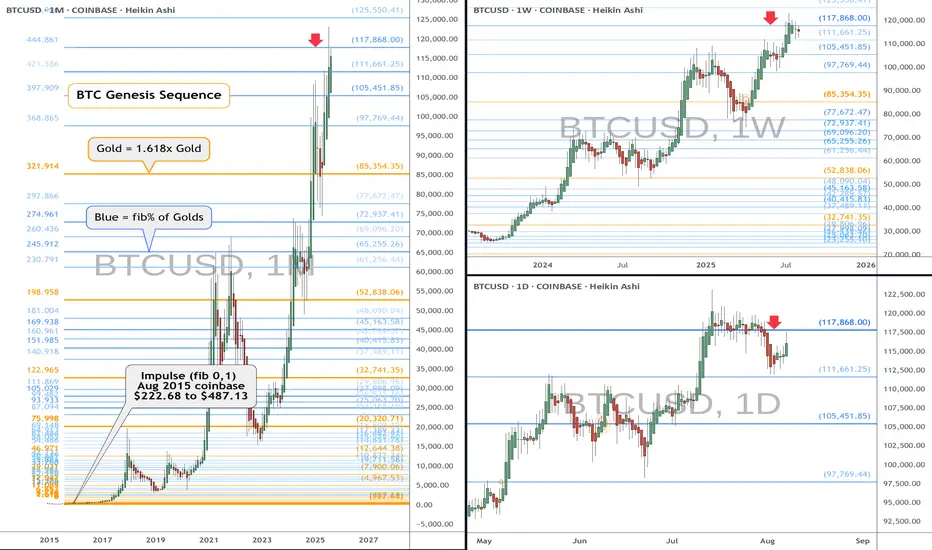
BTC heads up at $117,868 coinbase: Genesis fib trying to TOP it Shown here is a single fib series in 3 different time-frames.
The "Genesis Sequence" has called all major turns since 2015.
Exact reactions at the last few fibs confirm a warning here.
.
See "Related Publications" for previous analysis ------------->>>>>>>>>>
Such as the last post with a "Road Map" that played out PERFECTLY
.
Hit BOOST and FOLLOW for more such PRECISE and TIMELY charts.
=========================================================
.
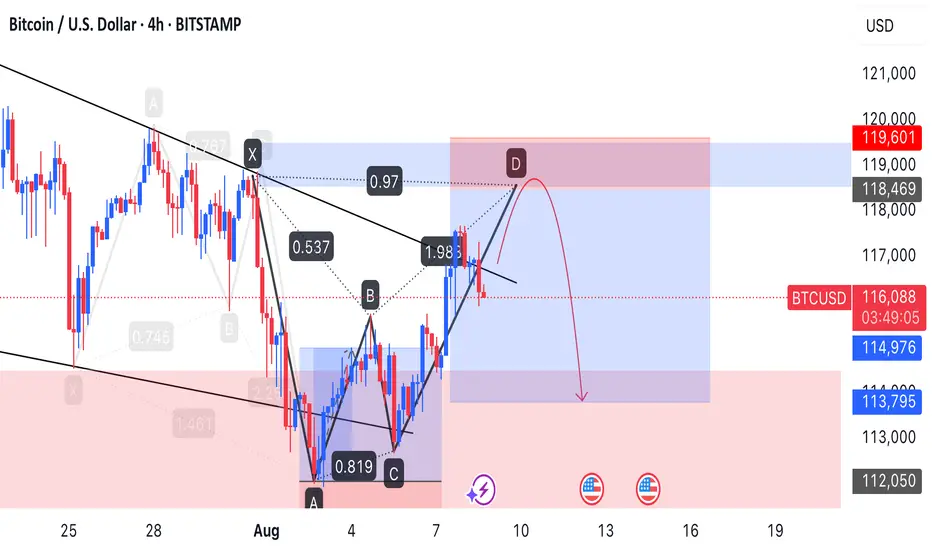
BTC cares US liquidity risks in AugustMorning folks,
So, in general as you can see our upside AB=CD that we discussed last time is working. But...
as you know BTC is strongly related to liquidity dynamic on US domestic system. This month Mr. Bessent wants to re-finance 1Trln in debt, with net borrowing around 250 Bln. Hardly BTC will get a small chunk of this funds.
it means that the volatility could rise significantly in nearest 1-2 weeks with downside price gravitating. Overall action looks rather heavy. Maybe BTC somehow will complete AB=CD target around 116.20-116.25K, but now this action looks like retracement - no thrust, slow action a lot of overlapping candles. So lows might be re-tested or even broken.
In current situation we think it would be better to not take any new longs and watch for clarity. If you have position already - move stops to breakeven.
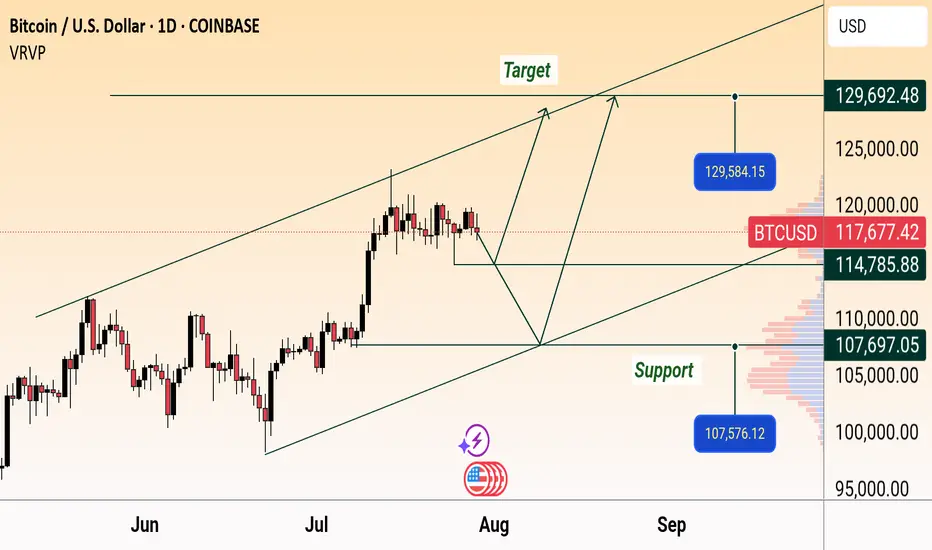
BTC/USD Daily Outlook: Support & Target Levels IdentifiedBitcoin (BTC/USD) Daily Chart Analysis:
Price is currently at $117,758.70, showing a slight decline. Key support levels are marked at $114,785.88 and $107,576.12, while targets are projected near $129,584.15 and $129,692.48. Chart suggests a possible upward channel, with both bullish and bearish scenarios mapped.
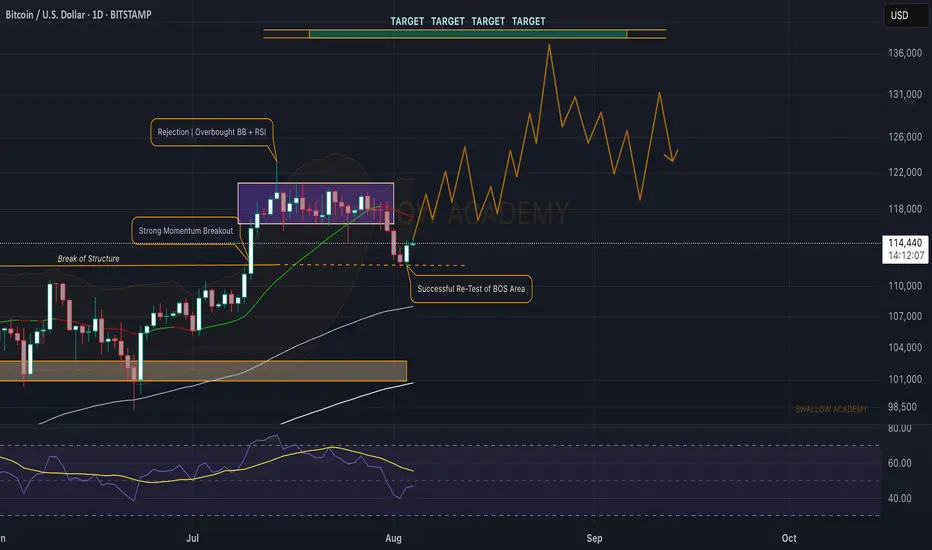
Bitcoin (BTC): Successful Re-Test on Break of Structure AreaBitcoin is showing a good start at the beginning of the week, where we are seeing a successful retest happening, which again might send the price back into the accumulation zone and then the breakout we have been looking for.
So as long as we are above the retest zone of BOS, we are bullish; if we break it, then 101,000-104,000 is going to be our next target!
Swallow Academy
BTCUSD Short Setup – 4H Bitcoin has broken below a key dynamic support zone, and current price action signals a potential continuation to the downside. This short entry is supported by multiple technical confluences:
🔻 Bearish Confluences:
Fibonacci Retracement Rejection: Price rejected the 61.8% Fib retracement zone near $114,978, confirming a potential local top.
Trend Structure: Clear lower high, lower low structure forming on 4H – momentum favors sellers.
EMA Cloud Pressure: Price is decisively below the multi-band EMA cloud, showing sustained bearish pressure and trend bias.
Volume Profile Gap: Price is entering a low-volume node between $113.8k and $112k, increasing likelihood of a sharp move down.
Bearish Candlestick Pattern: A strong bearish engulfing candle formed after the retracement – a classic reversal confirmation.
🎯 Fibonacci-Based Targets:
TP1 – $11205 (38.2%): Initial demand zone and minor support.
TP2 – $11024 (61.8%): Mid-extension level, aligns with prior consolidation.
TP3 – $10731 (100%): Full measured move target if the downtrend accelerates.
SL: Placed just above the recent swing high at $11678, protecting against false breakouts.

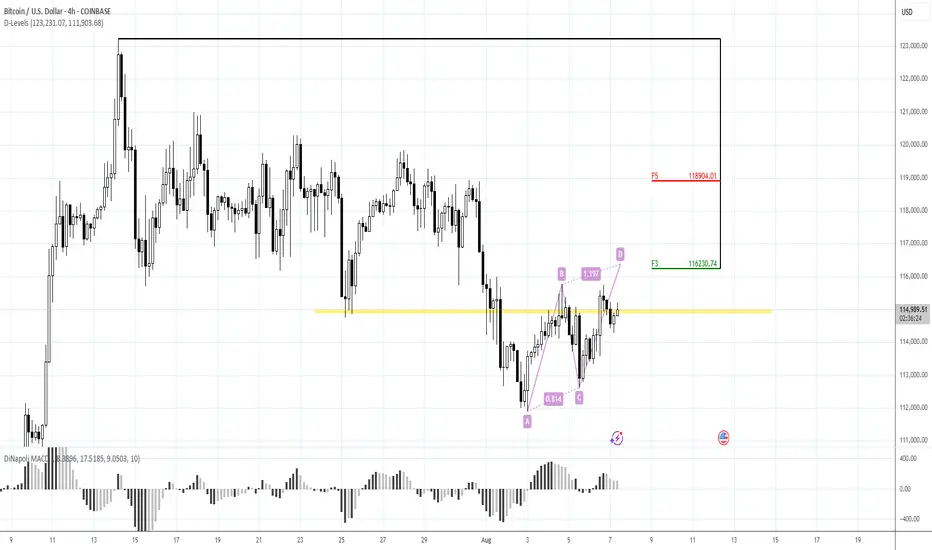
Bitcoin on the Rise — But the Bat Hasn't Flown Yet
---
🚀 **!** 🦇
We're anticipating a continued bullish move in Bitcoin until it completes the **Bat Pattern** at the key level of **$118,469**. 📈
From there, we expect a reversal — a drop toward **$113,800**. 📉
Stay tuned, drop your thoughts below, and let’s decode the market together.
#Bitcoin #CryptoAnalysis #BatPattern #TechnicalAnalysis #LearnThenTrade
---
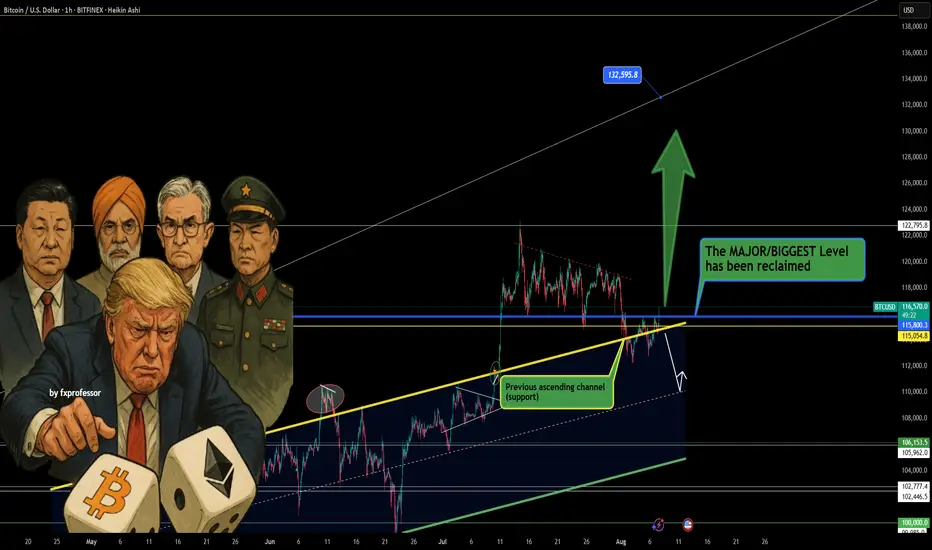
Trump Boosts 401K Crypto Talk, But BTC Levels Lead the Way UP📢💥 Trump Boosts 401K Crypto Talk, But BTC Levels Lead the Way UP 🧠📊
News just dropped that President Trump may sign an executive order allowing crypto into 401(k) retirement plans. 🇺🇸📜 While that’s a massive headline, let’s stay grounded—we play the levels, not the politics. 🧘♂️📉📈
⚠️ A quick disclaimer: It’s Trump, so… let’s see if the ink even hits the paper. But price is king, and the chart already gave us the real signal.
🔄 Bitcoin just reclaimed the single most important level: $115,800. This isn’t just a number—it was the previous ascending channel’s support, and it’s now acting as strong support again. This changes the game.
🟢 As I’ve mentioned in previous ideas, I remain hedged:
✔️ Long BTC
❌ Short S&P 500
That ratio is working out well, as shared earlier today in the post:
“Bitcoin vs S&P 500 – Ratio Signals Strength” — it’s clear which asset the market favors. BTC is holding structure. SPX? Not so much. 📉🔍
🎯 Next upside target: $122,795
🚀 Bigger extension level: $132,595
🛑 Breakdown invalidation: Loss of $115,800 would weaken the case.
News or not, structure always wins. Stay sharp, stay level-headed. The market rewards those who listen to the chart, not the noise. 📡🧠
One Love,
The FX PROFESSOR 💙
Disclosure: I am happy to be part of the Trade Nation's Influencer program and receive a monthly fee for using their TradingView charts in my analysis. Awesome broker, where the trader really comes first! 🌟🤝📈
BRIEFING Week #31 : S&P ATH may have been a TrapHere's your weekly update ! Brought to you each weekend with years of track-record history..
Don't forget to hit the like/follow button if you feel like this post deserves it ;)
That's the best way to support me and help pushing this content to other users.
Kindly,
Phil

Watching for intraday BTC bounce firstMorning folks,
So, neither NFP data nor technical picture helped BTC to stay above 117. While US Treasury is started drain liquidity and borrow (they need 1 Trln this month), sending ~ 150 Bln to its TGA account with the Fed - BTC got hurt.
Now price stands at vital area - previous tops. If BTC will drop under 110K, collapse could start. Let's hope that this will not happen...
Meantime, we're at 112-113K support. We already talked about it before. Here we have reversal bar and bullish engulfing pattern, so maybe we could get a bit higher pullback on intraday chart. 113.8 and 113.1K support areas on 1H TF might be considered for long entry. Invalidation point for this plan is the low of engulfing pattern.
Bitcoin’s Bull Run: Is There Still Fuel in the Tank?Bitcoin has had an impressive year, breaking out of a downward channel and launching into a strong upward rally as we saw in the previous idea .
But now, price action is slowing, and many are asking: Is the bull run over or just taking a breather?
Let’s look at what the chart tells us.
📈 A Classic Bull Flag in the Making
After the breakout, BTC seems to be forming another channel or what traders often call a bull flag . This is typically a bullish continuation pattern , meaning that after a short consolidation, price may break upward again.
But that’s the technical side. What about the big picture?
🔁 Bitcoin Cycles: History Rhymes
In the chart below the price, we see a comparison of Bitcoin’s last two cycles (shown in red and orange). Interestingly, both of those cycles point to end between September and November this year.
If history repeats, or at least rhymes, the current cycle could follow the same timeline. That gives us a few more months of potential upside before this bull run starts cooling off.
Note that the first cycle peaked faster, but also had a mini bull momentum in the same zone where the next cycles peaked.
⚠️ Still Bullish, But Watch Your Step
Even though we’re near all-time highs and price is showing signs of slowing, there may still be room for growth. However, the risk is increasing, so this is a time to stay bullish but with extra caution.
A key level to watch is marked in red on the chart. Falling below it could mean the bull momentum is fading. The reason is quite simple, a bull rally can't trade inside prices of previous consolidation phases because that means lateral or bear momentum.
🧠 Final Thoughts
Bitcoin has a history of repeating patterns, and right now, we seem to be tracking closely to previous cycles. With a potential breakout forming and a few months left on the clock, there could still be opportunities ahead.
But don’t forget: every cycle ends. Stay alert, manage risk, and don’t chase green candles blindly.
💬 Does this setup align with your view on BITSTAMP:BTCUSD ?
🚀 Hit the rocket if this helped you spot the opportunity and follow for more clean, educational trade ideas!


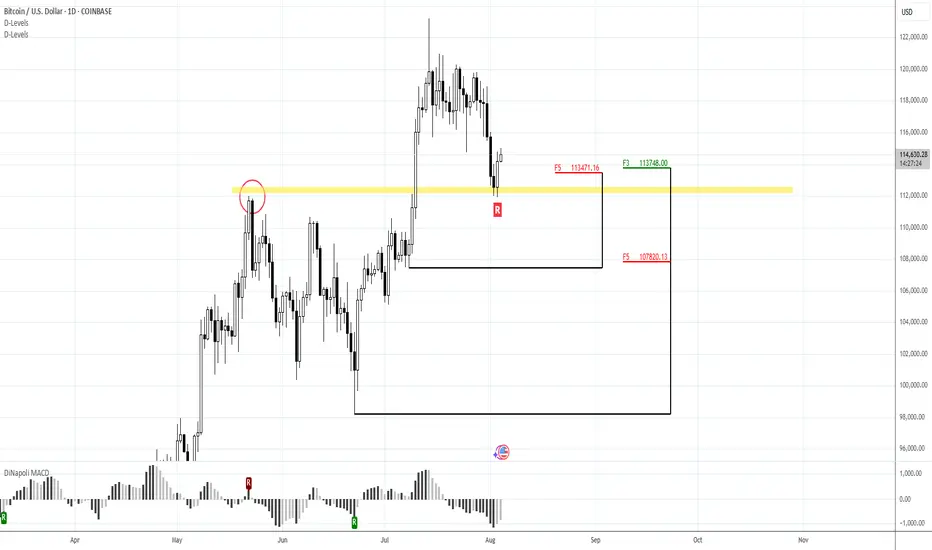
BTCUSD 1H BULL STILL IN CONTROL BEFORE MASSIVE CRUSH :))BTCUSD Looking to test 117600
BTCUSD created very good support around 113171 (from last week drop)
Let see if we break or hold 117600, if thats HOLD btcusd shows big sign of decline
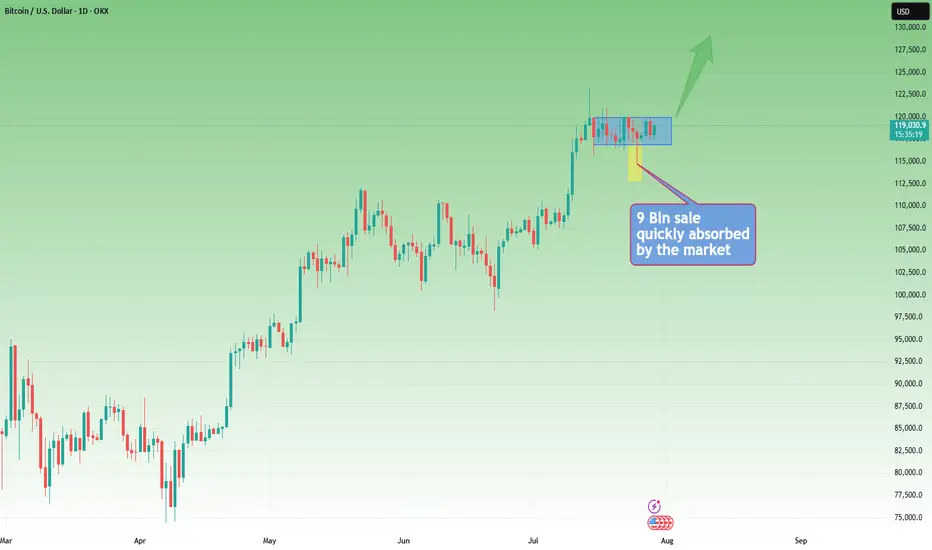
Rectangle Consolidation + Bull Trend = BTC Setup for ATHYesterday, Bitcoin dipped and recovered again, following last week's sharp spike down, triggered by the $9B Galaxy Digital sale on behalf of a Satoshi-era investor.
________________________________________
🧠 Why is this important?
Despite being one of the largest BTC sales in history, the move only caused a temporary spike down.
That’s a clear sign of market strength and strong interest on dips.
________________________________________
📉📈 Current Technical Context:
• If we ignore the spike, price is consolidating in a tight rectangle
• That’s typically a continuation pattern
• The broader trend remains strongly bullish
📌 Put all of that together, and we have at least 3 reasons to expect upside continuation
________________________________________
🎯 Key Levels:
• Break + daily close above $120K → likely leads to a new ATH and a potential test of $130K
• Invalidation only comes with a break below $114K
________________________________________
Conclusion:
BTC just absorbed a massive $9B sell without blinking.
As long as $114K holds, I'm bullish and expecting continuation.
Next leg could (and I hope it will) be explosive. 🚀
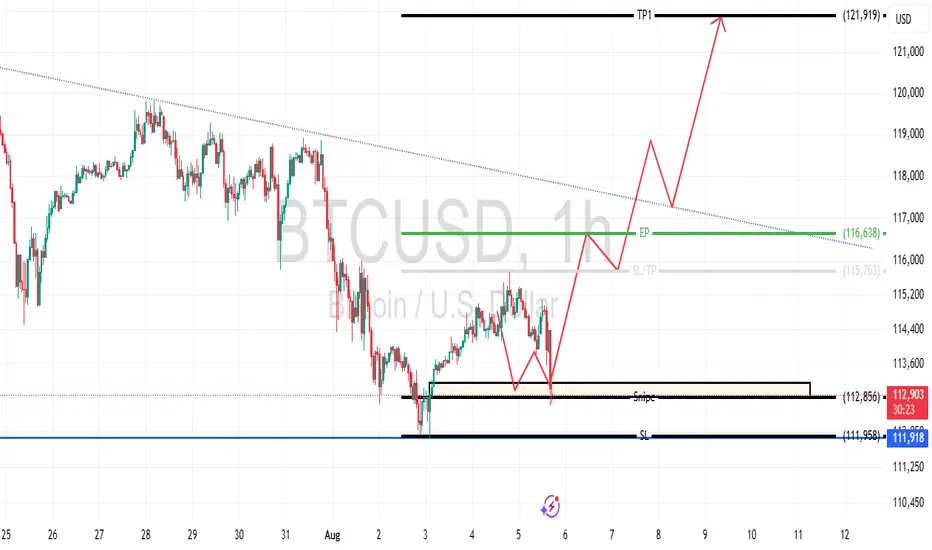
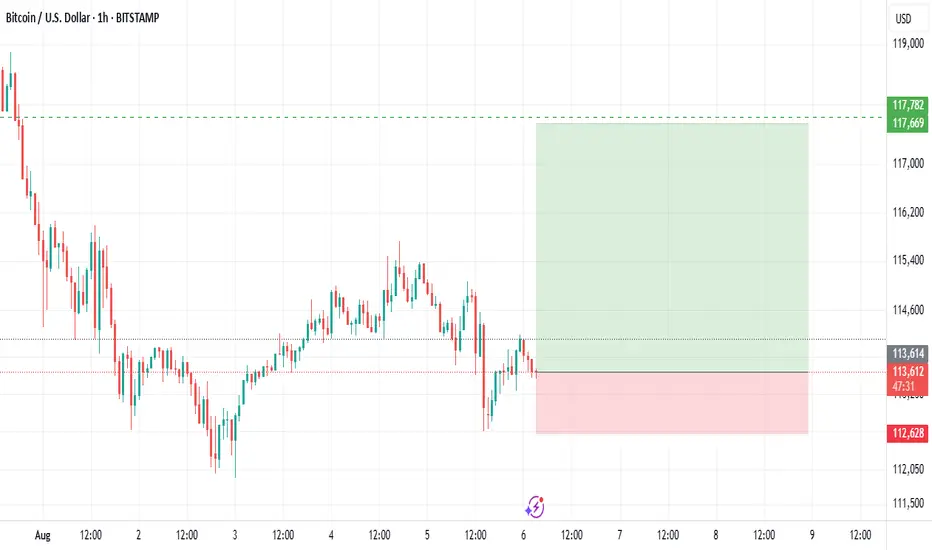
Bitcoin Possible new ATHPrice targets TP1 at $121,919, with an entry point (EP) at $116,638, stop loss (SL) at $111,987, and a support/slip level at $112,856. Expecting a rise from current levels near $113,085, driven by a breakout above the descending trendline.