$BTC / Bitcoin Elliot Wave Analysis Update - 7/21Hello fellow degenerates,
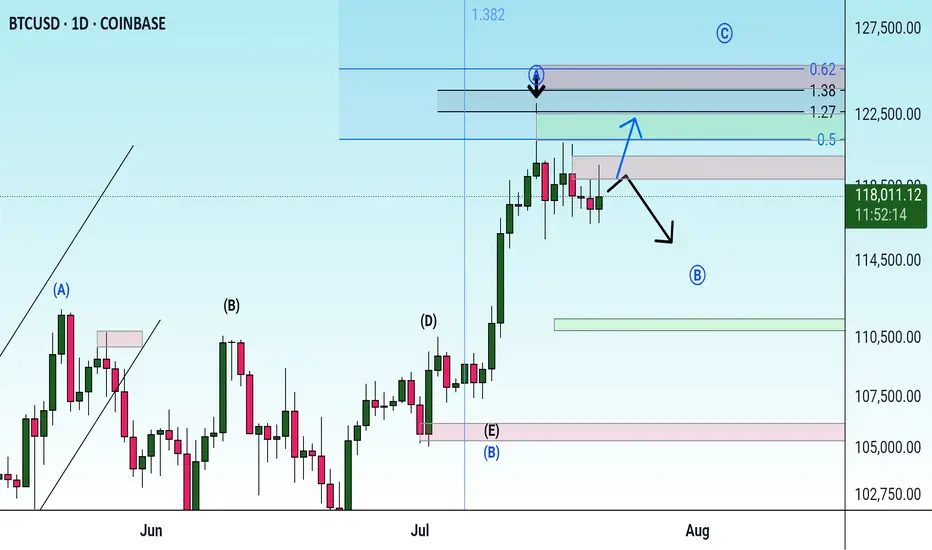
Price reached our Wave 3 target and is now inside a consolidation pattern, wave 4. If we have a break above the pattern, my next target is at 126k - 132k range.
- We need price to stay above 116k for a bullish continuation
- A break below 116k could take us towards 110k
- Key levels to watch: 116k, 110k
BTCETH.P trade ideas

Check the trend Given the price behavior within the current resistance range, possible scenarios have been identified. If the price breaks through the resistance range, a continuation of the upward trend is likely.
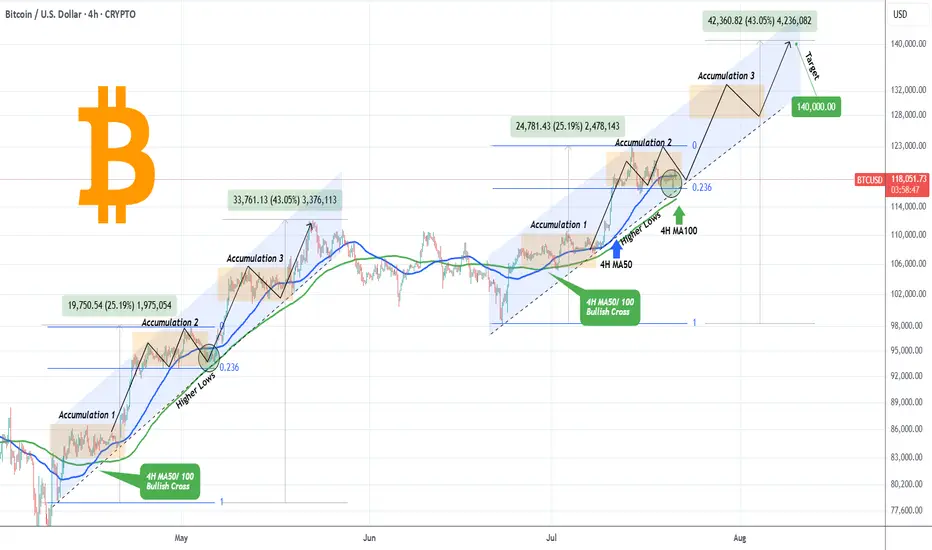
BITCOIN Accumulation Phase almost completed. Higher from here?Bitcoin (BTCUSD) is making a strong rebound on the bottom of its 1-month Channel Up and this analysis is in direct response to the one we published last week (July 15, see chart below), where we called this one-week consolidation:
We won't be going into too much detail then, as you can see the price made the Accumulation 2 Phase, after an identical +25.9% Bullish Leg, same as April's and by breaking below the 4H MA50 (blue trend-line), it hit the 0.236 Fibonacci retracement level.
As per the May 05 fractal hit, as long as the 4H MA100 (green trend-line) supports this Channel Up, the market should start Bullish Leg 3 towards Accumulation Phase 3 and eventually peak at around +43% from its start at $140000.
Do you think the pattern will continue to be repeated in the exact same order? Feel free to let us know in the comments section below!
-------------------------------------------------------------------------------
** Please LIKE 👍, FOLLOW ✅, SHARE 🙌 and COMMENT ✍ if you enjoy this idea! Also share your ideas and charts in the comments section below! This is best way to keep it relevant, support us, keep the content here free and allow the idea to reach as many people as possible. **
-------------------------------------------------------------------------------
💸💸💸💸💸💸
👇 👇 👇 👇 👇 👇
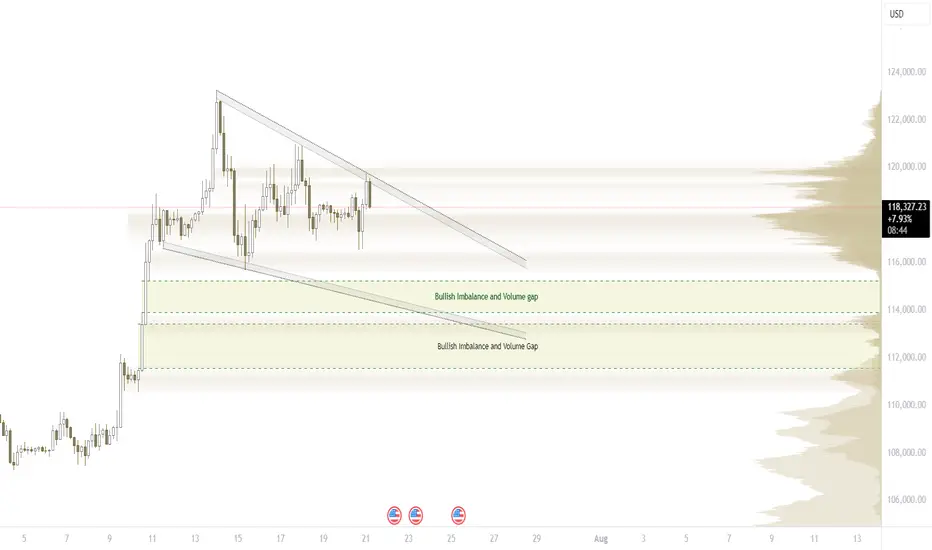
Where is the discount?In the wake of the past two week's impulsive price action, imbalances have emerged on multiple time frames. With these imbalances leaving volume gaps behind, if 116 doesn't hold, 110-112 is likely the discount zone, where institutions step up their buying. I'm inclined to believe that, with the lower highs, we're headed there. COINBASE:BTCUSD
BTC/USD 21.07.25Targeting the $125,500 Resistance
Market Overview:
After a correction down to $116,850, Bitcoin held above the 144 EMA and is recovering toward the key resistance zone around $125,500. A bullish continuation pattern is forming.
Technical Signals & Formations:
— Strong support reaction from $116,850
— 144 EMA on 4H holding as dynamic support
— ABCD harmonic structure supports upside
— Break above $120,000 will confirm bullish momentum
Key Levels:
Support: $116,850, $113,700
Resistance: $123,300, $125,500–$126,000
Scenario:
Primary: continuation upward toward $125,500 with potential breakout
Alternative: minor pullback to $116,850 before next leg up

BTC/USD Long setupPrice has brokenout from previous swing point which gives a confirmation for long position and currently making retracement into support zone which gives a better entry for a 1:5 RR
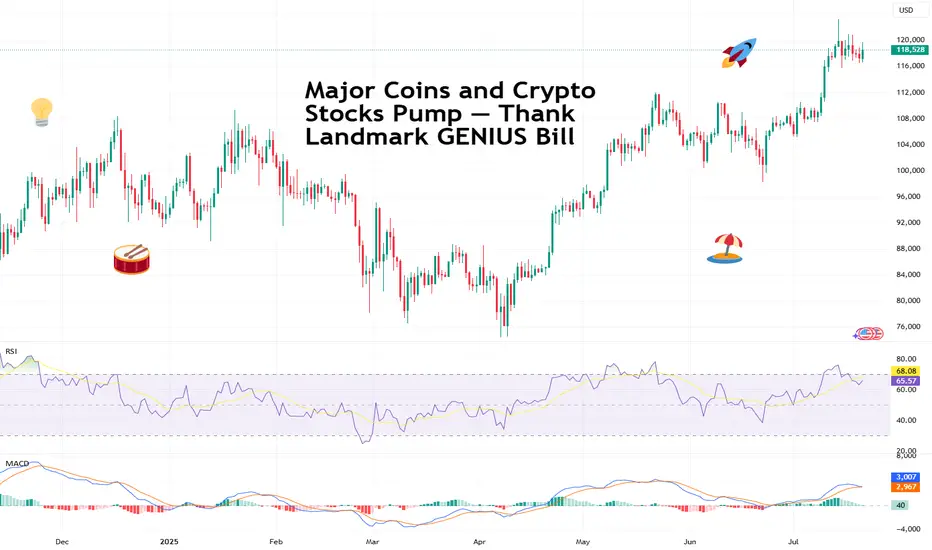
Major Coins and Crypto Stocks Pump — Thank Landmark GENIUS BillBitcoin BITSTAMP:BTCUSD making ATHs? Old news. But Coinbase NASDAQ:COIN and Robinhood NASDAQ:HOOD hitting those record-high notes? And XRP BITSTAMP:XRPUSD dangerously close to eclipsing its own peak, while Ethereum keeps chugging along toward $4,000? Now we’re talking.
In a market-friendly twist, President Trump signed the GENIUS Act into law on Friday — a sweeping legislative win for crypto. Short for Guiding and Establishing National Innovation for US Stablecoins, the GENIUS Act marks the first major federal framework for digital assets and, more importantly for traders, triggered a firestorm of price action across the space.
Flanked by crypto executives, Republican lawmakers, and a few NFT bros in suits, Trump called the stablecoin-focused bill “perhaps the greatest revolution in financial technology since the birth of the internet.” Bold claim. But judging by what the market’s doing — he might actually be onto something.
The bill, passed 308 to 122 in the House, lays the groundwork for US banks to issue their own stablecoins and create a regulatory moat that finally separates innovation from legal whack-a-mole.
But wait, that’s not all. The House also passed the CLARITY Act and the Anti-CBDC Surveillance State Act. The first one will help determine if cryptos will be considered securities and the second one bans the Federal Reserve from issuing its own coin.
🚀 Crypto Market Cap Hits $4 Trillion
As the bill cleared Congress and Trump picked up the pen, the entire crypto market cap exploded past $4 trillion for the first time in history with the orange coin holding more than 60% of the market .
It wasn’t just Bitcoin BITSTAMP:BTCUSD making noise (although it did quietly retest $120,000 boasting a $2.4 trillion valuation, or more than that of Google parent Alphabet NASDAQ:GOOGL ).
The real momentum was coming from the stocks and altcoins — especially those with exposure to the suddenly green-lit US regulatory scene.
📈 Coinbase: To the Moon and Beyond
Let’s talk about Coinbase, ticker symbol NASDAQ:COIN , and now also, apparently, ticker symbol 🚀.
Shares surged over 8% on Friday to hit a new record session high of $445, giving the US-based exchange a market cap of over $100 billion. Not bad for a company that spent most of 2022 playing dodgeball with the SEC.
The GENIUS Act (and its siblings) cleared a path for institutional crypto adoption — and no one stands to gain more than Coinbase. It’s the go-to exchange for institutional custody and compliance. And now, with banks dipping their toes into stablecoin waters, guess who gets to facilitate those flows? Exactly.
Coinbase has now rallied over 63% year-to-date, putting it back into market darling territory — and giving early bulls a solid reason to post their PnLs again.
📊 Robinhood: Meme Stock No More?
Wait, what’s that clamor? It’s the “HOOD to $100” crowd dusting off their 2021 hats.
Robinhood NASDAQ:HOOD also saw a serious lift from the legislative push — hitting an all-time session high of $113 on Friday. The shares are up 180% in 2025 alone.
While most remember Robinhood for its meme stock legacy, the app has quietly built a towering crypto trading platform in the US. And now, with Congress cracking open the stablecoin lane and clearing legal fog, it’s suddenly a real contender in the digital asset arms race.
Add to that Trump’s pledge to dismantle crypto-hostile policies from the previous administration (many of which affected Robinhood’s crypto operations), and it’s no wonder the stock is flying.
💰 Stablecoins: Boring Coins Are Now Big Biz
You’d be forgiven for snoozing through most stablecoin headlines. After all, they don’t moonshot or do anything but sit idle.
But make no mistake — this is where the real money’s watching. JPMorgan CEO Jamie Dimon, not known for casual crypto endorsements, said last week his bank will now be “involved in both JPMorgan deposit coin and stablecoins.”
That’s a seismic shift. For years, traditional banks sat on the sidelines while Circle CRYPTOCAP:USDC and Tether CRYPTOCAP:USDT built billion-dollar stablecoin empires. Now, thanks to the GENIUS Act, the door is open for regulated banks to issue digital dollars backed by FDIC-level trust — and potentially eat into the DeFi-native players’ lunch.
Boring’s about to get very profitable.
💥 XRP: Return of the Ripple?
You know it’s a bull market when XRP BITSTAMP:XRPUSD shows up uninvited and still gets the VIP booth.
The one-time courtroom drama token surged over 60% in the past two weeks, hitting $3.50 and inching dangerously close to its all-time high. Ripple’s comeback arc may finally be getting its payoff.
With legal pressure fading and Congress setting new guardrails for digital assets, XRP’s regulatory risks just got a lot less scary. Plus, institutions looking for faster cross-border rails may find XRP’s network a bit more attractive when Washington’s no longer breathing down its neck.
🐂 Ethereum: Quietly Eyeing $4,000
Ethereum BITSTAMP:ETHUSD might not be making headlines like Bitcoin or XRP, but don't let the quiet confidence fool you.
ETH has been rising steadily, gaining almost 50% in the last two weeks, and Monday morning was trading just shy of $3,800. With regulatory uncertainty waning, and the market treating Ether more like an investment than a utility token, it’s slowly reclaiming its 2025 highs.
Factor in the growing number of ETH-based ETFs , tokenized real-world assets (hello, Treasury bills onchain), and the boom in stablecoins running on Ethereum rails… and you’ve got a slow-burn bull case building brick by brick.
🦅 Washington, WAGMI?
So, what’s the takeaway?
For the first time, Congress passed crypto legislation that didn’t come with a hidden poison pill. The GENIUS Act, along with the CLARITY Act, have made more legislative progress in a week than years of courtroom wrangling and ETF lobbying combined.
Trump, with his pro-crypto stance and deep industry ties (after all, he did launch his own coin not too long ago), just turned crypto into a political weapon — and a market darling. Is 2025 shaping up to be the year Washington went full Web3?
Let’s hear it from you : Drop your thoughts in the comments and let’s spin up the discussion.
BTCUSD CONSOLIDATES BEFORE NEXT HIKE
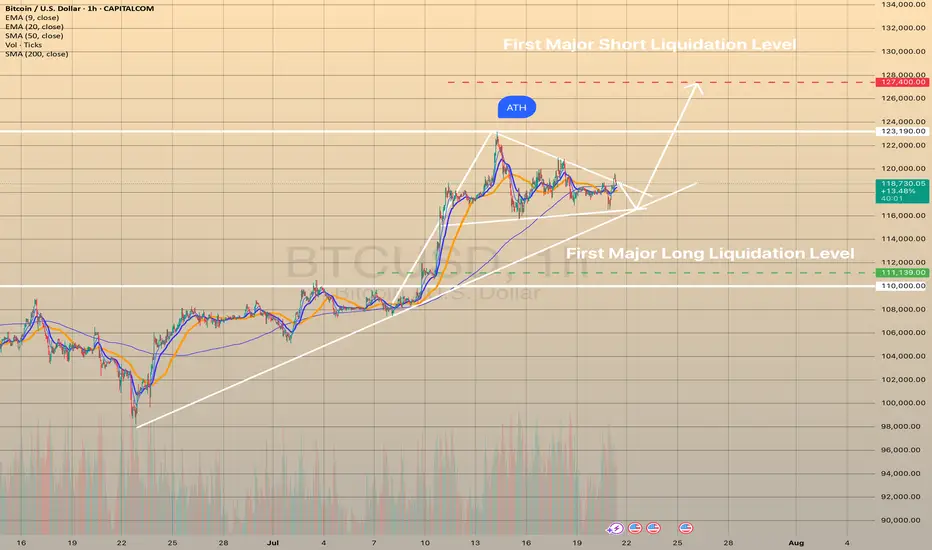
BTCUSD CONSOLIDATES BEFORE NEXT HIKE📈
Bitcoin has been under buying pressure since the beginning of July 9. Since July 14 the price has been consolidating. Now the graph represents the bullish pennant.
I expect the price to continue trading sideways for some time, then rebound from the trendline and move towards first major liquidation level at 127,400.00.
What is a liquidation Level?
The price at which a crypto exchange forcibly closes a leveraged position when margin falls below the required level, recovering borrowed funds.
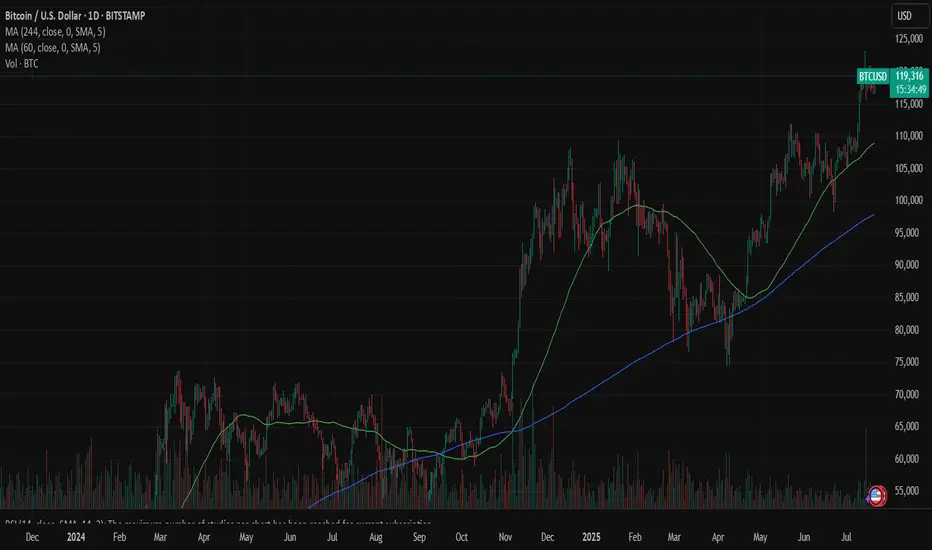
BTC CONSOLIDATESBitcoin continues to consolidate just below resistance after a strong multi-week rally, currently trading around $118,813. Last week’s candle was notably toppy, with a long wick to the upside that hinted at some exhaustion near the highs. Despite that, this week’s price action has remained relatively firm, suggesting the bulls are still in control for now. The key overhead resistance remains at $123,231 – a level that marked the recent high – and BTC has yet to close above it. Support at $112,000, previously a ceiling during the consolidation in May and June, has now flipped to critical support and must hold to maintain the bullish structure.
Volume has declined modestly since the breakout in early July, a typical sign of consolidation rather than distribution. The 50-week moving average continues to rise and now sits well below price around the $89,000 zone, confirming strong momentum. Still, traders should remain cautious here – failure to break above resistance or a close below $112,000 could lead to a deeper pullback toward the mid-$90K range. Until then, this remains a textbook consolidation just beneath resistance in a larger uptrend, with the potential for a breakout continuation if strength returns.

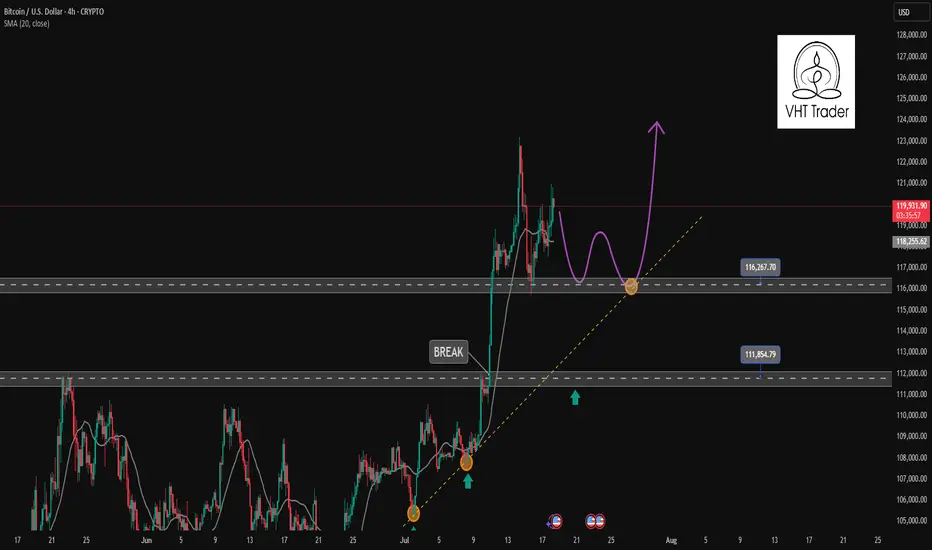
Find a recovery point to continue buying BTC✏️ CRYPTO:BTCUSD is trading near the all-time high. The trading strategy is to wait for some investors to take profit so that the price can return to the nearest support zones and continue to buy to the new all-time high zones.
📉 Key Levels
BUY Trigger: confirms the recovery from the support trend line 116000
BUY zone 112000 (Strong support zone)
Target 129000
Leave your comments on the idea. I am happy to read your views.
Bitcoin (BTC): Accumulation Before New All-Time-High?After the recently formed ATH near the $123K zone, we have had a decent accumulation following after that, which stabilized the Bollinger Bands and RSI, giving us a new potential for another ATH to form from here.
Now our target was $120K, which we filled quickly; now it is the $140K zone mainly so we are keeping our attention there. We are keeping the bullish game plan as long as we are above the middle line of the Bollinger Bands (which currently is in a bullish trend). (That green line is the middle line, btw).
Swallow Academy

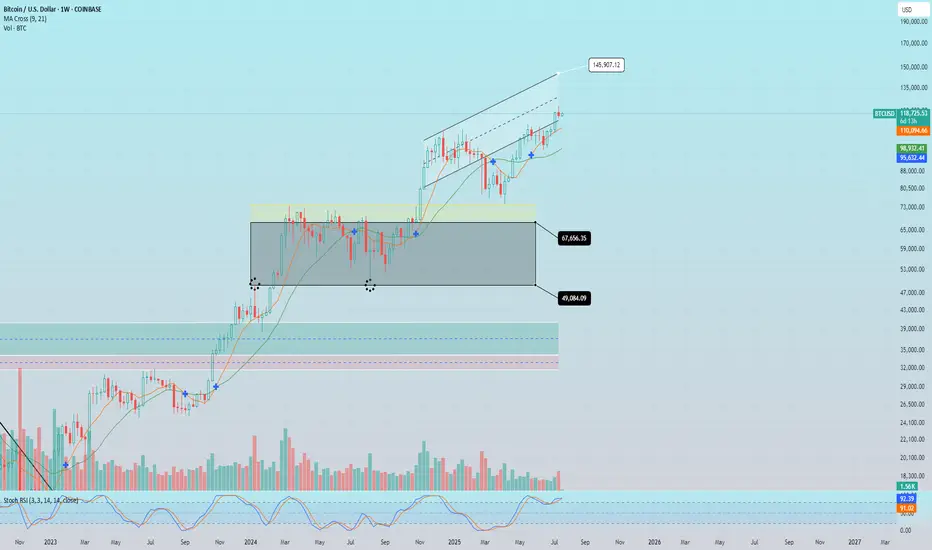
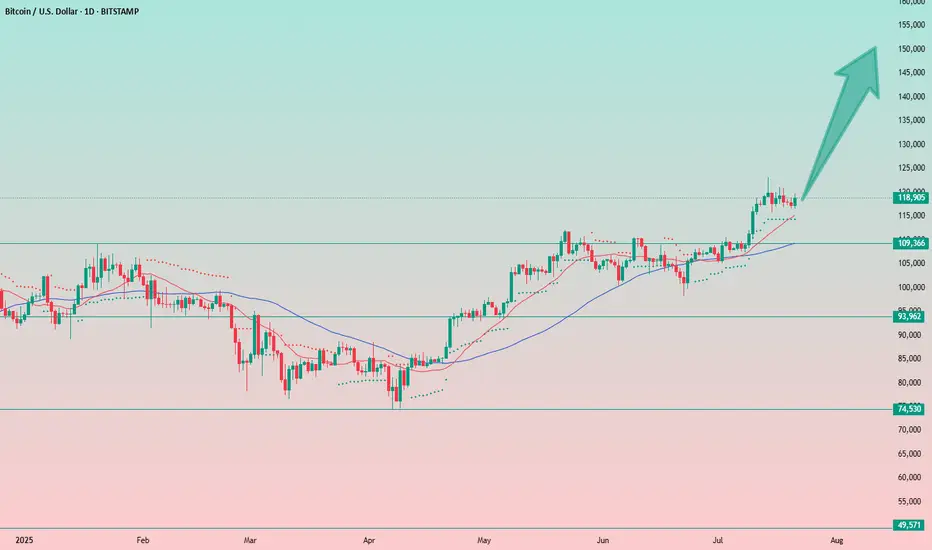
Bitcoin Keeps Charging AheadBitcoin doesn't seem to be slowing down and continues its bullish momentum.
Overall, I believe the chart shows a solid setup for further growth. I'm not exactly sure how high we’ll go, so in this case, I’ll be trading with a clear stop-loss strategy.
📝Trading Plan
Entry: I’m building a position from current levels.
Stop Loss: Stop-loss set at $115,000 (4%).
Target: Target is around $150.000. I'll be trailing stop-loss as price moves higher.
One more thought on Bitcoin:
I don’t expect to see crypto winters like we had in the past. Liquidity in the system has increased significantly, and institutional players are now involved. As a result, we should see fewer long, painful drawdowns and overall reduced volatility.
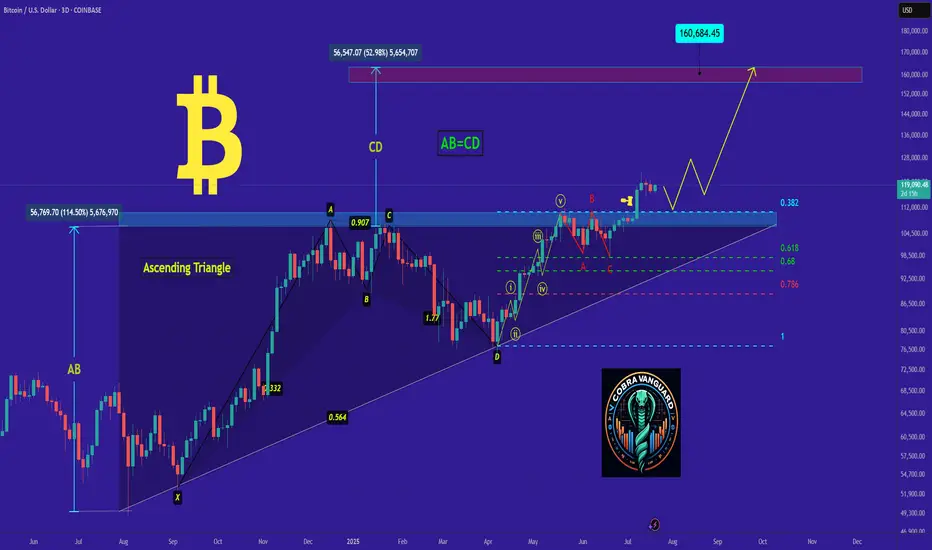
𝐛𝐢𝐭𝐜𝐨𝐢𝐧's Situation, A Comprehensive Analysis !!!As I said, Bitcoin broke the triangle, and now with a slight price correction, it could surge to $160,000, and you still think I'm joking!!
Previous analysis
Bitcoin - Will Bitcoin reach its previous ATH?!Bitcoin is above the EMA50 and EMA200 on the four-hour timeframe and is in its ascending channel. Bitcoin’s current upward momentum has the potential to reach its previous ATH. If it corrects, we can look for Bitcoin buying positions from the specified support area, which is also at the intersection of the bottom of the ascending channel.
If this support is lost, the decline will continue to around $113,000, where we can again buy Bitcoin with a better risk-reward ratio.
It should be noted that there is a possibility of heavy fluctuations and shadows due to the movement of whales in the market, and capital management in the cryptocurrency market will be more important. If the downward trend continues, we can buy within the demand area.
Last week, the U.S. House of Representatives passed the CLARITY Act (Crypto-Asset National Regulatory Transparency for Investors and Consumers Act) with 294 votes in favor and 134 against, including support from 78 Democrats. The bill represents the first comprehensive legislative effort to regulate the cryptocurrency industry and is considered a major regulatory win for digital asset proponents.
Key features of the legislation include:
• Clearly defining the regulatory roles of agencies like the SEC and CFTC
• Establishing a new category for registered digital assets
• Facilitating broader integration of cryptocurrencies into traditional financial systems
Status in the Senate: Despite bipartisan approval in the House, the bill’s future in the Senate remains uncertain. Senators are still in the early stages of drafting their own version, and significant revisions are expected. Some Senate Democrats insist that the bill must explicitly address President Trump’s and his family’s cryptocurrency holdings.
The CLARITY Act is part of a broader Republican-led legislative initiative dubbed “Crypto Week,” which includes two additional major digital asset bills aimed at modernizing blockchain regulation and the broader digital finance ecosystem.
Meanwhile, Donald Trump is preparing to issue an executive order that would open up U.S. retirement markets to cryptocurrencies, gold, and private equity. This order would allow 401(k) fund managers to incorporate alternative assets into retirement portfolios.
The move follows the rollback of Biden-era restrictions and the recent passage of three crypto-related bills in the House. While major investment firms have welcomed the proposal, critics warn that alternative assets may expose retail investors to greater financial risks.
Also last week, Bitcoin reached a new all-time high, pushing its market capitalization to $2.43 trillion. It has now surpassed Amazon, Google, and even silver, becoming the fifth-largest asset globally by market value.
Looking ahead, one of the key events on the economic calendar is Federal Reserve Chair Jerome Powell’s upcoming speech at an official central bank-hosted conference on Tuesday. This event comes just before the release of the preliminary S&P Global Purchasing Managers’ Indexes (PMIs) on Thursday. Given Trump’s escalating verbal attacks on Powell, a central question is whether this political pressure has influenced the Fed Chair’s stance.
Trump has repeatedly urged Powell to lower interest rates. This week, reports emerged suggesting that the President had discussed with some Republicans the possibility of removing Powell from his position. However, Trump was quick to downplay the reports, stating that the likelihood of Powell being dismissed was “very low.”
In this context, if Powell uses his speech to reassert the Fed’s independence and calls for patience to assess the impact of tariffs more thoroughly, the U.S. dollar may continue its recent upward trend. Still, it’s too early to confirm a definitive bullish reversal for the dollar. While the global reserve currency has responded positively to headlines fueling tariff concerns, markets could mirror April’s behavior—when fears of recession led investors to sell the dollar instead of buying it—should those concerns intensify again.

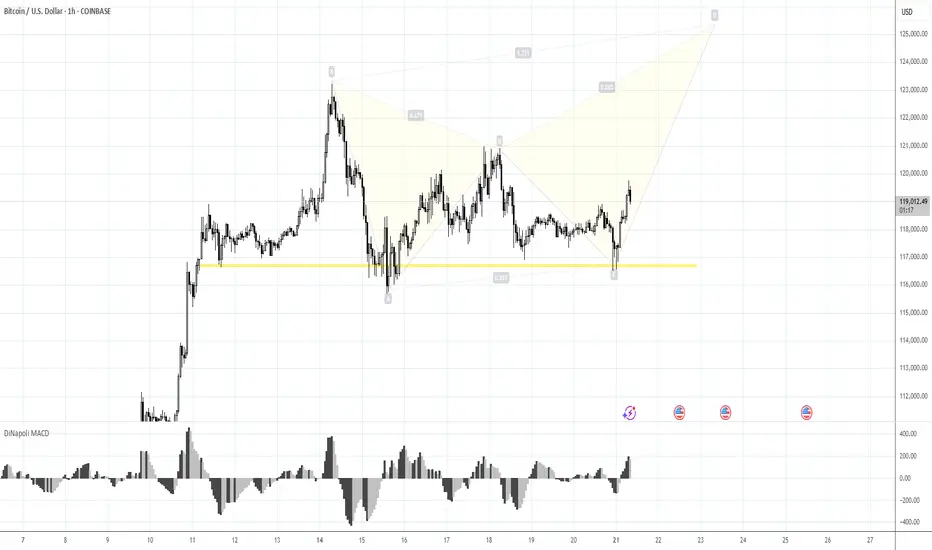
Risk 116. Target 123-125KMorning folks,
Prior 1H H&S was done, we were watching on 120K resistance area, as we said last time. Now, on 1H chart H&S is showing signs of failure - too extended right arm, no downside breakout. Price is taking the shape of triangle . All these signs are bullish. Because butterflies very often appear on a ruins of H&S, we suggest that this one could be formed here...
The risk level for this scenario is 116K lows - BTC has to stay above it to keep butterfly (and triangle) valid, otherwise, deeper retracement to 112K area could start.
Upside target starts from 123K top and up to 125K butterfly target.
Bitcoin: Genius is on the scene The U.S. House passed the Genius Act on July 17, following Senate approval in June. The bill sets comprehensive federal standards for stablecoins, clearing the way for banks and fintechs to issue them under clear reserve and audit rules. This represents a new milestone for the crypto market, and its leading coin - BTC. During the week, BTC managed to hold steady above the $118K. On Tuesday, there has been one attempt to push the price toward the $116, however, the price swiftly returned to the previous grounds. The highest weekly level reached was at $122,8K, reached on Monday, however, this level was also unsustainable. The majority of trades during the week were around $118,5K.
The RSI modestly moved from the overbought market side, ending the week at the level of 65. This could be an indication of a forthcoming price reversal, however, considering strong demand for BTC, such a move could be easily postponed. The MA50 started again to diverge from MA200, indicating that there will be no cross of two lines in the coming period.
BTC managed to hold levels above the $118K, which is an indication that investors are still not ready to sell in higher volumes, in order to take profits. The RSI is indicating potential for a short reversal, however, in the current circumstances, it might be postponed. A move toward the higher grounds is also quite possible, especially taking into account BTCs recent push toward the $122K. At this moment charts are pointing to equal probabilities for a move toward both sides. On one hand, the $116K support was indicated through price during the previous week, as well as the $122K. The start of the week ahead will determine which side will prevail in the week ahead.
Bullish Bitcoin!BINANCE:BTCUSD : Nothing Changed, Still Bullish
BTC still maintains a strong upward momentum. Immediate strong support was found again near 116K.
It seems that the market has set a new low for BTC around this area for now. We think that as long as BTC stays above this area, there is a good chance that the increasing volume and buyers will increase further pushing BTC further, as shown in the chart, to 120,600; 122,400; 125,000 and 127,000.
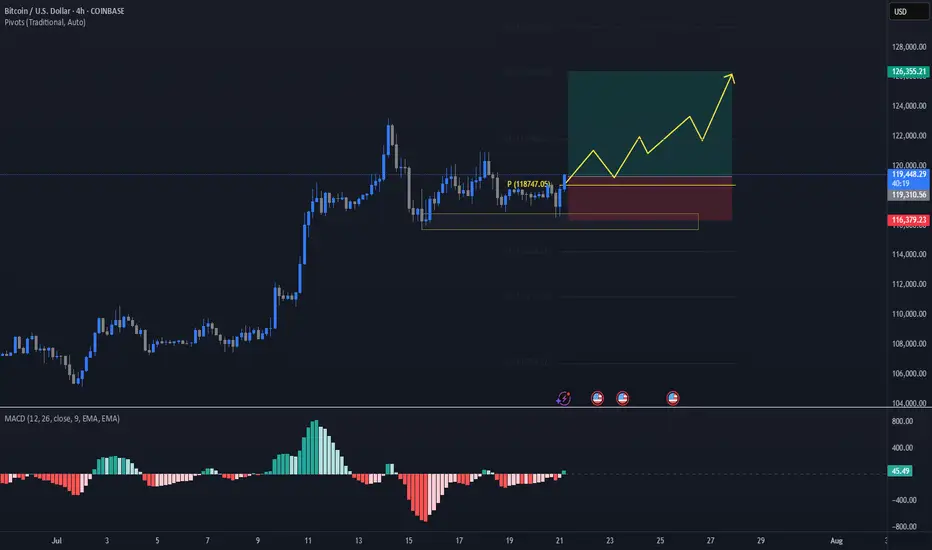
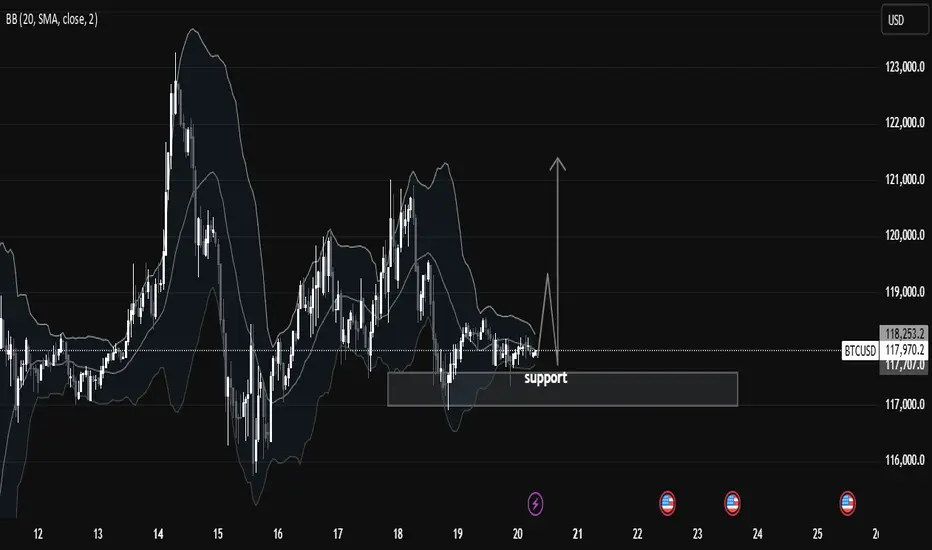
Chart Analysis: BTCUSD Consolidating at Key Support LevelIn this 1-hour BTCUSD chart, we observe that price is currently respecting a key support zone between $117,500 and $118,000, which has held strongly over the past few sessions. This region has acted as a strong demand zone, with visible buying pressure every time the price dips into it. The chart clearly shows multiple rejections from this zone, indicating that smart money participants are accumulating here.
We also see the Bollinger Bands (20 SMA) tightening around the price. This narrowing of the bands signifies low volatility and a potential expansion move. Such squeezes are often followed by impulsive breakouts or breakdowns, and traders should be alert for a decisive candle close above or below the range to confirm direction.
🧠 Market Structure & Technical Insights:
Support Holding: Price is consolidating above a major support level at $117,500–$118,000, which has been tested multiple times but not broken.
Accumulation Phase: The sideways structure after a previous impulsive move suggests that price is possibly in a re-accumulation phase before another leg up.
Liquidity Above Range: There's a visible liquidity pool above recent highs (~$118,600–$119,000), which could be targeted if bulls take control.
Volatility Squeeze: Bollinger Bands are compressing, showing signs of accumulation. Such patterns typically lead to a breakout move, especially if paired with volume.
Candle Behavior: Long wicks from below the support show aggressive buying interest, rejecting lower prices. This is a bullish signal.
🎯 Potential Scenarios:
1. Bullish Breakout:
If BTCUSD breaks and closes above the mini resistance near $118,600–$119,000, we may see a quick move toward $120,500 and $122,000.
A breakout backed by volume and momentum would confirm strength and trend continuation.
2. Bearish Breakdown:
A break below $117,500 with a strong bearish candle and increased volume would invalidate the bullish bias and may open the downside toward $116,000 and possibly $114,500.
This would indicate failure to hold support, transitioning into a distribution phase.
3. Range-Bound:
Until we get a clear break in either direction, price may continue to range between $117,500 and $118,600. Best approach is to remain patient and wait for breakout confirmation.
📚 Educational Note:
This is a textbook setup for many smart money traders—a compression near a strong support level with low volatility. Such patterns reflect market indecision, but also the potential energy build-up for a significant move. Traders should focus on risk management and confirmation instead of predicting direction blindly.
✅ Key Levels to Watch:
Support: $117,500
Resistance: $118,600 – $119,000
Breakout Target: $120,500 – $122,000
Breakdown Target: $116,000 – $114,500
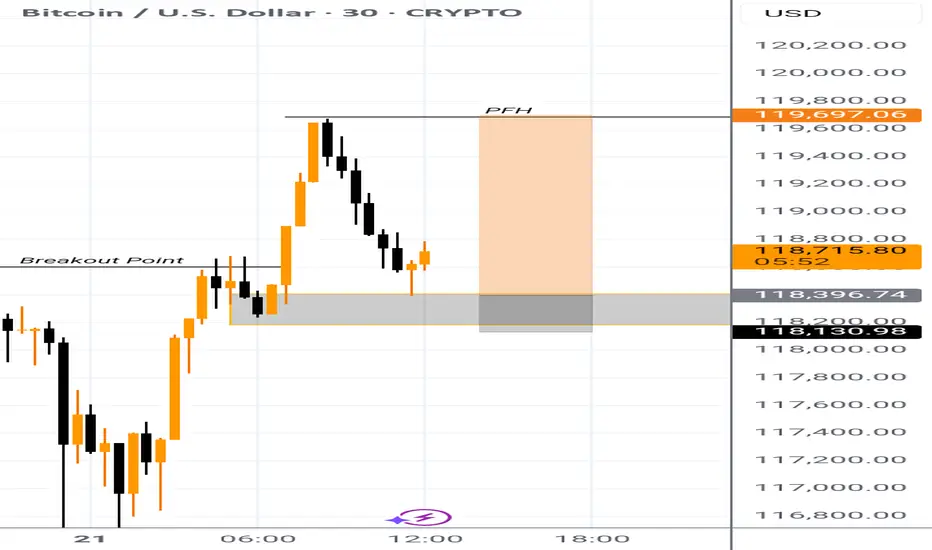
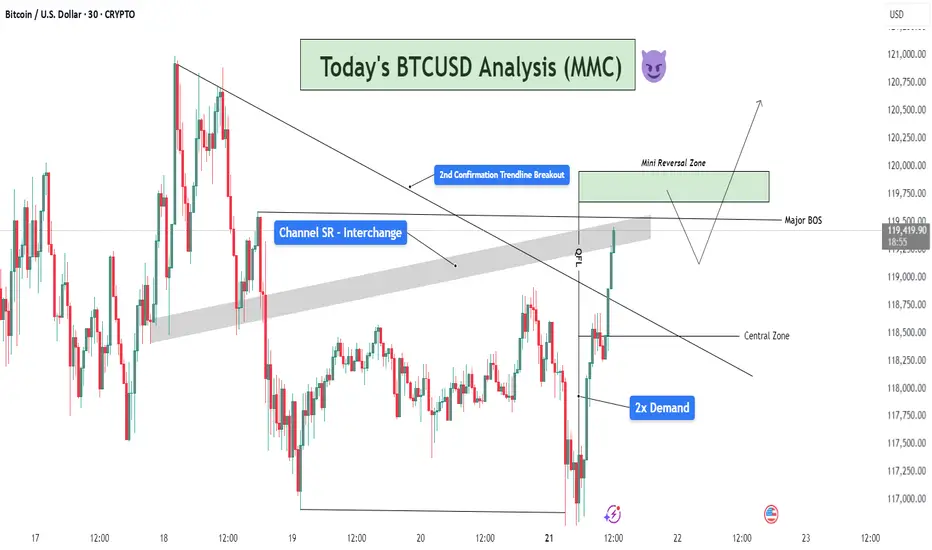
BTCUSD MMC Analysis - Breakout Confirmation + Reversal + TargetWelcome back to another deep-dive analysis powered by MMC (Mirror Market Concepts), where precision meets market psychology. In today’s BTCUSD setup, we’re observing a textbook confluence of structural breakouts, demand rejections, and liquidity zone engagements. Let’s break it down step by step.
📊 1. Market Context & Background
The market recently showed a prolonged bearish trendline structure, with lower highs compressing price into a wedge. The prior days have been consolidative, hinting at an accumulation phase. This forms the foundation for reversal setups we often identify in MMC-style analysis — where liquidity, not just structure, determines the next move.
🔍 2. Demand Zone Dominance – 2x Tap Confirmation
At the bottom of the chart, BTC created a strong 2x Demand Zone (117,250–118,000 area), a region where buyers aggressively stepped in. This zone had already been tested once, and the second tap confirmed demand strength — a key MMC signal.
This dual-tap created a spring effect, launching price upward and rejecting all downside liquidity grabs. It also showed clear absorption of sell-side volume.
📈 3. QFL Behavior + Break of Structure
We see a QFL (Quick Flip Liquidity) reaction just after price bounced from demand — this is a behavior unique to MMC models. Here, price flipped structure rapidly after breaking a local high near 118,500, suggesting aggressive buyer entry.
This QFL event served as the first warning for a major trend shift.
Right after that, we got a major BOS (Break of Structure) above 119,250, further confirming the bullish transition.
🪜 4. Trendline Breakout – Second Confirmation
The descending trendline — connecting several swing highs — was breached with strong bullish momentum. Importantly, this was the second confirmation breakout, not just a fakeout spike.
The breakout candle closed strongly above the trendline and above the SR channel zone (gray area), confirming trend reversal intent.
This aligns with MMC's multi-stage breakout logic, where price gives one trap, pulls back, and then breaks cleanly with intent.
🛡 5. Channel SR Interchange Zone (Support-Resistance Flip)
The gray horizontal SR Channel played a crucial role. Initially acting as resistance, it became support once the breakout was confirmed.
This interchange behavior — a principle where support turns into resistance or vice versa — is critical in MMC. Price flipping this zone and holding above is a strong continuation signal.
🧠 6. Targeting & Forward Outlook
Price is now approaching the Mini Reversal Zone (119,750–120,250). This is a low-timeframe liquidity zone where short-term traders may take profits or where institutional orders may reverse temporarily.
Here are two potential scenarios:
Bullish Continuation: If price pulls back slightly and holds the channel SR as support, we may see a continued leg upward, breaking above 120,250.
Temporary Rejection: A sharp reaction from the Mini Reversal Zone could lead to a retracement into the Central Zone (~118,800), where buyers might reload.
📌 Key MMC Takeaways:
✅ 2x Demand Zone reaction confirmed bullish interest.
✅ QFL + BOS + Trendline Break = High-conviction reversal signal.
✅ SR Flip adds MMC-style structural layering.
✅ Price is now navigating final supply zones before expansion.
👑 Join the Candle King Community
If you find value in these advanced MMC analyses, join the Candle King server — a professional community focused on refining trading journeys through advanced market theory like Mirror Market Concepts, QFL, and real-time price logic.
📢 We don’t just trade levels — we trade behavior.
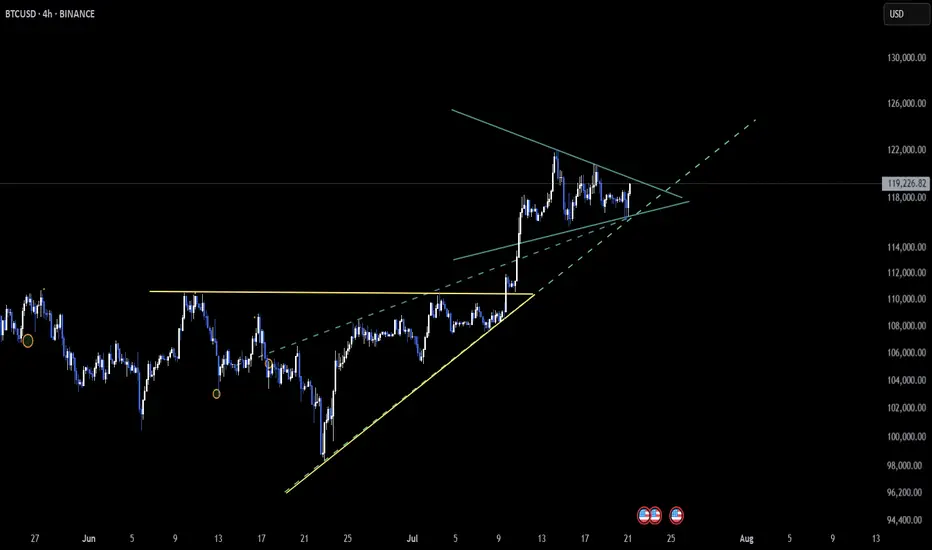
BTC – Symmetrical Triangle Tightens the Market CoilCRYPTOCAP:BTC is navigating a symmetrical triangle on the 4-hour timeframe 📊. This pattern typically signals a build-up of pressure before a decisive move.
As price action compresses toward the apex, the market is setting the stage for either a breakout surge or a breakdown slip ⚡️.
Patience is key here—traders are watching closely to catch the next wave of momentum.
Eyes on the chart 👀
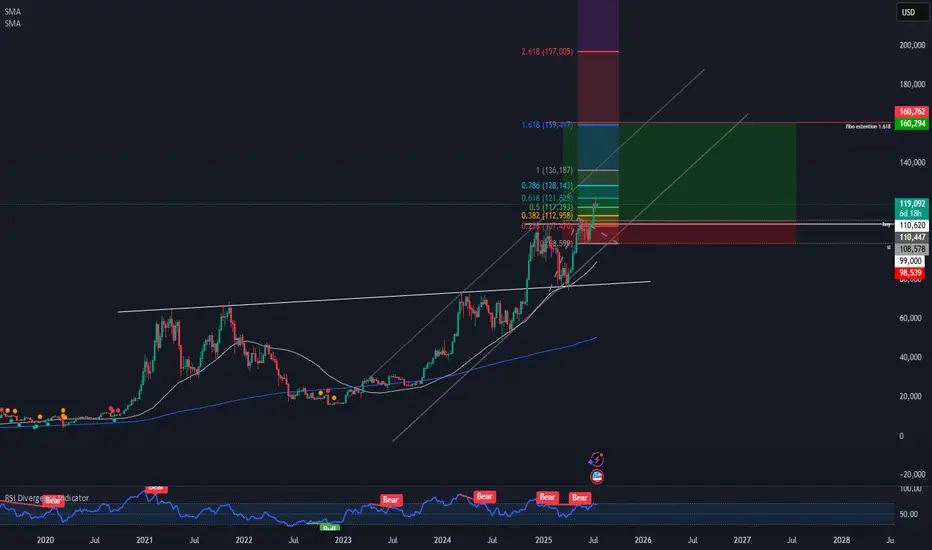
FIBO EXTENTION TARGET 1.618We have a big breakdown here and the next target based on the Fibonacci extention is 160,000.
Btcusd techinical analysis.Btcusd techinical analysis next move posibale at h1 time frame.not finchinal advice.
