Bitcoin confirmation of a pull back before the sell pressure Confirmation of a pull back before the sell pressure ..... so we are to hold all our sell positions
BTCETH.P trade ideas
BTC going back to the trenches to schemeBTC/USD – Bearish Pullback to $110,000 Incoming?
Technical Overview:
Bitcoin is currently showing signs of exhaustion after reaching the $125K–$130K resistance zone, which aligns with the upper boundary of the long-term ascending channel formed since the $20K breakout. RSI is flashing strong bearish divergence on the daily and weekly timeframes, suggesting the bulls are losing momentum.
The price also failed to hold above the key psychological level at $120K, now acting as strong resistance. A decisive break below the $115K support zone could trigger a broader correction down toward $110,000, which marks the following confluences:
0.382 Fibonacci retracement of the last impulse from $95K to $130K
High-volume node on the VPVR (Volume Profile Visible Range)
Retest of the previous macro breakout level (former resistance now potential support)
Macro Factors:
Growing speculation of delayed rate cuts from the Fed is putting pressure on risk-on assets, including crypto
Whales and institutional players have been seen rotating out of BTC into altcoins and cash in recent on-chain data
ETF inflows have slowed dramatically compared to earlier in the cycle
Conclusion:
Unless BTC can reclaim $120K with strong volume, the path of least resistance looks like a healthy correction toward $110,000, where stronger demand may kick in. This could provide a better risk-reward entry for long-term bulls.
🚨 Watch for a daily close below $115K to confirm bearish!
Bitcoin - The cycle is just starting!⚔️Bitcoin ( CRYPTO:BTCUSD ) just created new highs:
🔎Analysis summary:
Bitcoin is currently - especially with the new all time high breakout - just perfectly following previous cycle behavior. Since there is no real resistance above current price, apart from psychological levels, I do expect a substantial rally back to the upper channel resistance trendline.
📝Levels to watch:
$300.000
🙏🏻#LONGTERMVISION
Philip - Swing Trader

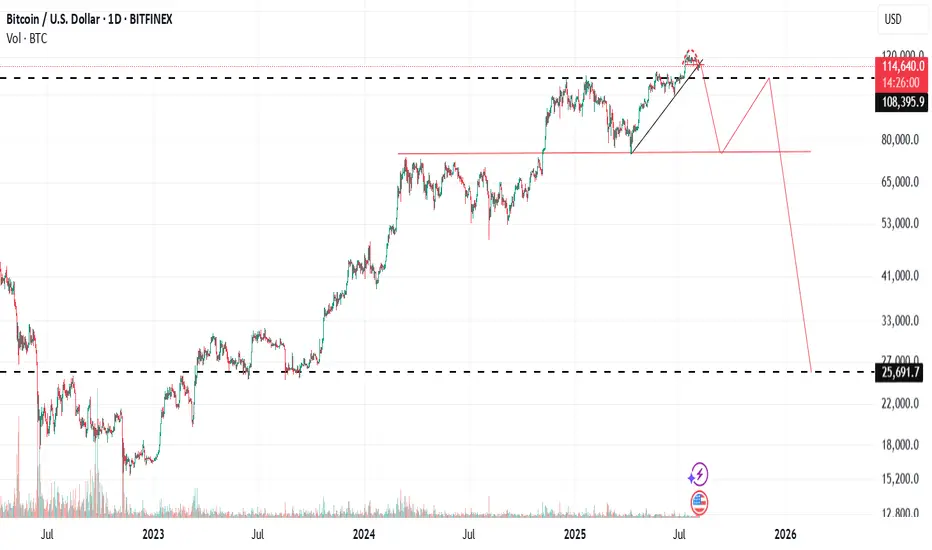
Potential BITCOIN HUGE BEARISH PATTERN PRINTING OUT It certainly fits from my perspective. A nice overdue correction that fits its approximate prior trough corrective range level. As above so below. In Nov 2022 the classical TA bottom pattern was an inverted head & shoulders.
BTCUSD Possible senarioas long as the price is above this suport BTCUSD is bullish and if price drops below these support then short term bearish may be possible. let us see. currently price is rejecting from fib 0.5 of recent swing

Building Risk Capacity From the Inside Out | Ep. 5A deep recalibration for traders stuck in a cycle of overtrading, fear, and nervous system overload... This is one of the most significant episodes in the "Rebuilding the Trader Within" series to date.
I strongly recommend watching this in a quiet space, with an open mind, and without distractions, so that the message can sink in deeply. This episode is not one to rush through. It’s a personal and practical breakdown of how to gradually increase your capacity to hold risk, not just technically, but internally.
You'll walk away with:
✅ A practical understanding of how your inner state affects trade execution
✅ How breath awareness can regulate your nervous system in live market conditions
✅ Why expanding your risk capacity starts from the inside out
✅ Practices that help you build internal stability as your trading ambitions grow
This is for traders who are done pretending and ready to evolve.
I’d love to hear what resonates with you. I’m still learning too, and the more we share, the stronger we grow as traders.
#forex #tradingpsychology #riskmanagement #riskcapacity #traderwithin #mindset #innerwork #forexeducation #selfsabotage #tradergrowth #emotionaldiscipline #TraderMindset #RebuildingTheTraderWithin #ForexMentorship #TraderGrowth #ForexPsychology

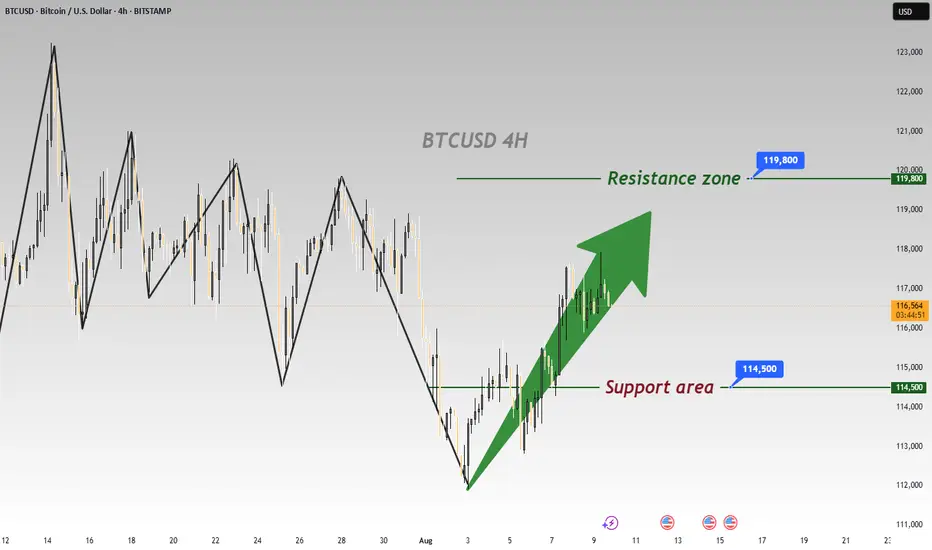
Go long again when it pulls backWhen BTC was around 112500 last week, I mentioned that it would rebound to at least 116500 📢, which was a great opportunity to go long 💰. As expected, after fluctuating in the low range for two days, it rebounded immediately🏹, peaking at 118000. It may still continue to rise, hit the 120000 threshold again🌟, and then pull back upon encountering the first resistance🌡️
⚡️⚡️⚡️ BTCUSD ⚡️⚡️⚡️
🚀 Buy@ 114000 - 114500
🚀 TP 116000 - 117000 - 118000
Daily updates bring you precise trading signals 📊 When you hit a snag in trading, these signals stand as your trustworthy compass 🧭 Don’t hesitate to take a look—sincerely hoping they’ll be a huge help to you 🌟 👇
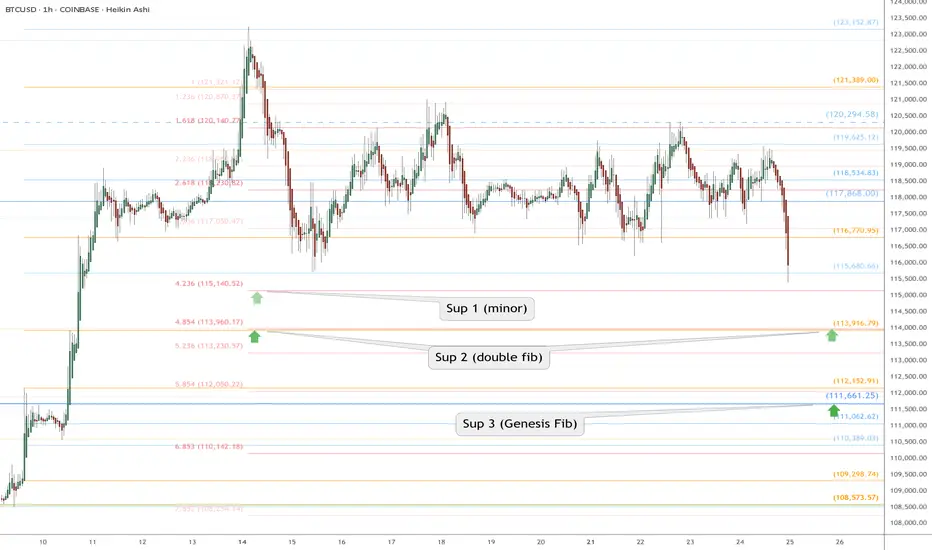
BTC Retrace RoadMap and 3 nearby supports worth watching NOWThis is a near-term followup to my big picture linked below.
Dip is underway after orbiting our Genesis Fib at 117.9k.
Quickly approaching the next three supports worth watching.
Supports get stronger below but each one needs to slow the dip.
$ 115,140 is a minor fib but possible end of dip wave.
$ 113,9xx is a double fib that should be pretty strong
$ 111,661 is the sister Genesis fib, and a MUST HOLD
.
Big Picture chart and why 117.9k was KEY
=======================================================
.
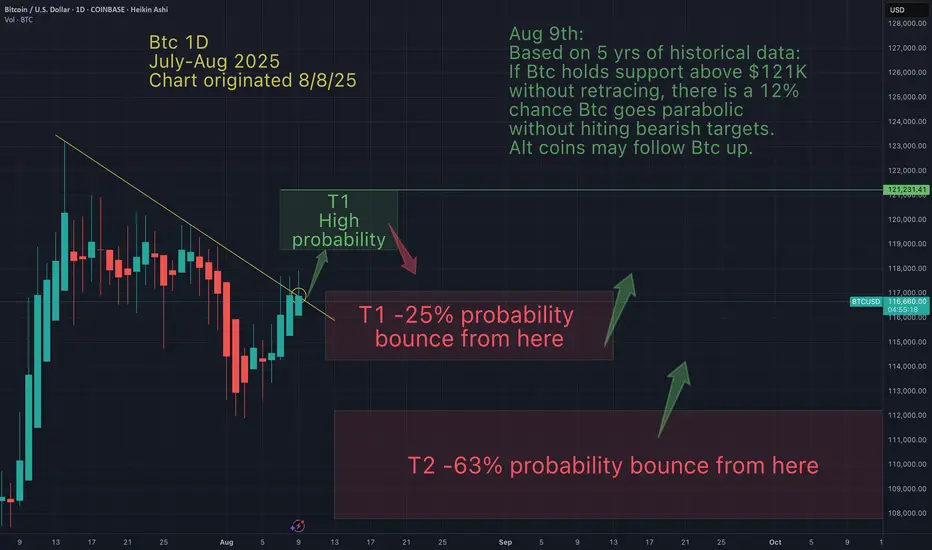
Is Btc doing what it ALWAYS does?Based on 5 yrs of historical data with 16 iterations (and 6 hours of my data collection), here are my findings:
If Btc holds support above %121K without retracing, there is a 12% chance Btc goes parabolic
(without hiting bearish targets). Alt coins may follow Btc up.
Otherwise , there is a much greater probability Btc will retrace to my T1 or T2 (red) after hitting my bullish T1 (green). Then I expect a bounce.
May the trends be with you.
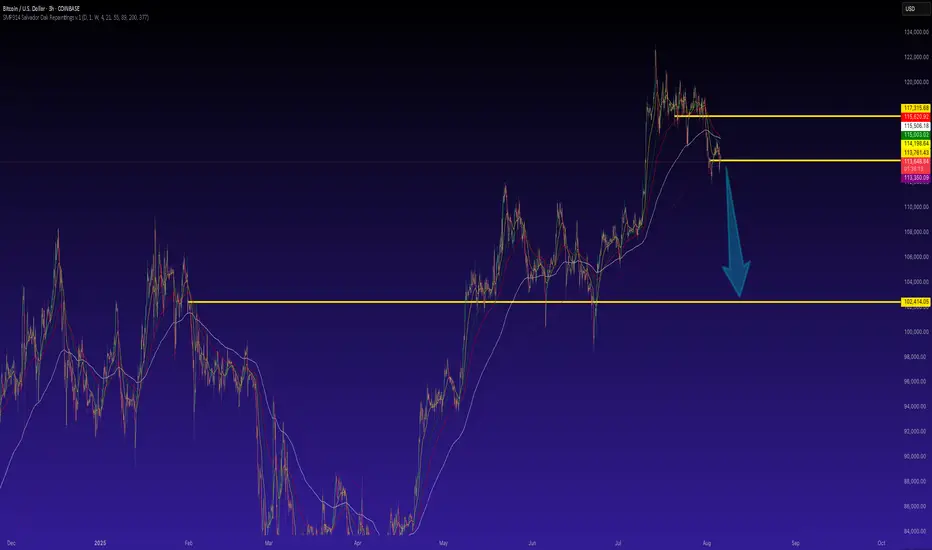
BTC to 102,000 rangeBehold the ultimate BTC trading analysis, powered by my top-secret pyramidal formula—an arcane cocktail of Fibonacci retracements, on-chain metrics, and dark-tomb alchemy. This isn’t your garden-variety RSI or MACD: it was forged deep within the Great Pyramid, scrawled on papyrus scrolls by hieroglyph-obsessed high priests and fiercely guarded by golden-scaled gryphons with laser eyes.
Here’s how it works (in plain English, I promise):
Pharaoh’s Pivot Points
– We map Bitcoin’s key support and resistance by aligning its price swings to the pyramid’s four cardinal chambers.
– Legend says if Bitcoin’s closing price hits the “Antechamber Zone,” a mythical jackal-headed deity winks—and that’s our buy signal.
Gilded Sphinx Sentiment
– We scrape social-media chatter and on-chain flow, then run it through the Sphinx’s riddle engine: positive sentiment that solves the riddle? “Scale the walls!” Negative or puzzled? “Hide in the catacombs.”
Ra’s Sun-Cycle Candle Filter
– Candles are filtered by “solar alignment”: only those that close during daylight hours in Cairo count as “true” candles. (Yes, timezone spells matter.)
Anubis’ Volume Veil
– Volume spikes are measured against the weight of gold bars said to fill the hidden treasury. If trading volume exceeds “10,000 pharaoh-ounces,” expect a market ritual—er, a breakout.
Tomb-Run Trend Confirmation
– We draw trendlines not from your usual swing highs, but from cryptographic glyphs unearthed in the King’s Chamber. Connect three glyph-points and voilà: the “Tomb-Run Trend.”
Combine all five, and you’ve got a trading blueprint more secret than Cleopatra’s beauty regimen. Use it wisely—lest the mummy curse of overleveraging strike!
Bitcoin: Well defined consolation zoneI have had no real forecast for this market. The imbalances that have presented are formed in a consolidatory manor.
DXY is also in a strange place making it hard as well.
I am seeing sideways motion until we get a nice bullish close
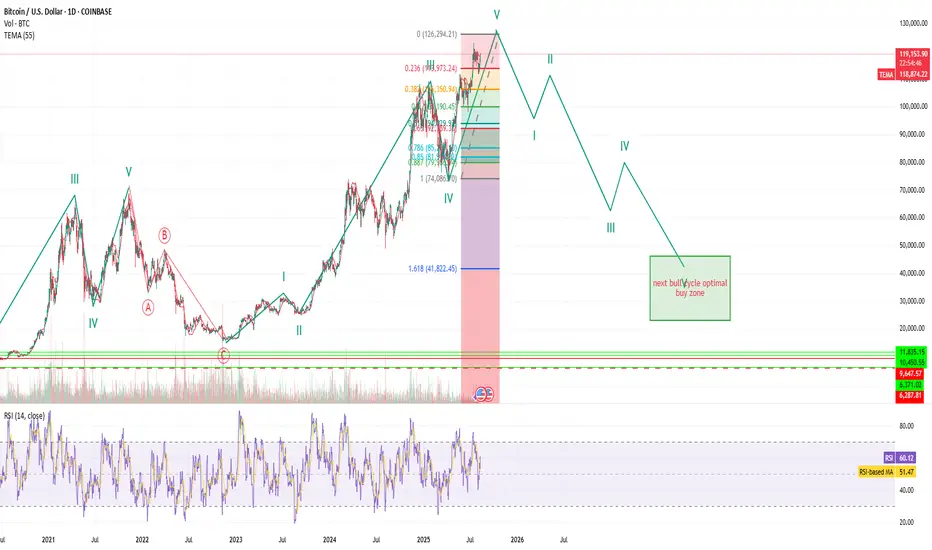
some continuation thru fall for BTC and cryptominor upside continuation for BTC with current price action into fall. Likely top in October.
BEAR market will begin after this and continue thru next year. Target at bottom of range (see highlights on chart regarding optimal buy zone) for start of next bull cycle. COINBASE:BTCUSD
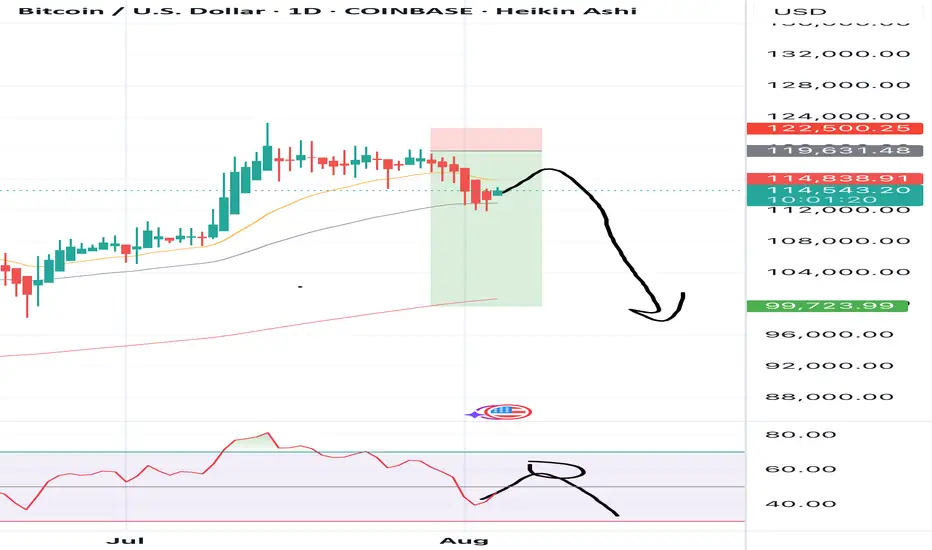
BTCUSD broke below 115,000.00 on week labor dataBTCUSD broke below 115,000.00 on week labor data
On August 1, after worse-than-expected NFP report data came out, bitcoin dropped below important level of 115,000.00 and SMA200 on 4-h chart. Technically, this means the start of a mid-term bearish market in the asset. Bitcoin often follows the same path as high-risk assets, such as tech stocks, particularly during times of economic uncertainty. The July 2025 U.S. jobs report, which showed only 73,000 new jobs added, below the expected 100,000, and a downward revision of June's figure from 147,000 to 14,000, fueled fears of a recession. This caused a broader market sell-off. In just 12 hours, $110 billion was withdrawn from spot crypto markets, with $630 million in liquidations, primarily affecting long positions.
Currently the price is testing the 115,000.00 level. The next decline towards 110,000.00 support level is expected.

BTC CONSOLIDATESBitcoin pushed as high as $123,000 after breaking out of its $105,800–$112,000 range in early July – but momentum has since cooled. Price is now consolidating just above the $112,000 breakout zone, with the rising 50‑day MA providing support around $113,000.
So far, this still looks like a healthy pullback. Volume has faded on the way down – not what you'd expect in true distribution. As long as $112,000 holds, the higher‑low structure remains intact and the chart stays bullish.
A bounce here keeps the trend alive and sets up another attempt at $123,000. A daily close below $112,000 flips the script short term, likely sending price back toward $105,700.
Until then, it’s just consolidation after a strong move – not a breakdown. The trend is still your friend.

Trumponomics 2.0 – Chaos on the Left, Crypto on the Right🧨🗽 Trumponomics 2.0 – Chaos on the Left, Crypto on the Right 🧠💸
The system is shaking, and Trump is rolling the dice—again.
Geopolitical tensions are exploding:
🇮🇳 India hits back on tariffs
🇨🇳 China flexes tech dominance
🇷🇺 Russia & 🇺🇦 Ukraine face renewed pressure
💣 Wars rage in Ukraine and Gaza
📉 Bonds sell off
💵 The U.S. dollar? Fund managers are the most bearish in 20 years
And in the middle of this storm:
Trump floats an executive order allowing crypto into 401(k) retirement plans.
That’s Trumponomics 2.0 — the new age of controlled chaos, currency doubt, and crypto as the unexpected golden child. It’s messy. But for Bitcoin? It’s momentum.
📊 While the headlines scream uncertainty, the BTC chart quietly reclaimed the key structural level at $115,800. This isn't just price action — it's macro meets technicals, and BTC is the beneficiary.
💥 As I’ve said: I’m hedged.
✔️ Long BTC
❌ Short S&P 500
My recent idea “Bitcoin vs S&P 500 – Ratio Signals Strength” explains exactly why this positioning continues to pay. ( )
🎯 Levels to watch:
Major Support: $115,800
Next Resistance: $122,795 → $132,595
Risk Below: $109,768
Let the media debate Trump. Let the markets debate Powell. I’ll stick with what the charts are saying.
Because the story isn’t just crypto in 401(k)s.
The story is this:
Crypto is being chosen while the system is questioned.
One Love,
The FX PROFESSOR 💙
Disclosure: I am happy to be part of the Trade Nation's Influencer program and receive a monthly fee for using their TradingView charts in my analysis. Awesome broker, where the trader really comes first! 🌟🤝📈

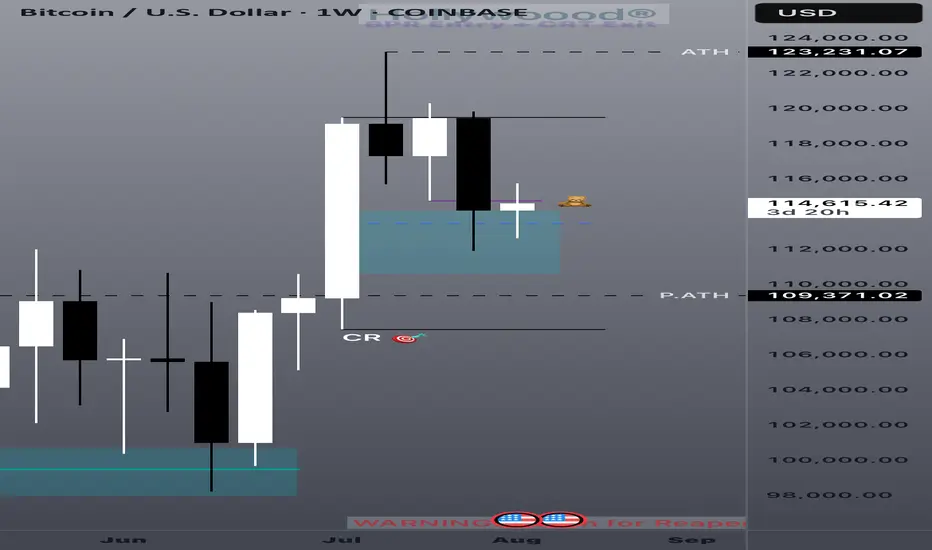
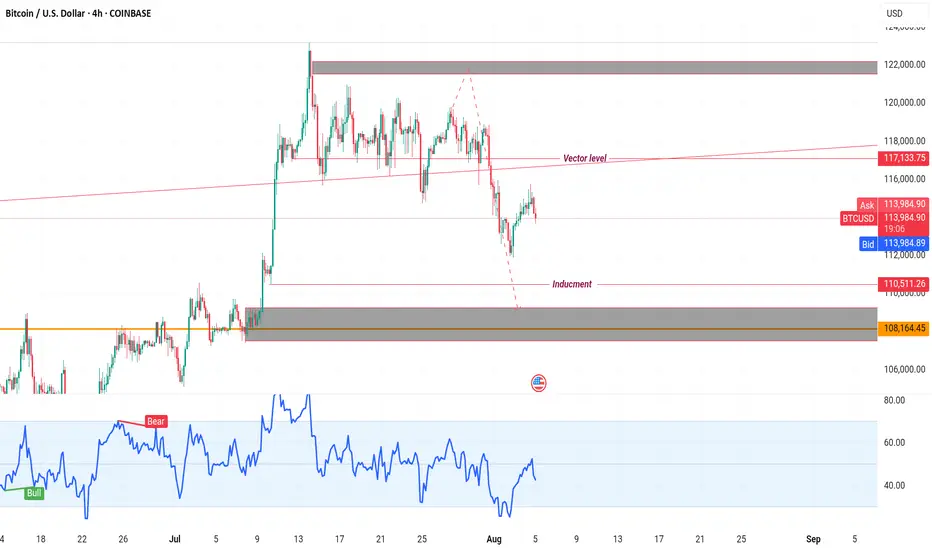
Bear trap on its way - Bitcoin Weekly Update August 4-10thThis week brings a series of macroeconomic and geopolitical developments that may influence global risk sentiment and, consequently, Bitcoin’s price trajectory.
On Monday, the U.S. releases Factory Orders, a key indicator of industrial demand. Surprises in this data can affect risk assets broadly, as they reflect business investment activity. Weak numbers would likely increase expectations of monetary easing, which tends to support Bitcoin.
On Tuesday, the spotlight turns to the ISM Non-Manufacturing PMI, a leading indicator for the U.S. services sector, which accounts for roughly 70% of GDP. A significant deviation from expectations—especially a decline—could reinforce rate-cut expectations and provide tailwinds for speculative assets like Bitcoin.
Thursday is a critical day, with the Bank of England's interest rate decision in focus. While direct effects on crypto are limited, a hawkish stance could weigh on global risk appetite if inflation concerns resurface. Also on Thursday, the U.S. releases its weekly Initial Jobless Claims—a timely barometer of labor market strength. A rising trend here would suggest economic cooling, strengthening the case for looser policy and potentially benefiting crypto.
However, the most geopolitically sensitive event this week is the reintroduction of country-specific reciprocal tariffs by the United States, taking effect on August 7. Affected countries include Canada (35%), Mexico (30%), and Brazil (50%). These measures could re-escalate trade tensions and trigger short-term market volatility. Retaliatory responses from these countries would likely fuel risk-off sentiment, pressuring assets across the board.
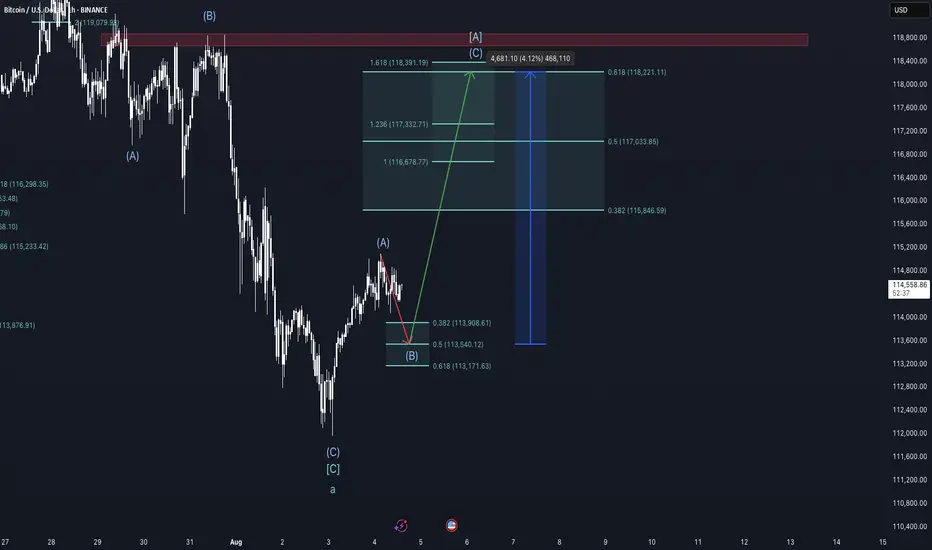
From a technical standpoint, Bitcoin remains within a multi-degree corrective structure according to the Elliott Wave framework. On the cycle degree, we are in a B-wave; on the primary degree, in an A-wave; on the intermediate degree, in a B-wave; and on the minor degree, in a C-wave. This implies that a short-term move lower is still expected, but once complete, a relief rally of approximately 4% could follow before the onset of a larger correction, likely Primary Wave B.
Chart structure suggests that Minor Wave C is in its late stages. Early signs of exhaustion, such as waning downside momentum or bullish reaction at key support zones, could offer clues of an approaching bottom. However, such a rebound should be viewed as temporary and not a trend reversal.
Taking a view between the lines on the on-chain data, the liquidity heatmap shows major liquidity around the red rectangle drawn into the chart, suggesting higher prices. Also, the rather low funding rate on futures suggest an exhausted downward trend and a trend reversal in the near future is likely.
Conclusion:
This week’s calendar offers several macroeconomic catalysts with the potential to move markets. U.S. economic data and tariff policy developments will likely shape near-term sentiment. Technically, Bitcoin remains in a corrective phase with limited downside left before a short-term recovery becomes more probable. Traders should stay alert for signs of a local bottom to position for a tactical bounce—but be cautious, as a larger correction likely looms beyond that.
This is no financial advice and for educational purposes only.
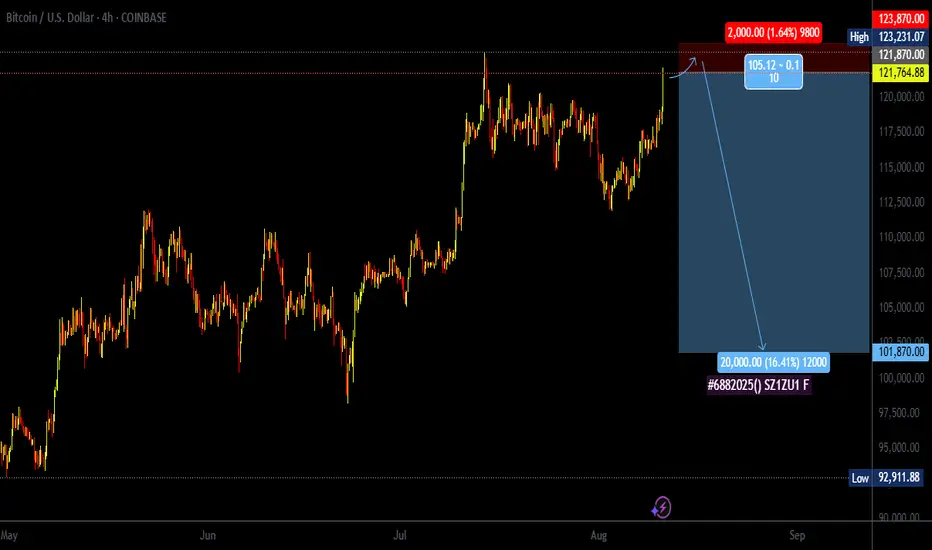
#6882025 | BTCUSD Supply Zone 1:10BTCUSD Supply Zone Appears in D1 Time Frame Looking Price Action for Long Term Sell
Risk and Reward Ratio is 1:10
After 50 pips Profit Set SL Entry Level
"DISCLAIMER" Trading & investing business is "Very Profitable" as well as risky, so any trading or investment decision should be made after Consultation with Certified & Regulated Investment Advisors, by Carefully Considering your Financial Situation.
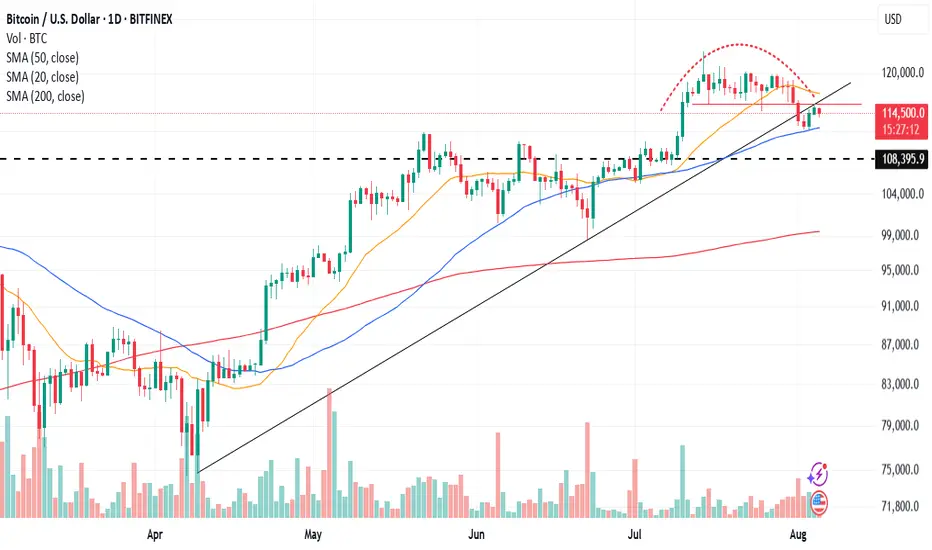
Bitcoin Rounding Top & April's Uptrend Line BreachAs an update to one of my prior ideas. The prior idea had mentioned that what may have appeared to be a bullish pattern on a lower time frame may have been misleading. I had pointed out why on higher time frames. Here is an update:
A Rounding top appears to have formed along with a breach of the April low's uptrend. The breach found support on the 50dma, then snapped back and retested the breached uptrend line. A downward continuation would be the most probable direction for price to trend within this scenario, in my humble opinion.
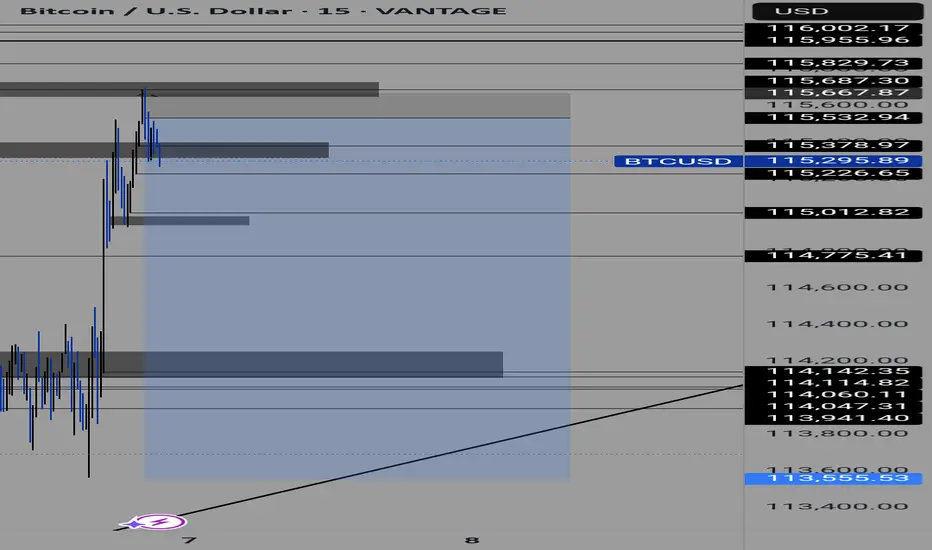
BTCUSD - Right to the point!In the last post (see the Linked Chart), I showed why BTCUSD would fall, and I also pointed out where the first price level for a possible pause might be.
On Friday, that level was reached, and the market seems to be turning *on the dot*. Will we now see higher prices again, or even a new all-time high? Let’s take a closer look:
The “confluence” point is marked by the white fork and the yellow modified Schiff fork. This point lies exactly on the 1/4 line. And this line often indicates temporary levels where at least a pause in the movement can be expected.
When we look at what Bitcoin did at this price level in mid-June, it seems likely that it will rise again. The overall pattern, from the centerline to the 1/4 line, looks extremely similar (see the A-B-C Wave Pattern)!
And yet, I’m not entirely convinced by the picture. Because this was the second time we reached the centerline.
For the brave, this wouldn’t be a bad entry point—or an opportunity to increase the position after this pullback. A possible stop for traders could be placed just below the current low, with targets at the centerline of course.
But why not just lean back, enjoy the profits, and switch into observation mode for now…
I will also make a video that explains the details and connections more clearly.
Happy Monday and stay patient to fight the FOMO! §8-)

BTCUSD Bearish Correction and retest of W formationPossible correction to the downside following a breakot out of a Double Bottom pattern on H1

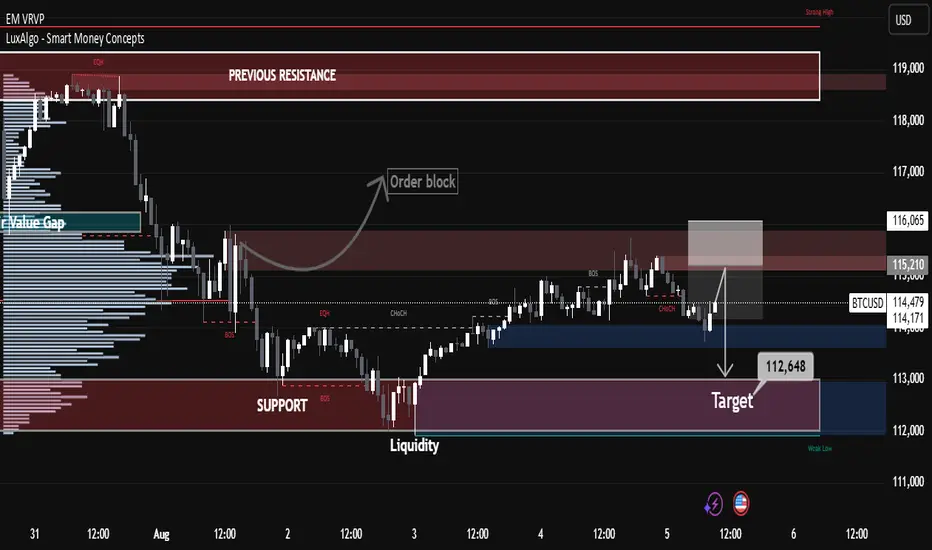
BTCUSD Technical Analysis – Smart Money Concept Based
🔍 BTCUSD Technical Analysis – Smart Money Concept Based
🕒 Timeframe: Intraday (likely 1H or 4H)
📅 Date: August 5, 2025
📉 Price: ~114,445 USD
📌 Key Zones and Observations
🔴 Previous Resistance (117,000–119,000)
This area has a strong high formed after multiple equal highs (EQH), indicating a liquidity pool above.
Price sharply rejected this zone, validating it as a significant supply zone.
🔵 Support Zone & Liquidity Pool (~112,600–113,200)
This is a high-volume node (visible on VRVP) where price consolidated previously.
Market structure suggests liquidity resting below, as indicated by the marked “Target” area at 112,648.
Smart Money may aim to sweep liquidity below this support zone before any meaningful reversal.
🟤 Order Block & Rejection at 115,210–116,065
Price tapped into a bearish order block, creating a minor change of character (ChoCH) and then started to decline.
Rejection from this zone signals distribution by institutions or Smart Money, leading toward bearish continuation.
🟢 Value Gap and Imbalance (Above 115,000)
A visible value gap still remains unfilled; however, current momentum is bearish, and price failed to reclaim it, hinting downside continuation.
🔄 Market Structure
BOS (Break of Structure) to the upside confirmed short-term bullish momentum.
CHoCH back to the downside near current price reflects bearish shift in order flow.
Price is respecting lower highs, and failing to break above 115,210 confirms a bearish bias.
🎯 Target and Outlook
Primary Bearish Target: 112,648 USD
This is a liquidity pool and previous support area where institutions may look to rebalance and accumulate.
Scenario:
If price retests 115,000–115,210 again and fails, expect strong continuation downward toward the 112,648 target.
If price breaks and holds above 116,065, bullish invalidation may occur, and we can look for higher retracement toward 117,000–119,000.
✅ Conclusion
BTCUSD is currently respecting a bearish order block, with Smart Money likely targeting liquidity resting below at 112,648 USD. Unless price breaks above 116,065 with strong volume, the bias remains bearish short-term.
BTC on high time frame
"Hello traders, regarding Bitcoin, as previously mentioned, BTC is in the process of completing its pullback to the 110k zone. Candle formations indicate increasing bearish momentum on higher time frames. In my view, when the price reaches 110k, it will be a crucial point to assess and consider the next potential price level."
If you need further assistance or have more details to discuss, please let me know!
Bitcoin at $117,000?After a deep correction, Bitcoin started an upward trend yesterday and is now at the midline of the 4-hour channel.
The signs suggest that Bitcoin might possibly reach \$117,000.
