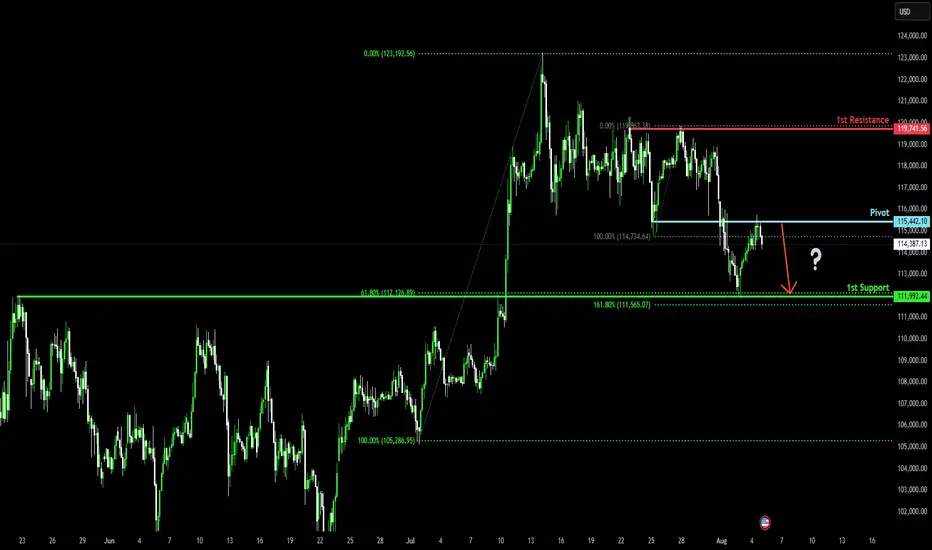
Bearish drop?Bitcoin (BTC/USD) has rejected off the pivot and could drop to the 1st support, which aligns with the 61.8% Fibonacci retracement.
Pivot: 115,442.10
1st Support: 111,992.44
1st Resistance: 119,741.56
Risk Warning:
Trading Forex and CFDs carries a high level of risk to your capital and you should only trade with money you can afford to lose. Trading Forex and CFDs may not be suitable for all investors, so please ensure that you fully understand the risks involved and seek independent advice if necessary.
Disclaimer:
The above opinions given constitute general market commentary, and do not constitute the opinion or advice of IC Markets or any form of personal or investment advice.
Any opinions, news, research, analyses, prices, other information, or links to third-party sites contained on this website are provided on an "as-is" basis, are intended only to be informative, is not an advice nor a recommendation, nor research, or a record of our trading prices, or an offer of, or solicitation for a transaction in any financial instrument and thus should not be treated as such. The information provided does not involve any specific investment objectives, financial situation and needs of any specific person who may receive it. Please be aware, that past performance is not a reliable indicator of future performance and/or results. Past Performance or Forward-looking scenarios based upon the reasonable beliefs of the third-party provider are not a guarantee of future performance. Actual results may differ materially from those anticipated in forward-looking or past performance statements. IC Markets makes no representation or warranty and assumes no liability as to the accuracy or completeness of the information provided, nor any loss arising from any investment based on a recommendation, forecast or any information supplied by any third-party.
BTCETH.P trade ideas
BTCUSD BUY 109270On the daily chart, BTCUSD is experiencing a pullback from its highs, with short-term bears taking advantage. Currently, attention can be paid to the support level near 109270, which is a potential buy level for a bullish bat pattern and is within the previous demand zone.

Bitcoin DumpsBitcoin is putting in a textbook retest here. Price bounced cleanly off support at $112,000 – a key horizontal level that also lines up perfectly with the rising 50-day moving average. That’s classic technical behavior. The bounce looks good on the surface, but it came on low weekend volume, which always warrants a bit of caution. There’s not much conviction behind the move yet.
Looking under the hood, the RSI still hasn’t reached oversold levels, even after a pretty sharp drop from the highs. That’s notable, especially since we saw a clear bearish divergence at the top – price made a higher high, but RSI made a lower high, signaling momentum was already fading. Until we get a stronger reaction and volume pickup, this might just be a pause before another leg down.

BTCUSD broke below 115,000.00 on week labor dataBTCUSD broke below 115,000.00 on week labor data
On August 1, after worse-than-expected NFP report data came out, bitcoin dropped below important level of 115,000.00 and SMA200 on 4-h chart. Technically, this means the start of a mid-term bearish market in the asset. Bitcoin often follows the same path as high-risk assets, such as tech stocks, particularly during times of economic uncertainty. The July 2025 U.S. jobs report, which showed only 73,000 new jobs added, below the expected 100,000, and a downward revision of June's figure from 147,000 to 14,000, fueled fears of a recession. This caused a broader market sell-off. In just 12 hours, $110 billion was withdrawn from spot crypto markets, with $630 million in liquidations, primarily affecting long positions.
Currently the price is testing the 115,000.00 level. The next decline towards 110,000.00 support level is expected.

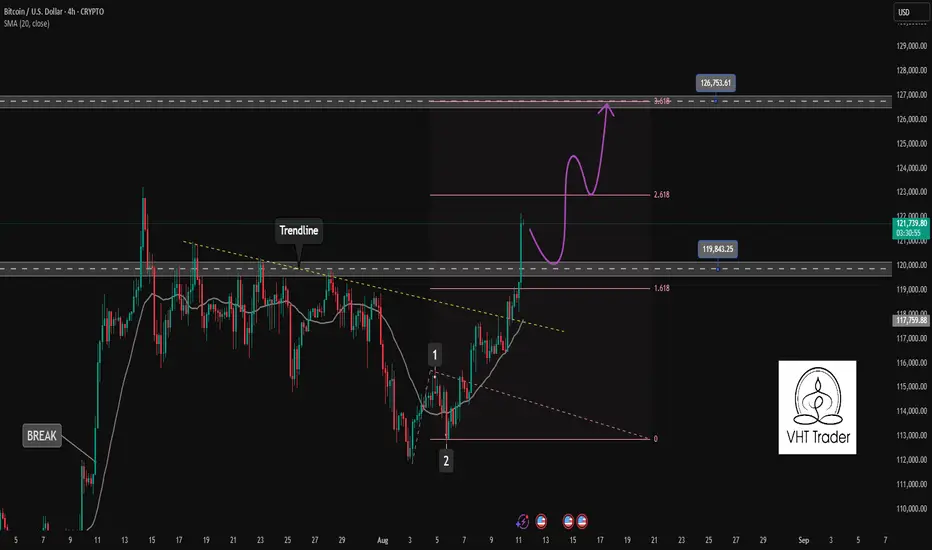
BTCUSD is running wave 3 of the Elliott wave pattern✏️BTCUSD forms a bullish wave after the end of the correction wave at the support zone around 112000. The bullish Dow 2 pattern is formed when there is confirmation of a candle above 115500. Currently, BTCUSD is running wave 3 of the Elliot wave theory and the absolute principle is not to trade against the trend of the main wave. Wait for the profit-taking wave of investors so that the BTC price can adjust to buy towards the Fibonacci zone 3.618.
📉 Key Levels
Buy Trigger: Retest and rejection at the support zone 120,000
Target 127000
Leave your comments on the idea. I am happy to read your views.
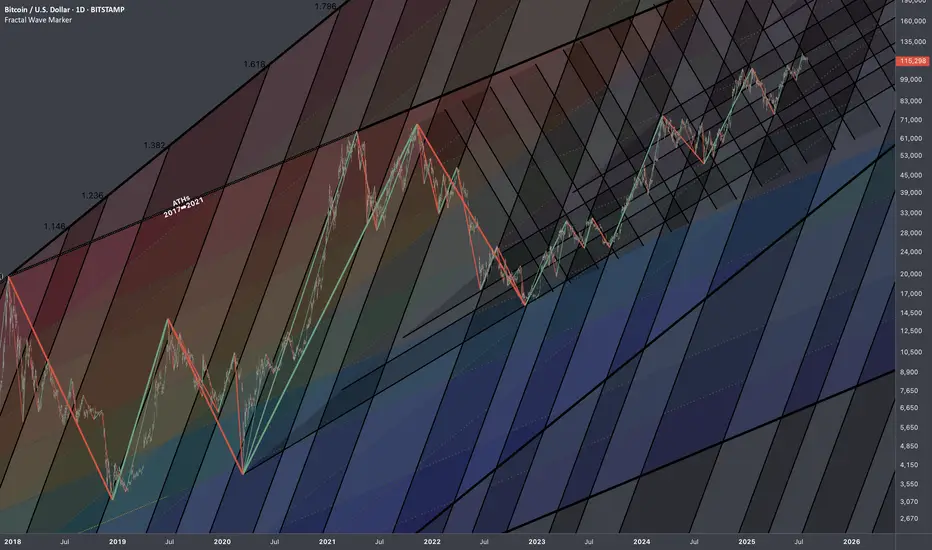
Bitcoin: Interconnections Rewired🏛️ Research Notes
Keeping fib channel of the rising trend angles as they've number of times covered well that aspect of cycle texture.
The other frame of reference would be with fib channel that covers drop from 2021 ATH to late 2022 bottom.
Last bit would be integrating fib channel discovered while ago that connects covid & late 2022 bottoms
Together they create a framework that addresses the complexity and makes even the most chaotic price movements seem to be a part of structural narrative.
Bullish Bat PatternI'm seeing a possible bullish bat pattern before we go for further upside. The optimal trade entry would be around the FVG...

Bitcoin BullishAfter exiting a correction, the first impulse (Wave 1) appears. I expect a retracement of at least 50% of the Fibonacci.

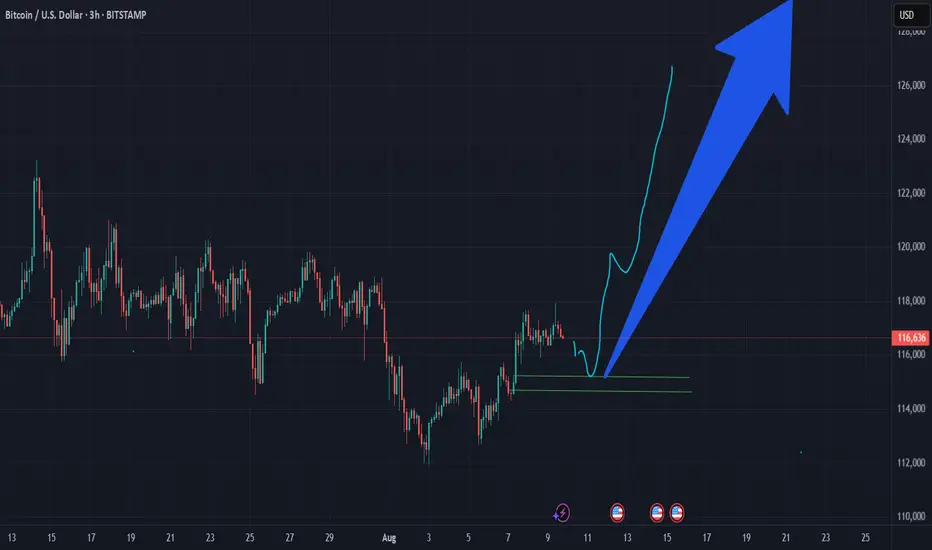
Last Chance to BUY BTC under $120KBTC Should drop to around the 115K mark and bounce quickly to 120K before reaching new ATH.
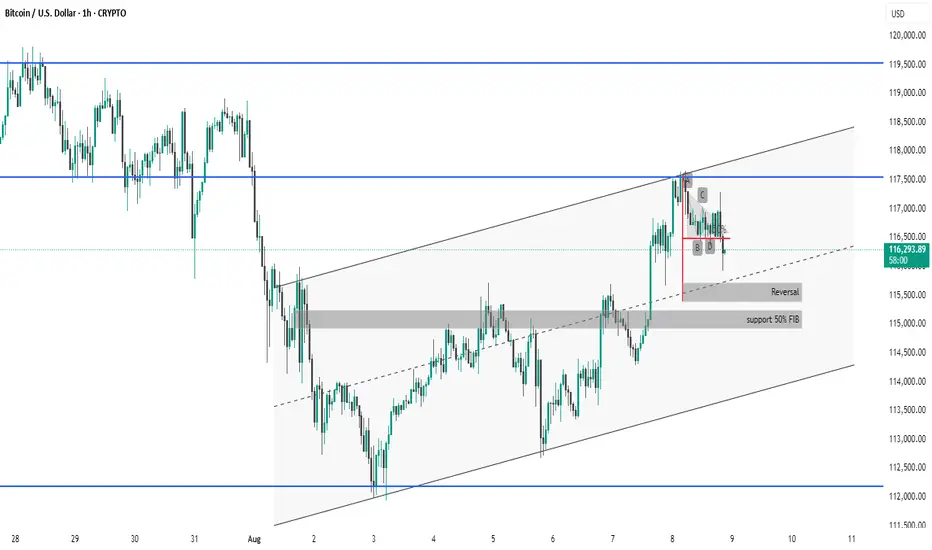
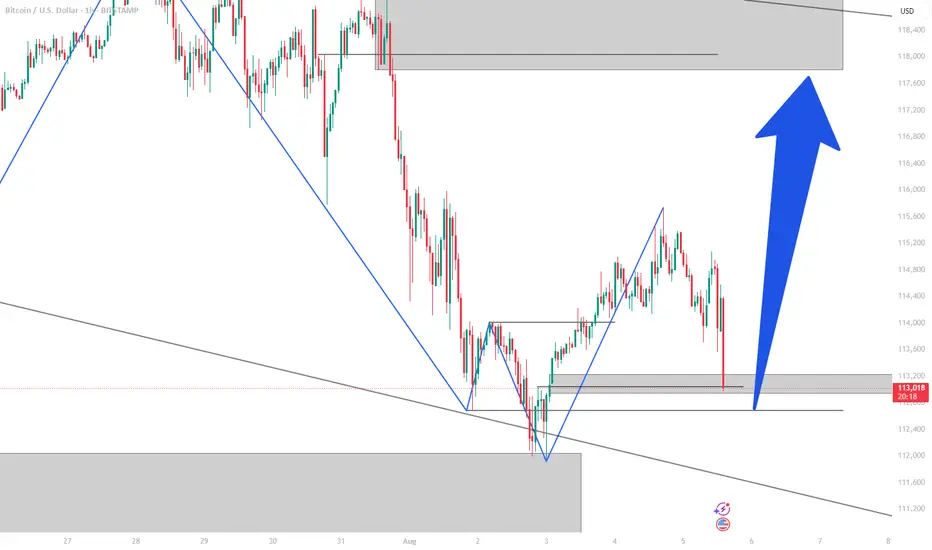
BTC #Bitcoin/USD 1H Chart Overview:Bitcoin/USD 1H Chart Overview:
Price Action: Bitcoin is trading within an ascending channel after rebounding from the support zone near $112,400.
Resistance: Price recently rejected from the upper channel boundary and horizontal resistance around $117,600–$118,000.
Support Levels:
Immediate support near the 50% retracement level (~$116,000).
Major support around $115,000 (confluence of previous structure + 50% FIB zone marked “support 50% FIB”).
Reversal Zone: Highlighted around $115,600, suggesting potential bounce if tested again.
Trend Context: Currently a pullback within a broader short-term uptrend, but further rejection at resistance could lead to a deeper retracement.
thanking you
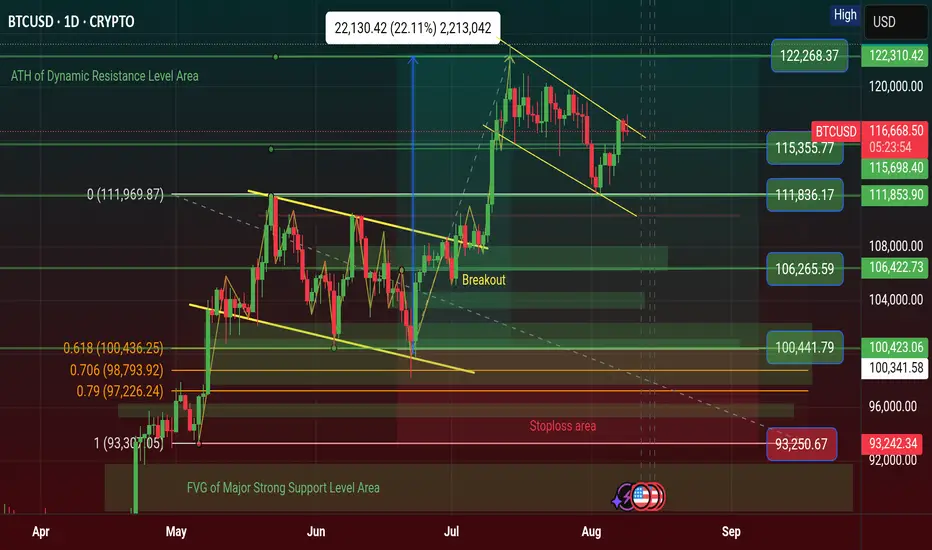
$BTC Finally Historical Profit Done at $122K & Now $123K of ATH CRYPTOCAP:BTC tying to push price upward movement and if it's Breakout the $120K-$122K Price Level area than it could be reached $128K - $136K price level area.
I'm guess it will be happened. Always Pattern indicate and say price movement of Bitcoin. I was many Prediction of popular coin and i will succeed in 2025. I'm long term analyst of long term investment of Traders.
🚦From News: Bitcoin Holds Firm Above $115K Support as Charts Point Toward $150K Target
Bitcoin holds above $115K support with charts pointing to a potential $150K Elliott Wave target.
Hashrate hits all-time high as energy value model places BTC valuation 45% above current price.
U.S. policy shift enables 401(k) crypto access, opening a $9 trillion market for Bitcoin adoption.
Bitcoin has held firm above the $115,000 support and is now showing signs of a large move on the charts. Price patterns and rising adoption trends are aligning as BTC prepares for a possible rally. At the time of writing, BTC was trading at $116,620, showing steady upward momentum.
Technical Structure Points Toward Upside Continuation
According to an analysis prepared by Lau, Bitcoin has taken the $115,000 support and may be preparing to break its all-time high. On Binance, the BTC/USDT daily chart displays a breakout from resistance near $116,438.79. The price reached a new high before retracing to $111,917.37, where it found support.
BTC’s price structure continues to show higher lows, aligning with the Elliott Wave pattern that targets $150,000. Key support levels remain at $98,385.45 and $89,326.51, confirming a strong technical base. According to Daan Crypto Trades, Bitcoin is steadily rising toward the $120,000 zone, where a cluster of stop losses and liquidation points may fuel further upside.
The current bullish flag formation is still intact, supported by the 50-day SMA at $113,154. The RSI has moved to 54, indicating recovering momentum without being overbought. Analysts view a break above $117,350 as a key signal for another upward push.
On-Chain Metrics and Market Drivers Support Growth
Bitcoin’s energy value stands at $167,800, which is around 45% above the current market price. According to Charles Edwards, founder of Capriole Investments, “Hash rates are flying and Bitcoin Energy Value just hit $145K.”
This model links BTC’s value to miner energy inputs and network security. Bitcoin’s hashrate reached an all-time high of 1.031 ZH/s on August 4, based on data from Glassnode. Alongside this, adoption is growing in the U.S. market.
President Trump’s policy allowing 401(k) crypto inclusion has opened a $9 trillion market. Crypto-linked equities and ETFs have also seen strong inflows, supporting long-term price action.
#highlights #everyone #premium #BinanceSquareFamily #Binance #BTC☀ #SUBROOFFICIAL
Disclaimer: This article is for informational purposes only and does not constitute financial advice. Always conduct your own research before making any investment decisions. Digital asset prices are subject to high market risk and price volatility. The value of your investment may go down or up, and you may not get back the amount invested. You are solely responsible for your investment decisions and Binance is not available for any losses you may incur. Past performance is not a reliable predictor of future performance. You should only invest in products you are familiar with and where you understand the risks. You should carefully consider your investment experience, financial situation, investment objectives and risk tolerance and consult an independent financial adviser prior to making any investment.
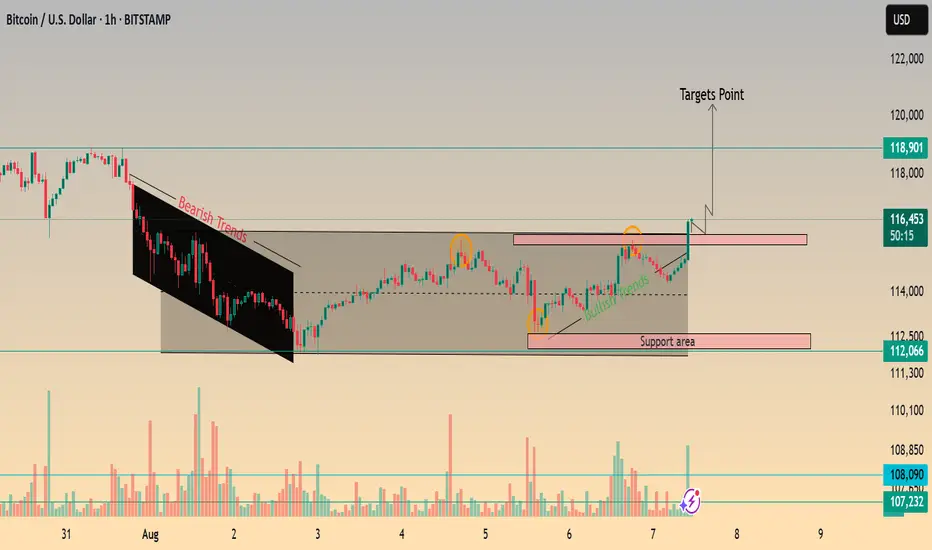
BTC/USD H1 ANALYSIS BULLISH 116.4K🚀 BTC/USD Bullish Alert! 🚀
📈 Current Price: 116.4K
🎯 Target: 120.4K
🛡️ Support: 112K
🧱 Resistance: 118K
🚀 BTC/USD is showing strong bullish momentum, currently trading at 116.4K. The market is eyeing a potential breakout towards the 120.4K target. Key levels to watch include support at 112K, which may serve as a strong foundation for upward movement, and resistance at 118K, a crucial level that, if broken, could confirm further bullish continuation. Traders should monitor these zones closely as Bitcoin tests critical thresholds.
best area for buy BTCI see a change in the H4 trend in BTC..this means it is in line with the major trend..there is a possibility that it will return to the price range of 118500
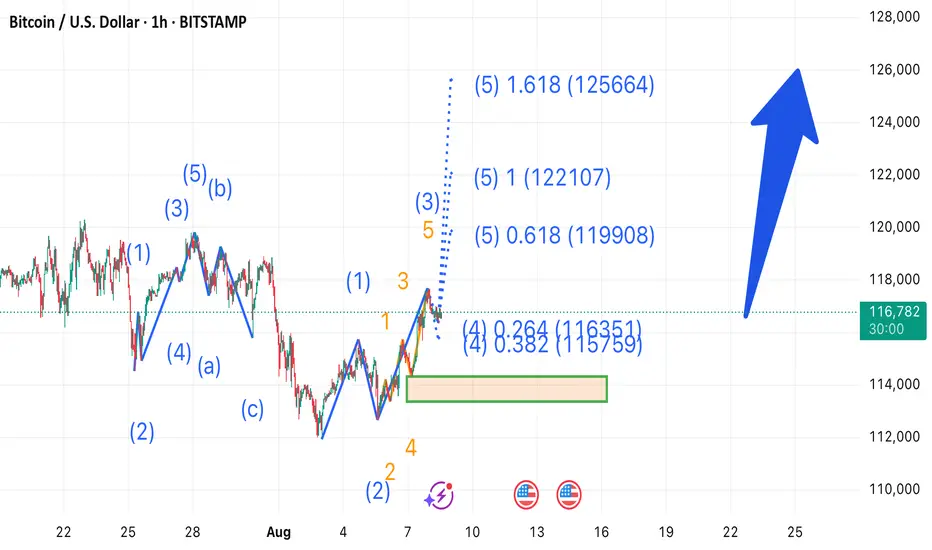
1h out look Btc chart Bitcoin appears to be completing its Wave (4) correction around the 0.382 Fibonacci level near 116,359. As per Elliott Wave structure, a potential Wave (5) extension is anticipated with key Fibonacci targets at 119,908 (0.618), 122,107 (1.0), and 125,664 (1.618). Price action confirmation above the current structure may trigger the next bullish leg.
$BTC Finally Historical Profit Done at $123K Price of ATH CRYPTOCAP:BTC tying to push price upward movement and if it's Breakout the $120K-$122K Price Level area than it could be reached $128K - $136K price level area.
I'm guess it will be happened. Always Pattern indicate and say price movement of Bitcoin. I was many Prediction of popular coin and i will succeed in 2025. I'm long term analyst of long term investment of Traders.
🚦From News: Bitcoin Holds Firm Above $115K Support as Charts Point Toward $150K Target
Bitcoin holds above $115K support with charts pointing to a potential $150K Elliott Wave target.
Hashrate hits all-time high as energy value model places BTC valuation 45% above current price.
U.S. policy shift enables 401(k) crypto access, opening a $9 trillion market for Bitcoin adoption.
Bitcoin has held firm above the $115,000 support and is now showing signs of a large move on the charts. Price patterns and rising adoption trends are aligning as BTC prepares for a possible rally. At the time of writing, BTC was trading at $116,620, showing steady upward momentum.
Technical Structure Points Toward Upside Continuation
According to an analysis prepared by Lau, Bitcoin has taken the $115,000 support and may be preparing to break its all-time high. On Binance, the BTC/USDT daily chart displays a breakout from resistance near $116,438.79. The price reached a new high before retracing to $111,917.37, where it found support.
BTC’s price structure continues to show higher lows, aligning with the Elliott Wave pattern that targets $150,000. Key support levels remain at $98,385.45 and $89,326.51, confirming a strong technical base. According to Daan Crypto Trades, Bitcoin is steadily rising toward the $120,000 zone, where a cluster of stop losses and liquidation points may fuel further upside.
The current bullish flag formation is still intact, supported by the 50-day SMA at $113,154. The RSI has moved to 54, indicating recovering momentum without being overbought. Analysts view a break above $117,350 as a key signal for another upward push.
On-Chain Metrics and Market Drivers Support Growth
Bitcoin’s energy value stands at $167,800, which is around 45% above the current market price. According to Charles Edwards, founder of Capriole Investments, “Hash rates are flying and Bitcoin Energy Value just hit $145K.”
This model links BTC’s value to miner energy inputs and network security. Bitcoin’s hashrate reached an all-time high of 1.031 ZH/s on August 4, based on data from Glassnode. Alongside this, adoption is growing in the U.S. market.
President Trump’s policy allowing 401(k) crypto inclusion has opened a $9 trillion market. Crypto-linked equities and ETFs have also seen strong inflows, supporting long-term price action.
#highlights #everyone #premium #BinanceSquareFamily #Binance #BTC☀ #SUBROOFFICIAL
Disclaimer: This article is for informational purposes only and does not constitute financial advice. Always conduct your own research before making any investment decisions. Digital asset prices are subject to high market risk and price volatility. The value of your investment may go down or up, and you may not get back the amount invested. You are solely responsible for your investment decisions and Binance is not available for any losses you may incur. Past performance is not a reliable predictor of future performance. You should only invest in products you are familiar with and where you understand the risks. You should carefully consider your investment experience, financial situation, investment objectives and risk tolerance and consult an independent financial adviser prior to making any investment.
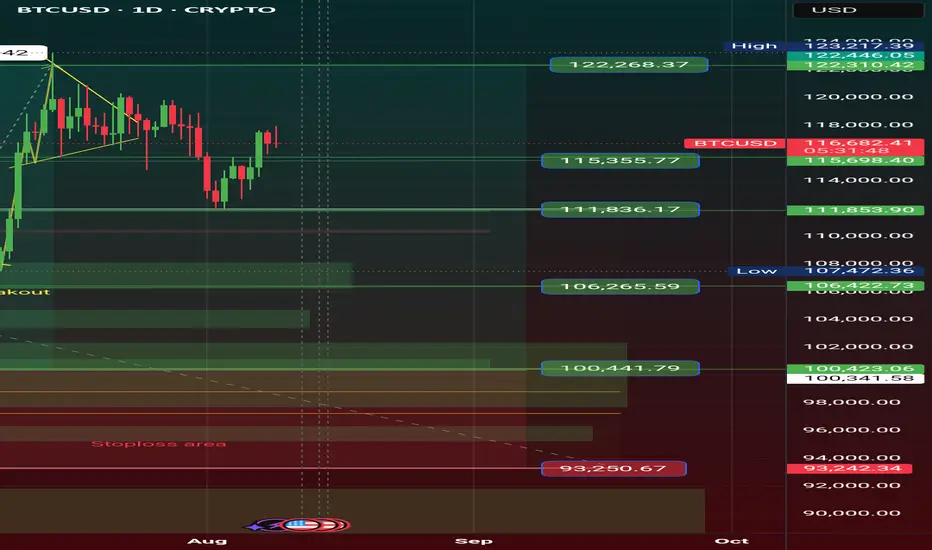
BTCUSDT — No New D1 BUY Signal YetBTCUSDT — No New D1 BUY Signal Yet
Even as BTCUSDT pulls back, I’m confident we still have one more D1 peak ahead — likely pushing above the 123k zone — before it gradually tops out on the D1, then W, and eventually the M timeframe.
When that happens, BTC will start to decline, TOTAL will see outflows, and TOTAL2 and TOTAL3 will follow suit. In other words, BTC and TOTAL will hold their top range to give altcoins (which began their run in July) time to form their own W tops. Once that’s complete, the entire market will decline together — potentially bringing TOTAL down toward the $2.5T level.
That stage of the market will feel bleak and hopeless, but it will also be the moment to accumulate assets forming W bottoms.
For now, we wait for one more drop on H4 to long BTC. As for altcoins you already hold — XRP, ZEN, LTC, HBAR, XLM, ETH, LINK, and others — keep holding. It’s not yet the time to take profits.

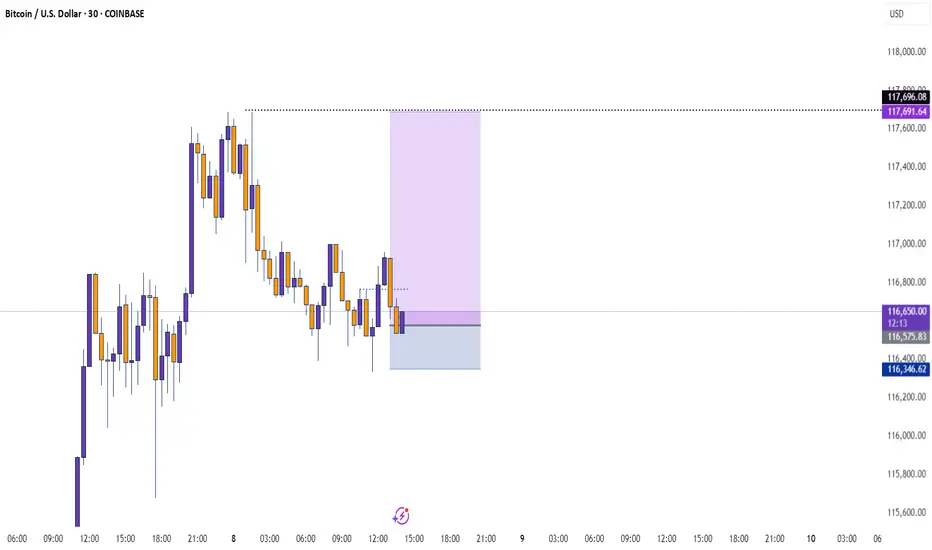
BTC/USD 1H – Weak High in Play | OB Reaction Zones AheadPrice is currently consolidating below Weak High and just above the mid OB zone.
Two key scenarios in play:
1️⃣ Pullback into OB → Bullish breakout toward upper OB around 118.8k.
2️⃣ Failure to hold OB → Bearish move targeting lower OB near 114.2k.
🔹 Structure shows HH, HL with BOS confirming bullish control, but liquidity sweeps remain possible.
🔹 Watch OB reactions for clean entry triggers.


BITCOIN Bullish Wedge!
HI,Traders !
#BITCOIN is trading in an
Uptrend and the pair formed
A bullish wedge pattern and
Now we are seeing a bullish
Breakout from the wedge so
We are bullish biased and we
Will be expecting a further
Bullish move up !
Comment and subscribe to help us grow !

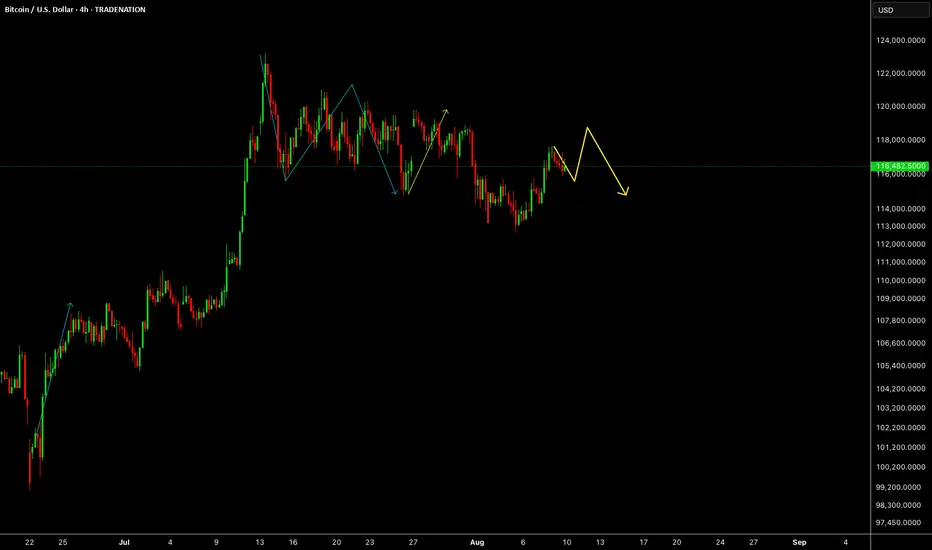
BITCOINBTC is going up slowly, we need to get a correction down soon if it is planning to go up and break ATH.
Disclosure: We are part of Trade Nation's Influencer program and receive a monthly fee for using their TradingView charts in our analysis.
BITCOIN LOG UPDATESThis meaningful indicators on logarithmic, Since 2022- now I still used this on BITCOIN.
it works, some of my followers doubt this but its fine, we might see 170k per bitcoin by end of this year? This predictions base on the logarithmic , this indicator shows how the supply works with only 21M bitcoins, unlike other commodities. Bitcoin is the most followed commodities on this indicator I rarely used.
Youve come here so far to know bitcoin, here is my chart for this year. It will keep Bitcoin hard to buy until it reached a million per coin, then the public regret it.
Keep the word DCA. Goodluck.
Holding it is the key.
