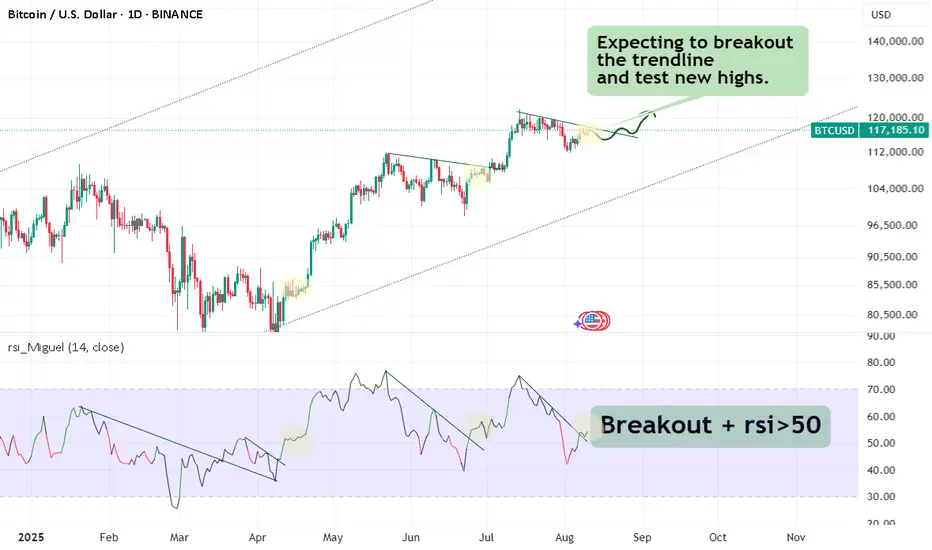
Think of RSI like a car’s speedometer: The speed (RSI) changes b"Think of RSI like a car’s speedometer:
The speed (RSI) changes before the position (price) changes direction."
1. What RSI actually is?
RSI (Relative Strength Index) is just a math transformation of price data.
It measures the ratio of recent upward moves to downward moves over a period (often 14 candles) and compresses it into a 0–100 scale.
2. Why RSI sometimes “moves first”
This isn’t magic — it’s because RSI is sensitive to the speed and size of recent price changes, not just direction.
- If price is still going up but at a slower pace, RSI can already start turning down.
- If price is falling more gently than before, RSI can start curling up before price actually reverses.
3. Why traders care about RSI reversals?
- If RSI starts turning down from an overbought level while price is still climbing, it can be an early warning of a possible price top.
- Same for the opposite: RSI turning up from oversold while price still dips can signal an upcoming bounce.
4. RSI above or below 50
50 on the RSI is the “momentum neutral” line.
- When RSI is above 50, recent gains outweigh recent losses → momentum is bullish.
- When RSI is below 50, recent losses outweigh recent gains → momentum is bearish.
5. The “delay” you see
The delay is more about your eyes than the math:
- RSI smooths recent price moves (average gains/losses), so it reacts slightly ahead to changes in momentum.
- Price must actually reverse for you to “see” it, but RSI reflects that change in momentum first.
- Think of RSI like a car’s speedometer:
The speed (RSI) changes before the position (price) changes direction.
6. How to deal with noise* in RSI?
Use higher timeframes (1D, 1W, 1M) to confirm signals from small charts.
*Noise in trading = small, random price movements that don’t reflect the bigger trend.
On a 1-minute or 5-minute chart, there’s a lot of this — caused by scalpers, bots, spreads, liquidity gaps, and normal market “chatter.”
BTCETH.P trade ideas
BTCUSD: Will Go Down! Short!
My dear friends,
Today we will analyse BTCUSD together☺️
The in-trend continuation seems likely as the current long-term trend appears to be strong, and price is holding below a key level of 118,171.98 So a bearish continuation seems plausible, targeting the next low. We should enter on confirmation, and place a stop-loss beyond the recent swing level.
❤️Sending you lots of Love and Hugs❤️
Update on last BTCUSD trade idea.Price successfully broke the pattern and made a significant rally.
Cheers to who followed. Want to be part of my Telly?
Chat me privately on TV’s private chat section

BTC Elliott Wave medium term analysisCRYPTOCAP:BTC is still consolidating, as shown on the charts.
The structure is shaping up like a classic Elliott Wave 1–2–3–4–5 pattern, with the 4th wave now in play.
This could mean another retest of $110,500 before launching into the final, larger 5th wave 🚀.
The 4th wave might present a solid long entry opportunity heading into the 5th.
📊 DYOR – trade safe.

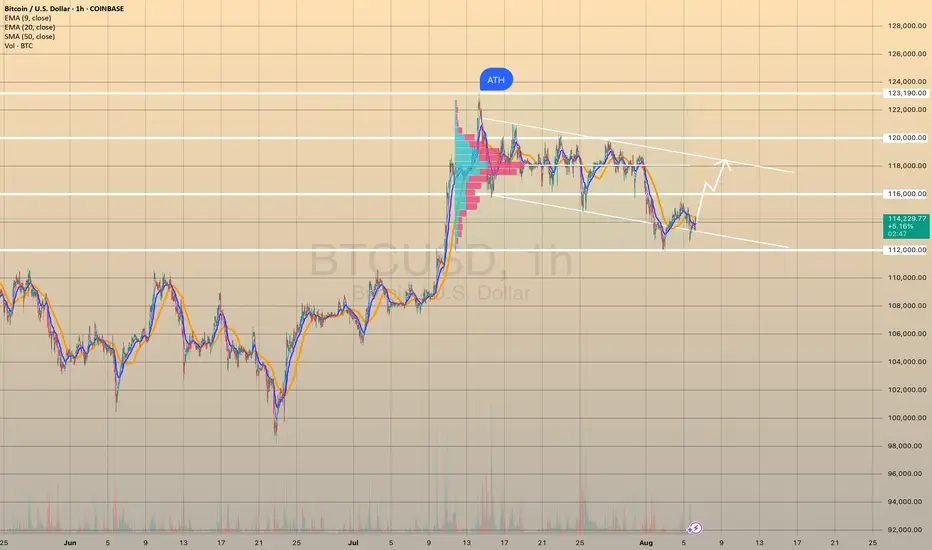
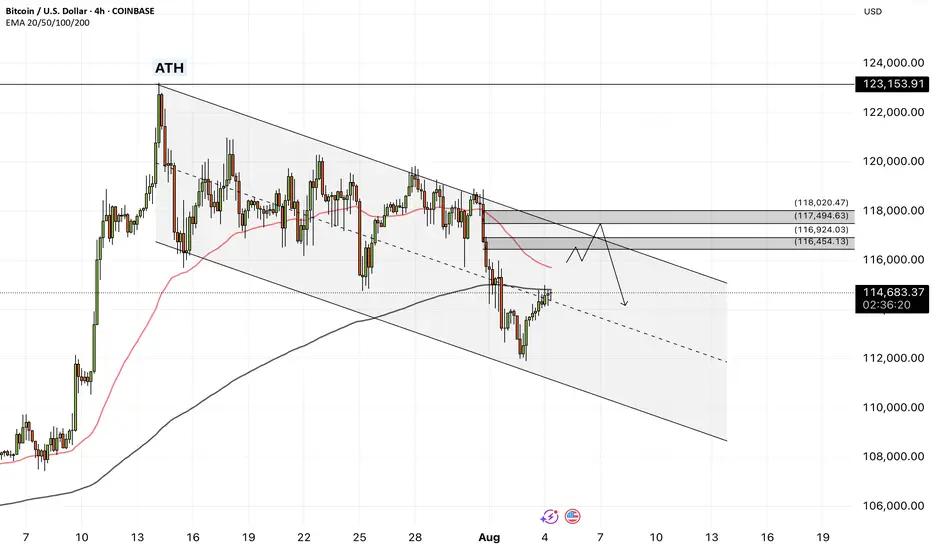
BTCUSD manages to hold the lower border of the – Rebound LikelyBTCUSD manages to hold the lower border of the descending channel, ready to rebound.
BTCUSD broke below 116,000.00 support level on August 1 and declined towards 112,000.00 support level. Afterwards, the asset successfully rebounded from it. Although, we noticed 2 false breakouts of the channel, in general the asset tries hold itself within the descending channel, still showing us the strength of this formation.
Here, the rebound towards 118,000.00 level is expected with intermediate consolidation slightly above the 116,000.00. In the long term, the asset still moves within the descending channel, so no new long-term bullish momentum is expected.
BTC Breakout Watch – Red Resistance Being Tested! 🚨 CRYPTOCAP:BTC Breakout Watch – Red Resistance Being Tested! 🔴⏳
CRYPTOCAP:BTC is testing the red resistance zone.
📊 If breakout confirms, next move could target:
🎯 First Target → Green line level
A breakout could trigger bullish continuation and upside momentum.
Bitcoin remain bullish Btcusd remain bullish, with price showing signs of strength.
I am seeing a stable trend with minimal vitality, indicating potential continuation of the uptrend.
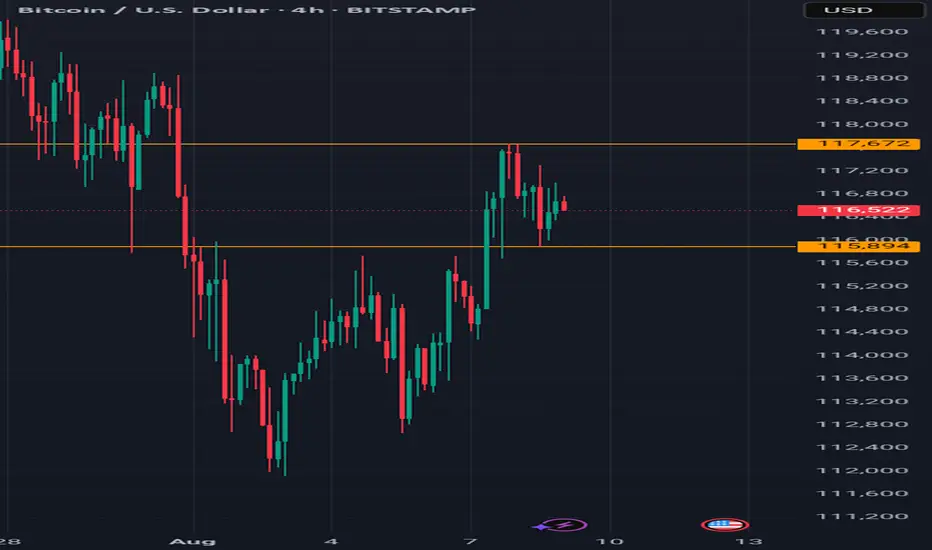
Resistance and support level on daily timeframe
Resistance 117,672
Support 115,894
Trade setup
Entry 116,500
Stop loss 115,800
Take profit 117,500
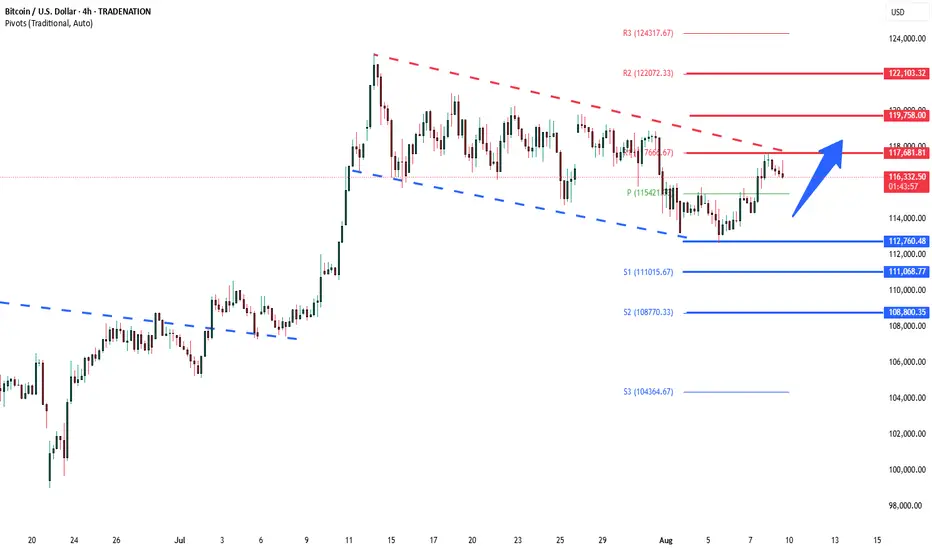
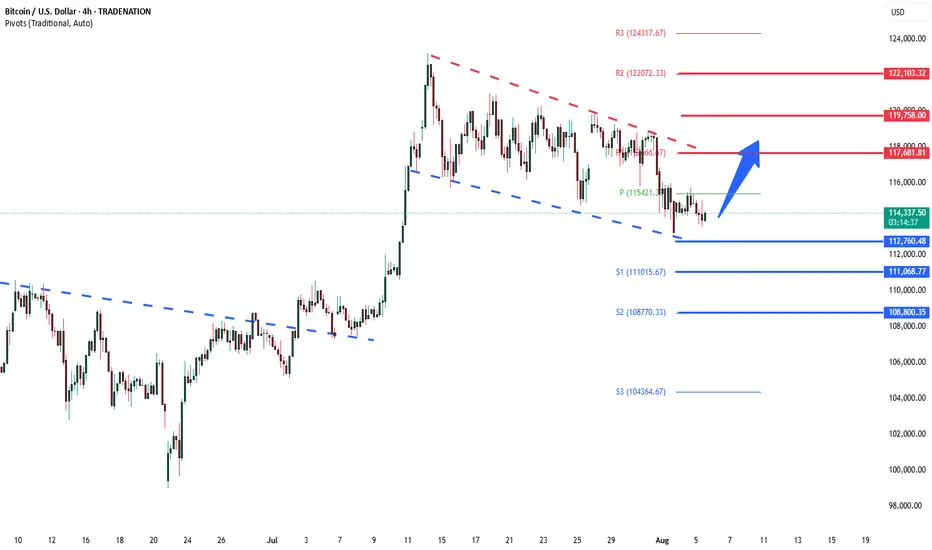
BTCUSD resistance retest at 117,680The BTCUSD remains in a bullish trend, with recent price action showing signs of a corrective pullback within the broader uptrend.
Support Zone: 112,760 – a key level from previous consolidation. Price is currently testing or approaching this level.
A bullish rebound from 112,760 would confirm ongoing upside momentum, with potential targets at:
117,680 – initial resistance
119,760 – psychological and structural level
122,100 – extended resistance on the longer-term chart
Bearish Scenario:
A confirmed break and daily close below 112,760 would weaken the bullish outlook and suggest deeper downside risk toward:
111,070 – minor support
108,800 – stronger support and potential demand zone
Outlook:
Bullish bias remains intact while the BTCUSD holds above 112,760. A sustained break below this level could shift momentum to the downside in the short term.
This communication is for informational purposes only and should not be viewed as any form of recommendation as to a particular course of action or as investment advice. It is not intended as an offer or solicitation for the purchase or sale of any financial instrument or as an official confirmation of any transaction. Opinions, estimates and assumptions expressed herein are made as of the date of this communication and are subject to change without notice. This communication has been prepared based upon information, including market prices, data and other information, believed to be reliable; however, Trade Nation does not warrant its completeness or accuracy. All market prices and market data contained in or attached to this communication are indicative and subject to change without notice.
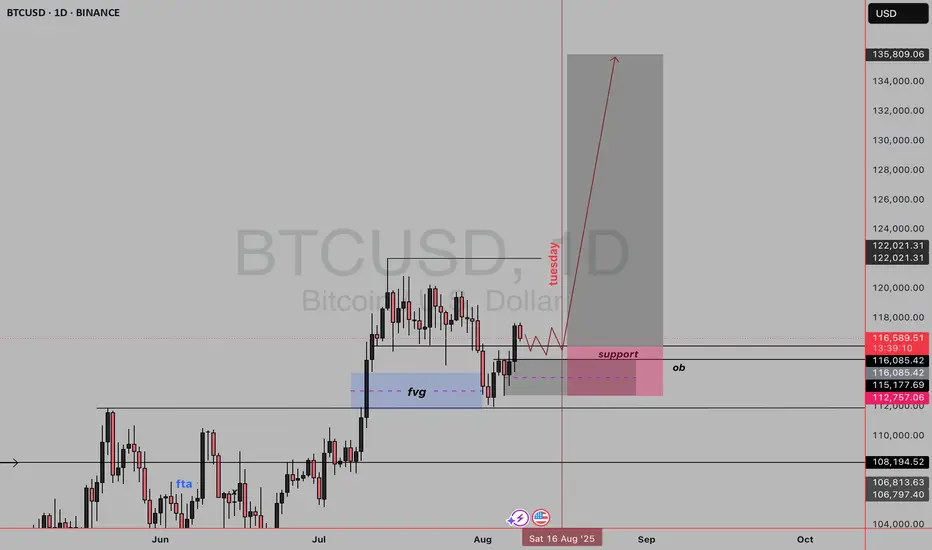
BTC BULL(2025)-SWING Your BTC/USD daily chart shows a Smart Money Concept (SMC) bullish setup with the following key points:
1. Market Structure
Price had a recent drop but is now retracing back upward.
The chart suggests accumulation and preparation for a bullish push.
There's a clear swing high liquidity above previous highs that price may target.
2. Key Zones
OB (Order Block) in pink:
This is the last bullish candle before a strong move down.
Price is expected to react here — either as a support retest before going higher.
Support (labelled in pink):
Aligned with the OB, acting as a confluence zone for buyers.
FVG (Fair Value Gap) in blue:
This gap represents inefficiency in price.
Price has tapped into it and could use it as a base to move higher.
3. Price Expectation
The red path suggests:
Small consolidation near the support/OB zone until around Tuesday (timing element in your plan).
Then, strong bullish expansion targeting above $122K, and potentially into the $135K range.
4. Liquidity
Liquidity sits above recent highs (marked near $122,021).
Market makers may push price up to take that liquidity before any reversal.
5. Trade Logic
Entry: On retest of the OB/support zone (around $116,000–$115,000).
Stop Loss: Below the OB or the $112,757 level.
Targets:
Short-term: $122,021 (liquidity grab).
Long-term: $135,809.
BTCUSD important support at 112,760The BTCUSD remains in a bullish trend, with recent price action showing signs of a corrective pullback within the broader uptrend.
Support Zone: 112,760 – a key level from previous consolidation. Price is currently testing or approaching this level.
A bullish rebound from 112,760 would confirm ongoing upside momentum, with potential targets at:
117,680 – initial resistance
119,760 – psychological and structural level
122,100 – extended resistance on the longer-term chart
Bearish Scenario:
A confirmed break and daily close below 112,760 would weaken the bullish outlook and suggest deeper downside risk toward:
111,070 – minor support
108,800 – stronger support and potential demand zone
Outlook:
Bullish bias remains intact while the BTCUSD holds above 112,760. A sustained break below this level could shift momentum to the downside in the short term.
This communication is for informational purposes only and should not be viewed as any form of recommendation as to a particular course of action or as investment advice. It is not intended as an offer or solicitation for the purchase or sale of any financial instrument or as an official confirmation of any transaction. Opinions, estimates and assumptions expressed herein are made as of the date of this communication and are subject to change without notice. This communication has been prepared based upon information, including market prices, data and other information, believed to be reliable; however, Trade Nation does not warrant its completeness or accuracy. All market prices and market data contained in or attached to this communication are indicative and subject to change without notice.
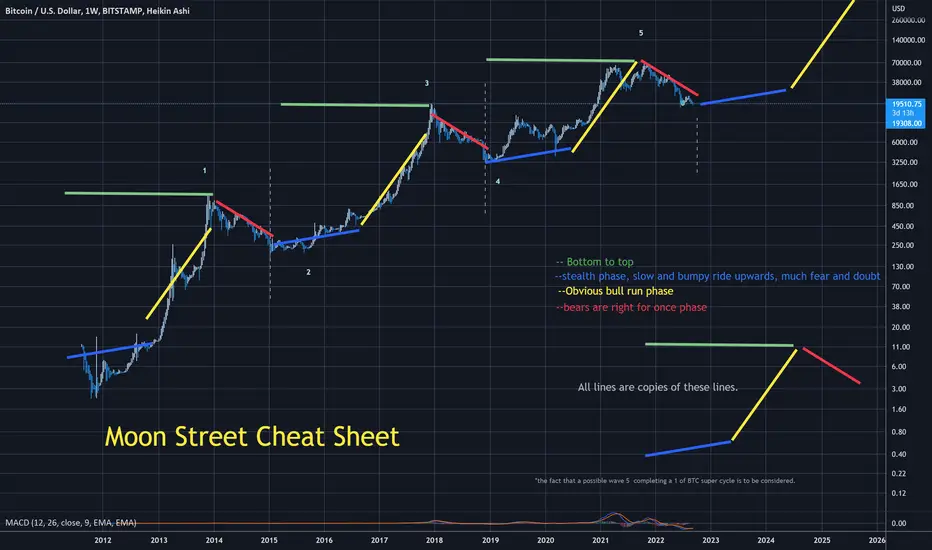
Moon Street Cheat Sheet
All same color lines are idendical to eachother ( copies )
3 times since BTC's beginning, they have been pretty accurate with both time and angle ( on log chart )
is 4th time the charm , or was it the 3rd ?
We shall see
Wait for the BUY BITCOIN ON FIREthis is my newest strategy for bitcoin , the overall sentiment is bullish , we are just ranging and retracing the 112K zone , once its goes back to that levl give it a buy
Bitcoin - Will Bitcoin reach its previous ATH?!Bitcoin is below the EMA50 and EMA200 on the four-hour timeframe and is in its short-term descending channel. In case of an upward correction, Bitcoin can be sold from the specified supply zone, which is also at the intersection of the ceiling of the descending channel.
It should be noted that there is a possibility of heavy fluctuations and shadows due to the movement of whales in the market and compliance with capital management in the cryptocurrency market will be more important. If the downward trend continues, we can buy in the demand range.
In recent days, Bitcoin has stabilized below the $120,000 mark, a development that reflects increasing structural maturity in the market and strong institutional capital inflows. Unlike in previous cycles, where price rallies were largely driven by retail hype, the current liquidity flows are channeled through regulated and professional instruments like ETFs. During the month of July alone, Bitcoin ETFs attracted over $6 billion in inflows, marking the third-highest monthly inflow in their history. Leading this trend were BlackRock’s IBIT and Fidelity’s FBTC, which together recorded more than $1.2 billion in net inflows within a single week. This signals a shift in trust from traditional investors toward crypto markets—within transparent, traceable, and regulated frameworks.
On-chain metrics further validate this shift. The MVRV ratio, which compares market value to realized value, is currently fluctuating between 2.2 and 2.34. These levels do not indicate profit-taking extremes nor fear of major corrections, but instead point to a healthy and rationally profitable market. Meanwhile, the supply of Bitcoin held in non-exchange wallets is rising, while exchange-held balances have dropped to their lowest levels in a decade, now accounting for just 1.25% of total supply. This trend implies reduced short-term selling pressure, as coins transition from liquid to long-term holdings.
Trader behavior is also evolving. Unlike previous bull runs, profit-taking remains controlled. The SOPR index, which measures realized profit relative to purchase price, has not yet reached saturation levels. This suggests that current holders are not satisfied with existing gains and are anticipating higher price levels. Furthermore, metrics like daily active addresses remain stable, indicating a lack of speculative retail influx. The network’s current dynamics resemble those of mature traditional markets, where investment decisions are guided by analysis, discipline, and long-term perspective.
Analysts at major financial institutions believe that if this trend continues, Bitcoin could reach targets of $180,000 to $200,000 by year-end. A more conservative scenario places the $95,000 to $100,000 range as a strong support zone—especially if political, regulatory, or macroeconomic pressures intensify. Overall, the convergence of institutional capital, rational trader behavior, stable on-chain conditions, and regulatory clarity has transformed Bitcoin into a more structured and dependable asset than ever before.
Ultimately, Bitcoin is no longer just a speculative tool. It has secured its role as a legitimate asset within the portfolios of global financial institutions. Even if the pace of capital inflow is slower than in previous cycles, the underlying structure is more robust and sustainable—offering a clearer path toward broader global adoption and higher valuation.
Nonetheless, recent data from CryptoQuant suggests that long-term Bitcoin holders (LTHs) have begun net selling near the $120,000 resistance zone—a psychologically significant level in Bitcoin’s price history. Analysts interpret this as a potential sign that veteran investors—those who entered during earlier market cycles—are now realizing profits as prices reach historic highs. If short-term holders follow suit, this shift could amplify selling pressure and trigger heightened price volatility.
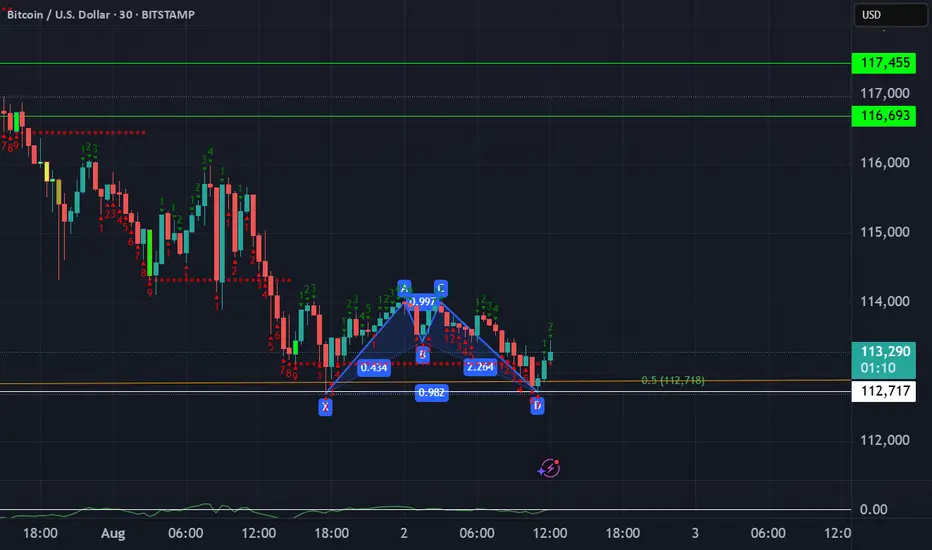
BTC Double BottomFibonacci sequence is a mathematical concept; it appears in various aspects of everyday life and nature. It's not directly used in a calculated way, but its principles are reflected in the patterns we see around us. Its key for traders to pinpoint these reversal areas to keep a positive risk/reward ratio. Bulls will target 116k if this low can be sustained.
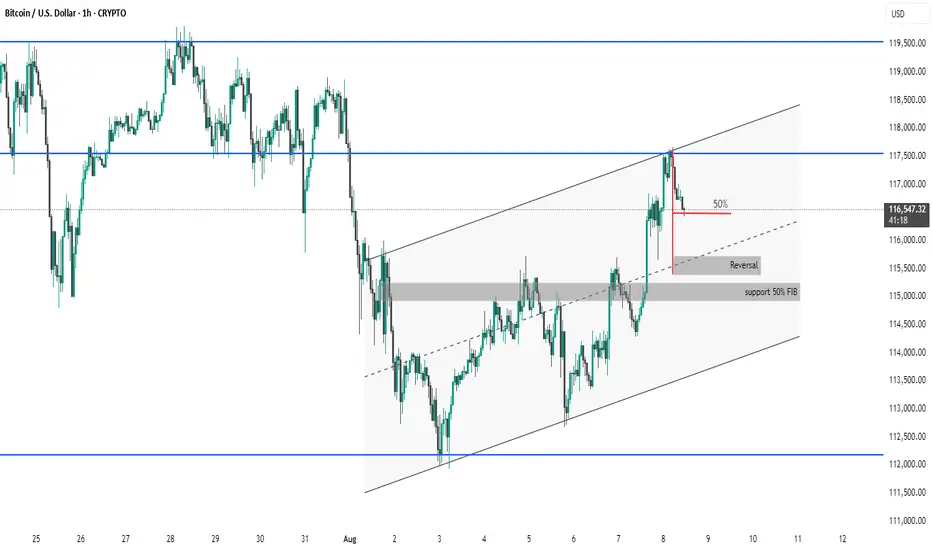
BTC #Bitcoin/USD 1H Chart Overview:Bitcoin/USD 1H Chart Overview:
Price Action: Bitcoin is trading within an ascending channel after rebounding from the support zone near $112,400.
Resistance: Price recently rejected from the upper channel boundary and horizontal resistance around $117,600–$118,000.
Support Levels:
Immediate support near the 50% retracement level (~$116,000).
Major support around $115,000 (confluence of previous structure + 50% FIB zone marked “support 50% FIB”).
Reversal Zone: Highlighted around $115,600, suggesting potential bounce if tested again.
Trend Context: Currently a pullback within a broader short-term uptrend, but further rejection at resistance could lead to a deeper retracement.
thanking you
Bitcoin Bears Lining Up? My Short PlanBitcoin is flirting with a potential pullback, and I’ve got my eyes locked on this short setup.
The setup is a double top on the hourly chart.
📊 Risk/Reward: 3.7
🎯 Entry: 117 515
🛑 Stop Loss: 118 033
💰 Take Profit 1 (50%): 115 629
💰 Take Profit 2 (50%): 115 116
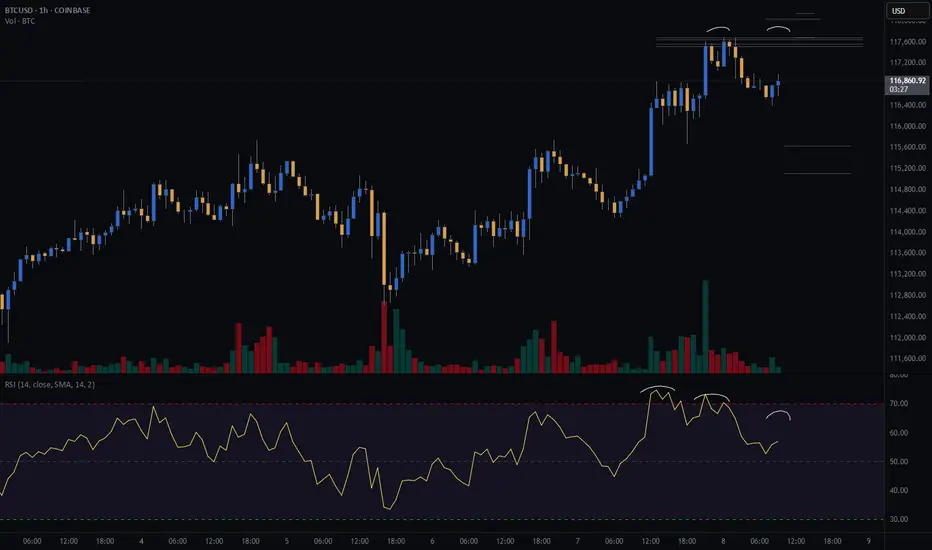
Seeing negative rsi divergence on the hourly chart, signaling slowing buying momentum.
I am looking for the hourly candle to close within the range drawn on the chart with lower volume.
I’ll be scaling out at TP1 and letting the second half ride if the bears get their way.
📅 Will today be the start of a deeper drop?
📍 I’m documenting my trades as part of my live trading journey – follow along to see how this one plays out and catch my next setups in real time.
Not financial advice – just my personal analysis.
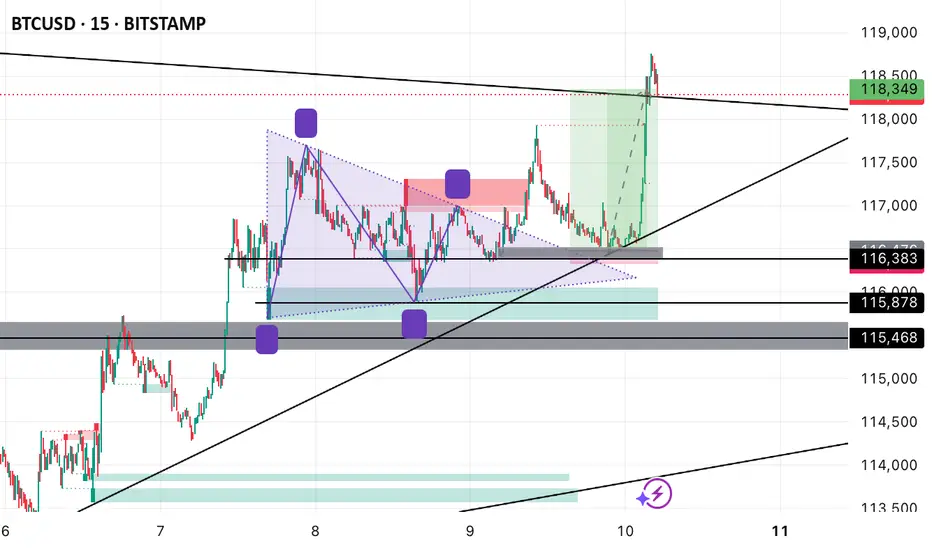
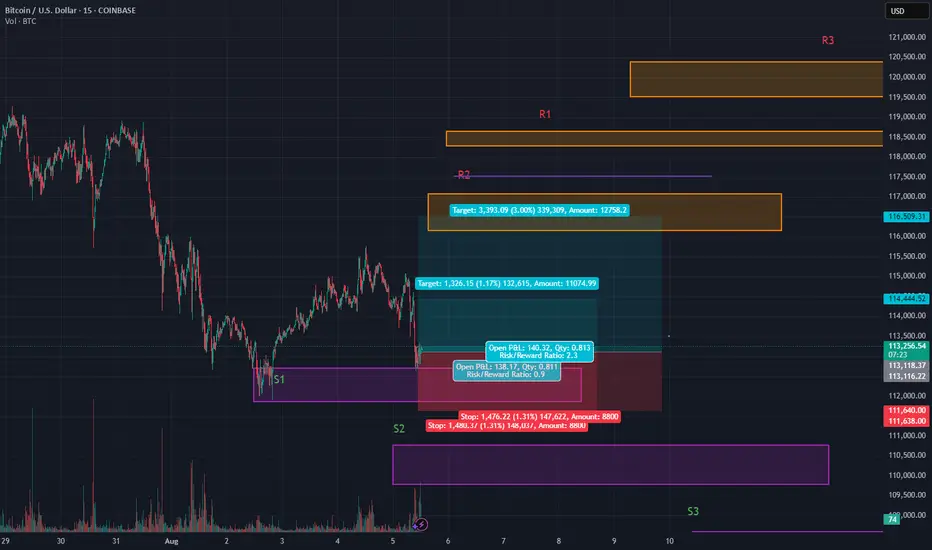
BTC Bleeding, Scalpel Please💣 Price just nuked back to our OG S1 zone and buyers are throwing hands at $113k 🥊
This is a quick scalp play while the dust settles
🎯 Entry: 113,159
🛡 Stop: 113,111 (just below S2's base. you can tighten this up, to the base if desired.)
📈 Scalp Target 1: 114,444
🚀 (Swing Trade) Target 2: 116,588
🧠 Setup: Reclaim after wick trap
📐 Structure: Bullish continuation off demand
📍 Zone: Micro-range base + sweep low trap
Scalpel sharp ✂️
Clean. Tight. Ruthless.
⚠️ Heads up — 30m still trending down
So lock those stops and stay nimble 🔪
⚠️If $113k fails, watch for a flush to S2 or even S3.
This bounce is a scalp — not a trend shift (yet) 🚨
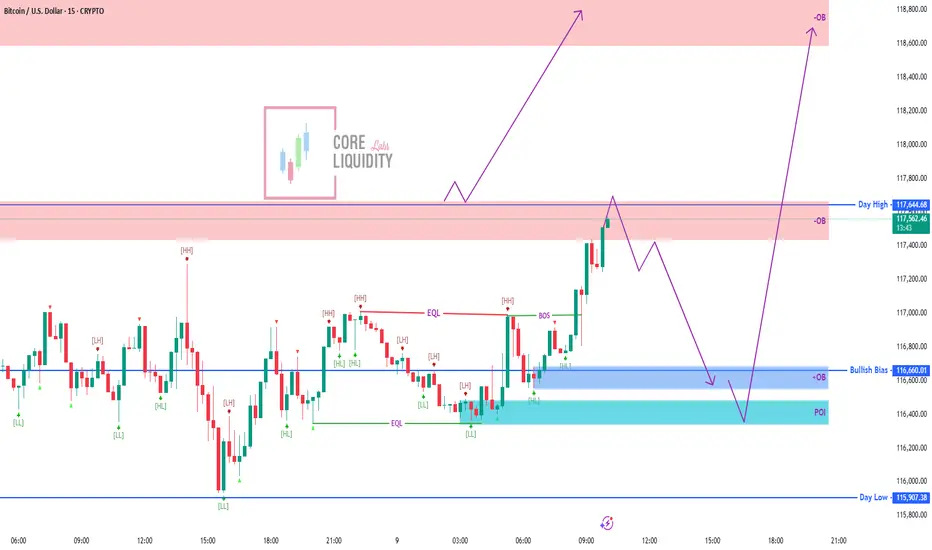
BTC/USD – Double Scenario PlayPrice is now testing the Day High supply zone (117,644). Two possible plays from here:
1️⃣ Bullish Continuation – Clean breakout above 117,644 could fuel a rally straight into the 118,800 OB.
2️⃣ Deeper Retracement – Rejection at supply could send price back into the 116,660 OB Buy Zone for liquidity grab before a major push up.
Key Levels:
Resistance: 117,644 / 118,800 OB
Support (Buy Zone): 116,660 – 116,400 OB/POI
Bias: Bullish as long as 115,907 (Day Low) holds
📌 Plan your entries based on reaction at the supply zone — breakout or rejection will set the tone for the next big move.
Potential Roadmap for BTC/USD In the next 30-40 daysVolatility incoming. It seems like BTC/USD is heading down to sweep some liquidity range at around 107-110,000.
However, market will recover after that, we are still in the "buy the dip" scenario.
End of August, I can personally still bet that BTC will sit higher than the current level

Frames of Reference🏛️ Research Notes
Fibonacci Channels as Frames of Reference
Just like Schrödinger’s wave equation describes all possible states of a quantum system, the market at any moment holds a spectrum of potential price paths. Hence, commonality is that, the wave function is a mathematical description of probabilities, not certainties, just like market state is a blend of possible moves, not a single predetermined path.
In quantum mechanics, choosing a measurement basis determines which aspects of the wave function become clear. In charting, each Fibonacci channel is a “measurement frame,” tuned to a certain proportion or scaling law that the market tends to respect. So if we say have multiple channels, then by overlaying several, you capture different interference layers, revealing systemic alignments that a single frame would miss. (Structure Memory and Duality )
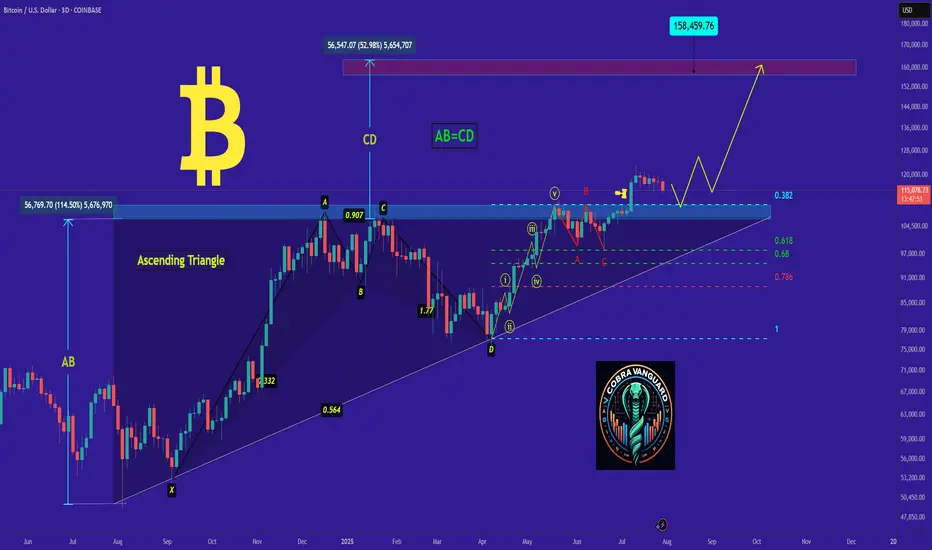
Do you think I'm joking ???As I said, Bitcoin broke the triangle, and now with a slight price correction(109k), it could surge to $150k , and you still think I'm joking!!
Previous analysis