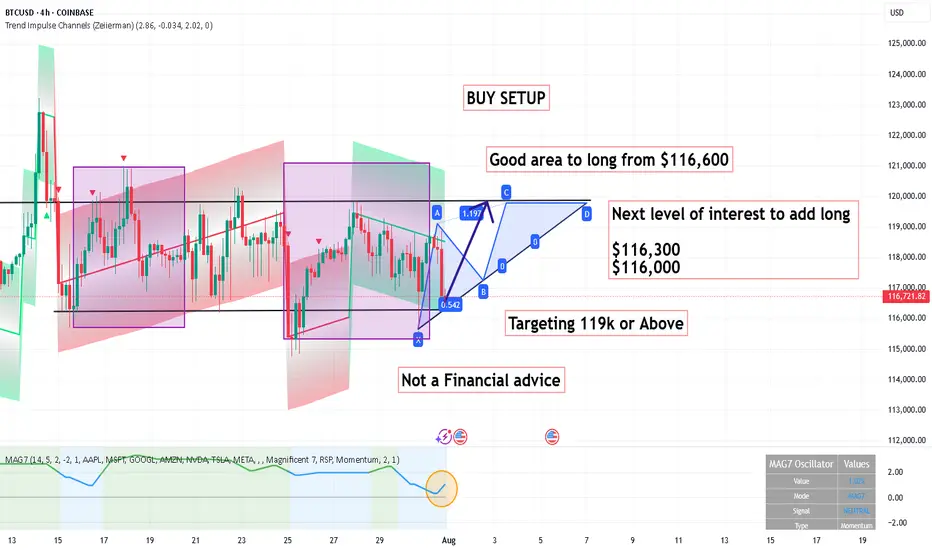
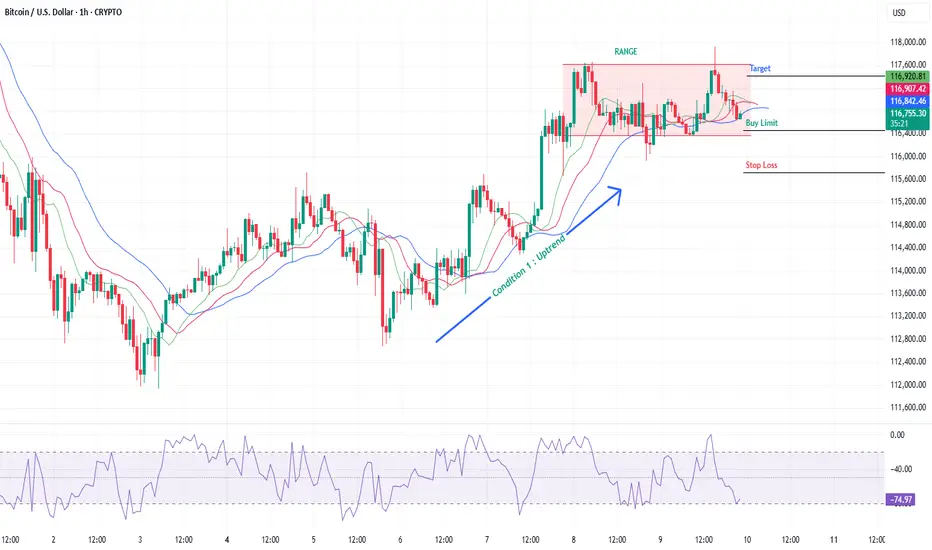
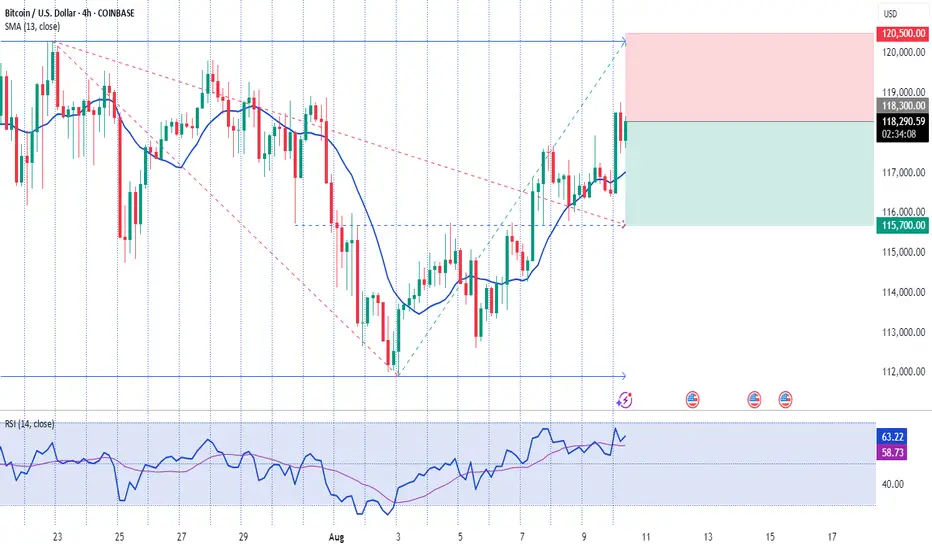
BUY SETUP ,Good area to long from $116,600BUY SETUP
Good area to long from $116,600
Next level of interest to add long
$116,300
$116,000
Targeting 119k or Above
Its not a Financial advice
BTCETH.P trade ideas
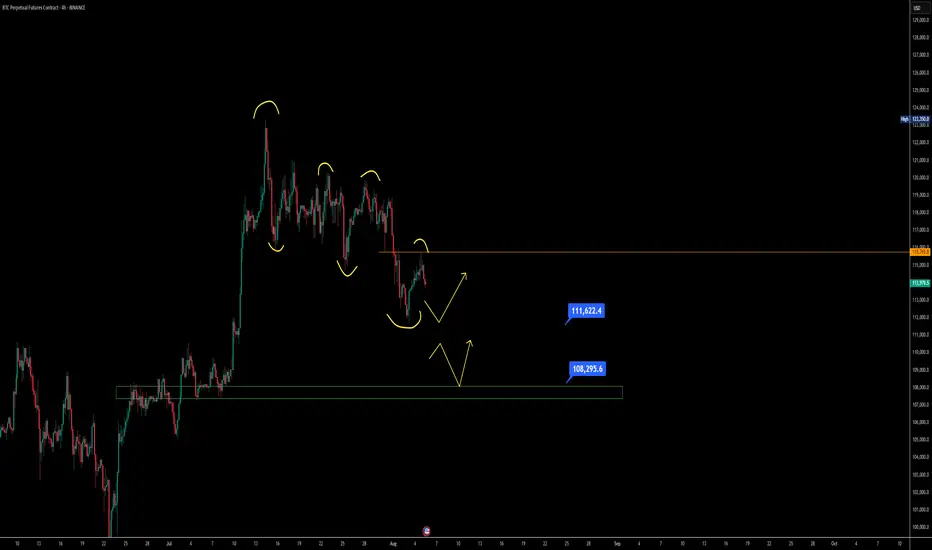
$Btc Bounce Signal is Locking in on the $108.5k Golden Pocket Bitcoin recently formed a higher low around the $111,600 level, which is an important structure to watch. This setup is still bearish in nature because if BTC loses this $111.6K support, it will confirm a deeper bearish trend taking hold. Right now, BTC is pulling back after being rejected at $115,000 and heading towards this crucial $111.6K zone.
If this support holds, we might see some relief or a bounce. But if it breaks, the next key area is the Fibonacci Golden Pocket between $107,000 and $108,000 — a critical level where bulls often try to defend. Failure to hold even the Golden Pocket would strengthen the bearish outlook further.
BTC is at a decisive point, and traders should closely watch how price behaves around these levels to understand if a recovery or a deeper drop is on the cards.
BTCUSD 1h Possible High AreaBitcoin should make a high around the shown level according to the analysis.
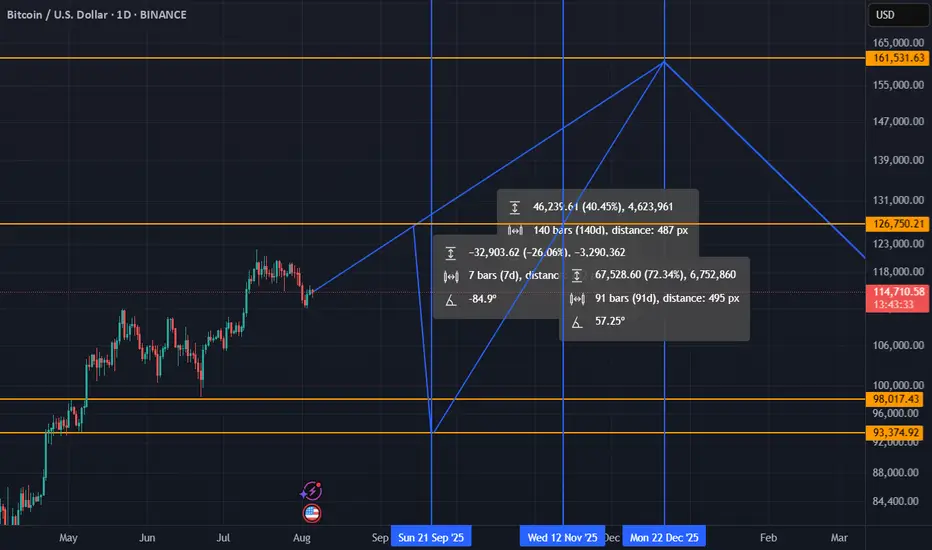
im bad in charts but this is what i think will happen to btc i think btc will go to 127k just before fed september meeting then 25% dump under 100k 95k then v schape recovery to 160k end december,
Altseason will start nov/jan. accumulate alts end september at the bottom ride them till dec/begin jan
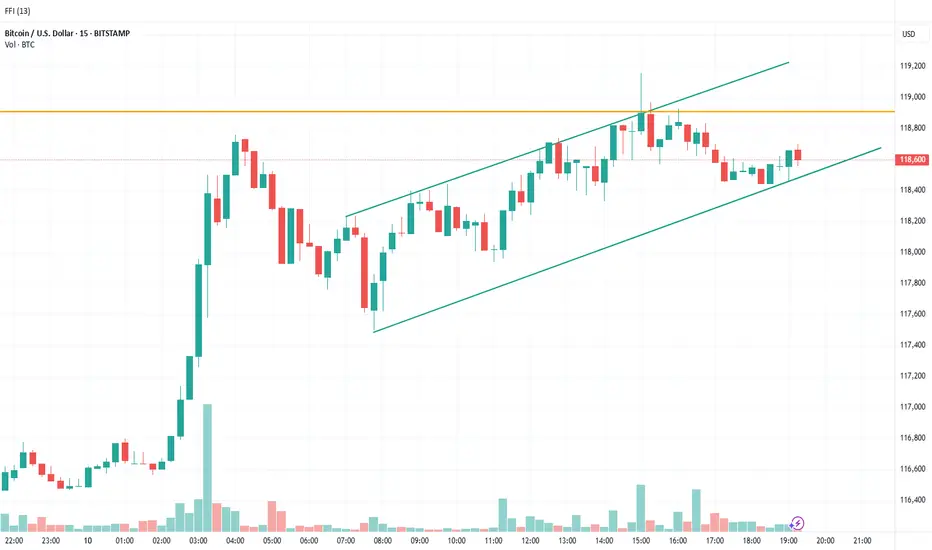
Trading Bitcoin using 15-min TF with 4-hour ConfluenceI am forecasting the price direction for Bitcoin using the price action movement which shed light on the market maker price manipulation and psychology. The current price movement in Bitcoin is bullish and is trading within a upward range on the 15min TF and will confirm the upside to retest the ATH if break above the confluence zone highlighted by the orange color line.
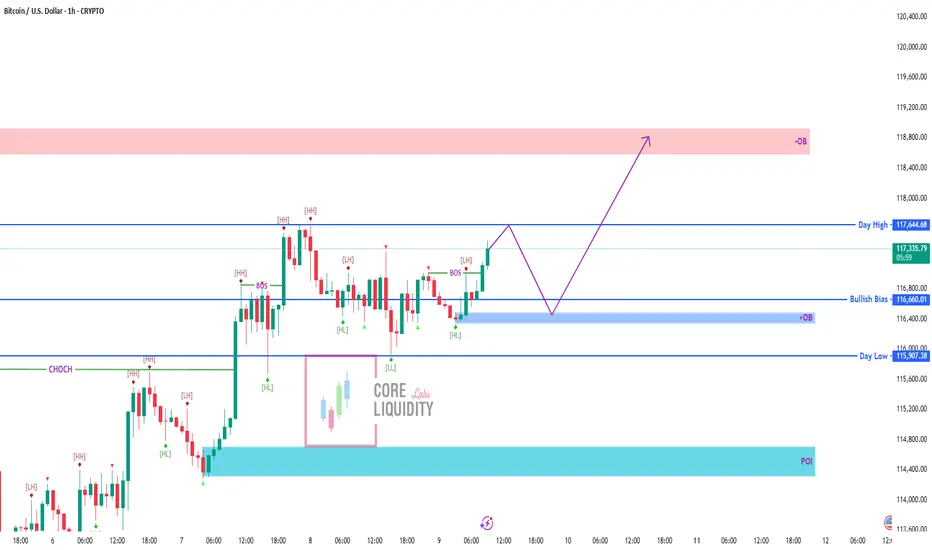
BTC/USD – Eyes on the Next Breakout BTC is holding strong bullish momentum above 116,660 📈. Liquidity is building, and a quick pullback into the OB buy zone could be the last chance before we push towards Day High (117,644) and beyond to the 118,800 supply zone.
💡 Smart money loves this setup: grab liquidity, load positions, and ride the breakout.
This is where the big moves happen — don’t blink or you’ll miss it.
🎯 Buy Zone: 116,660 – 116,000 OB
🎯 Targets: 117,644 / 118,800 OB
⚠️ Invalidation below 116,000
🔥 Get ready — the market’s about to move fast.
BTC/USD – 1H Smart Money Outlook | CoreLiquidity Labs🔹 Price: $114,014
🔹 Market Structure:
– CHoCH + Lower High confirms bearish pressure
– Price currently reacting to the Rejection Zone under Bearish Bias level ($114,143)
📉 Bearish Scenario (Primary Bias):
→ Rejection from zone
→ Target 1 = +OB zone near $113,400
→ Target 2 = POI + Day Low = $112,674
→ Final Target = Weak Low Sweep (Liquidity Grab)
📈 Invalidation (Bullish Breakout):
If price breaks above the Rejection Zone + Day High ($115,145), expect a shift toward upper OB levels.
🧠 Execution Tip:
Monitor lower TFs for MSS or CHoCH confirmation before executing short.

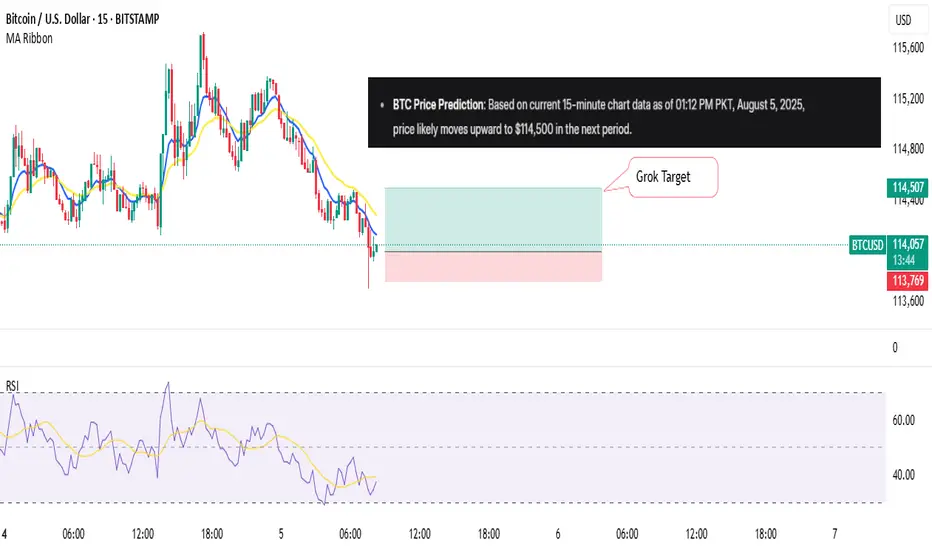
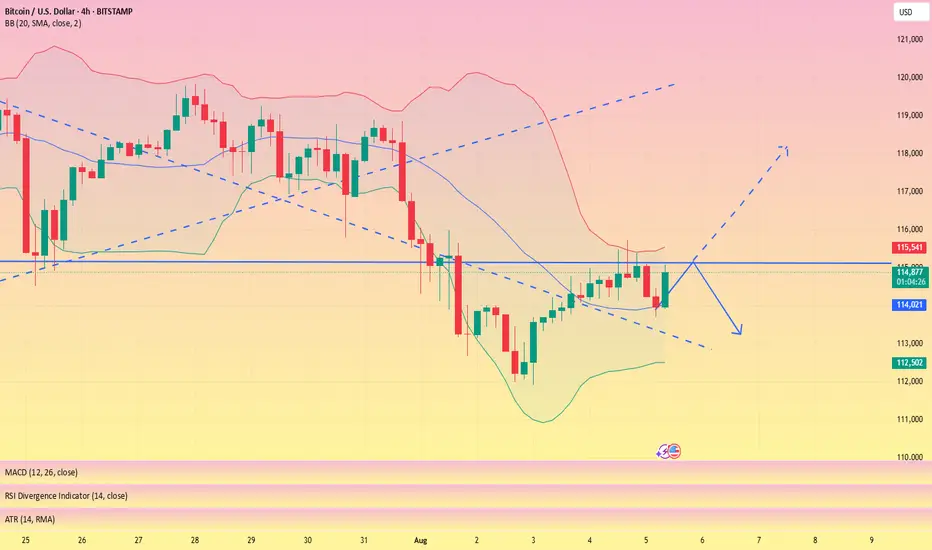
Asking Grok to Predict BTC priceI asked Grok to choose 2 indicators and then predict the next Move of BITSTAMP:BTCUSD
We'll check back soon
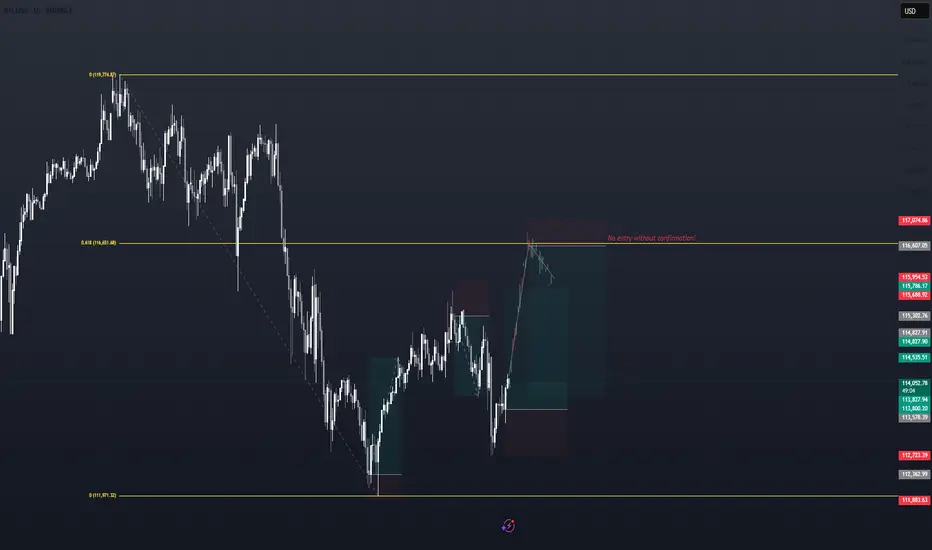
BTCUSD - Right to the point!In the last post (see the Linked Chart), I showed why BTCUSD would fall, and I also pointed out where the first price level for a possible pause might be.
On Friday, that level was reached, and the market seems to be turning *on the dot*. Will we now see higher prices again, or even a new all-time high? Let’s take a closer look:
The “confluence” point is marked by the white fork and the yellow modified Schiff fork. This point lies exactly on the 1/4 line. And this line often indicates temporary levels where at least a pause in the movement can be expected.
When we look at what Bitcoin did at this price level in mid-June, it seems likely that it will rise again. The overall pattern, from the centerline to the 1/4 line, looks extremely similar (see the A-B-C Wave Pattern)!
And yet, I’m not entirely convinced by the picture. Because this was the second time we reached the centerline.
For the brave, this wouldn’t be a bad entry point—or an opportunity to increase the position after this pullback. A possible stop for traders could be placed just below the current low, with targets at the centerline of course.
But why not just lean back, enjoy the profits, and switch into observation mode for now…
I will also make a video that explains the details and connections more clearly.
Happy Monday and stay patient to fight the FOMO! §8-)

BTCUSD Technical Analysis| Zones and MomentumHi there,
BTCUSD has completed a five-wave impulse and entered an A-B-C corrective structure, with Wave C potentially targeting lower levels. Many traders watch for reversal signals, aiming for the $88K–$91K area. If those levels are broken, they expect a drop toward $68K–$62K.
😐 A clear break above $112K would invalidate that bearish scenario.
__
🎙️So, what do we say? What we have here, I’ll call it market manipulation. The current candle price momentum is bullish, but it suggests that Wave C is unstable. The rally from Wave C is challenged by the resistance zone pressing on Wave B, forming bearish liquidity. Overall, there is bullish momentum within a bearish territory.
What we could see is the formation of a (H) leading to a low, which will be decisive for what happens next. In effect, a LH (lower high) that breaks Wave C needs to happen for a bearish indication.
Many traders aim for the $91K–$88K area, and since many are looking there, these levels could entice more sellers to enter the market. Therefore, we won’t pay much attention to them. Instead, we are more interested in what will happen around $114,939—that is, the indecision area of the entire structure.
Conclusion:
🦉 Due to bull candles under a strong resistance zone, the market structure is currently neutral overall with conflicting signals with no clear direction.
Happy Trading,
Khiwe.

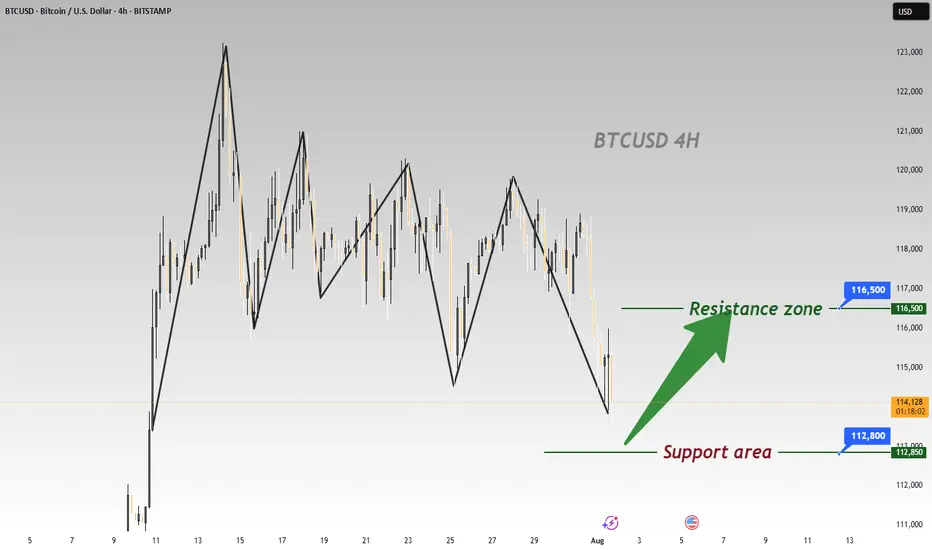
BTC Plummets Post-NFP; Go Long for Rebound to 116500BTC has plummeted significantly under the influence of the non-farm payroll data 📉, and now is an excellent opportunity to go long. Its Support level is around 112800, and according to the current trend, we can wait for a rebound to around 116500.
⚡️⚡️⚡️ BTCUSD ⚡️⚡️⚡️
🚀 Buy@ 113000 - 113800
🚀 TP 114500 - 115500 - 116500
Daily updates bring you precise trading signals 📊 When you hit a snag in trading, these signals stand as your trustworthy compass 🧭 Don’t hesitate to take a look—sincerely hoping they’ll be a huge help to you 🌟 👇
Current situation BTCUSD Current situation
The price is trading around $114,959, having reached a daily high of ~$115,678 and a low of ~$113,851.
BTC is holding the 50-day moving average (SMA) and the downtrend is not dominant - this level is an important technical support.
A bull flag pattern has formed, which indicates a likely further upward momentum. Support is formed near $110,000, and a potential breakout target is $120,000.
Technical patterns and levels
The inverted head and shoulders pattern on the weekly chart indicates further growth. The neckline is at ~$115,000 - its breakout can open the way to targets in the range of $132K - $141K, and the theoretical measurement of the movement predicts up to $172,000, which is ~50% growth.
After an unsuccessful attempt to overcome the resistance at ~$115,600, the bearish trend remains in the short term.
However, the stability above $114,500 is supported by the growth of institutional interest and the inflow of capital into crypto products, which creates the preconditions for a possible breakout.
Main levels and signals
Support: ~$110,000 is a critical level, the violation of which will cross out the optimistic scenarios.
Resistance: ~$115,600–115,700 is the nearest barrier. A sustainable breakthrough through it with volume can open the way up.
Goals for growth: $120,000 → then $132,000–141,000 → potentially up to $172,000.
Risks: A failure below $110K can trigger a deep correction. .
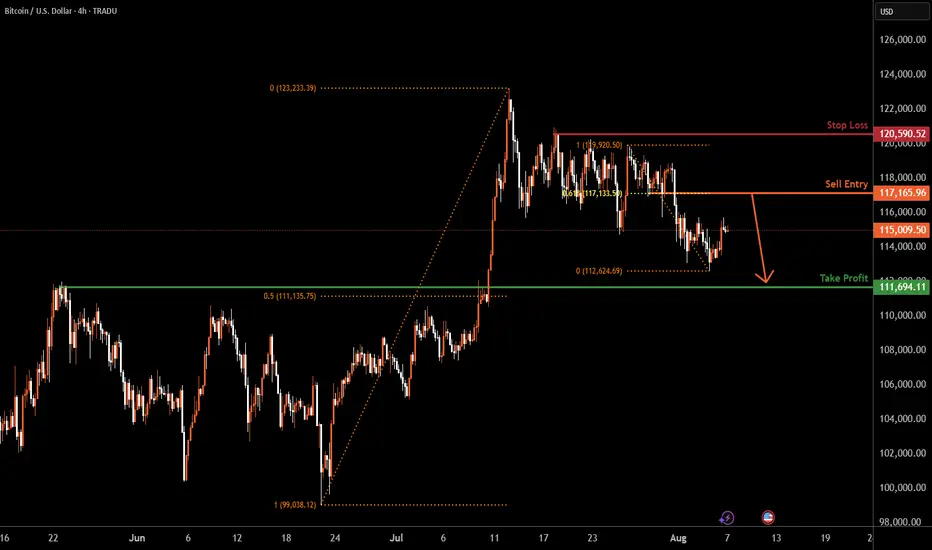
BITCOIN H4 | Heading into 61.8% Fibonacci resistanceBased on the H4 chart analysis, we could see the price rise to the sell entry at 117,165.96, which is a pullback resistance that aligns with the 61.8% Fibonacci retracement and could drop from this level to our take profit.
Stop loss is at 120,590.52, which is a pullback resistance.
Take profit is at 111,694.11, which is a pullback support that is slightly above the 50% Fibonacci retracement.
High Risk Investment Warning
Trading Forex/CFDs on margin carries a high level of risk and may not be suitable for all investors. Leverage can work against you.
Stratos Markets Limited (tradu.com ):
CFDs are complex instruments and come with a high risk of losing money rapidly due to leverage. 65% of retail investor accounts lose money when trading CFDs with this provider. You should consider whether you understand how CFDs work and whether you can afford to take the high risk of losing your money.
Stratos Europe Ltd (tradu.com ):
CFDs are complex instruments and come with a high risk of losing money rapidly due to leverage. 66% of retail investor accounts lose money when trading CFDs with this provider. You should consider whether you understand how CFDs work and whether you can afford to take the high risk of losing your money.
Stratos Global LLC (tradu.com ):
Losses can exceed deposits.
Please be advised that the information presented on TradingView is provided to Tradu (‘Company’, ‘we’) by a third-party provider (‘TFA Global Pte Ltd’). Please be reminded that you are solely responsible for the trading decisions on your account. There is a very high degree of risk involved in trading. Any information and/or content is intended entirely for research, educational and informational purposes only and does not constitute investment or consultation advice or investment strategy. The information is not tailored to the investment needs of any specific person and therefore does not involve a consideration of any of the investment objectives, financial situation or needs of any viewer that may receive it. Kindly also note that past performance is not a reliable indicator of future results. Actual results may differ materially from those anticipated in forward-looking or past performance statements. We assume no liability as to the accuracy or completeness of any of the information and/or content provided herein and the Company cannot be held responsible for any omission, mistake nor for any loss or damage including without limitation to any loss of profit which may arise from reliance on any information supplied by TFA Global Pte Ltd.
The speaker(s) is neither an employee, agent nor representative of Tradu and is therefore acting independently. The opinions given are their own, constitute general market commentary, and do not constitute the opinion or advice of Tradu or any form of personal or investment advice. Tradu neither endorses nor guarantees offerings of third-party speakers, nor is Tradu responsible for the content, veracity or opinions of third-party speakers, presenters or participants.
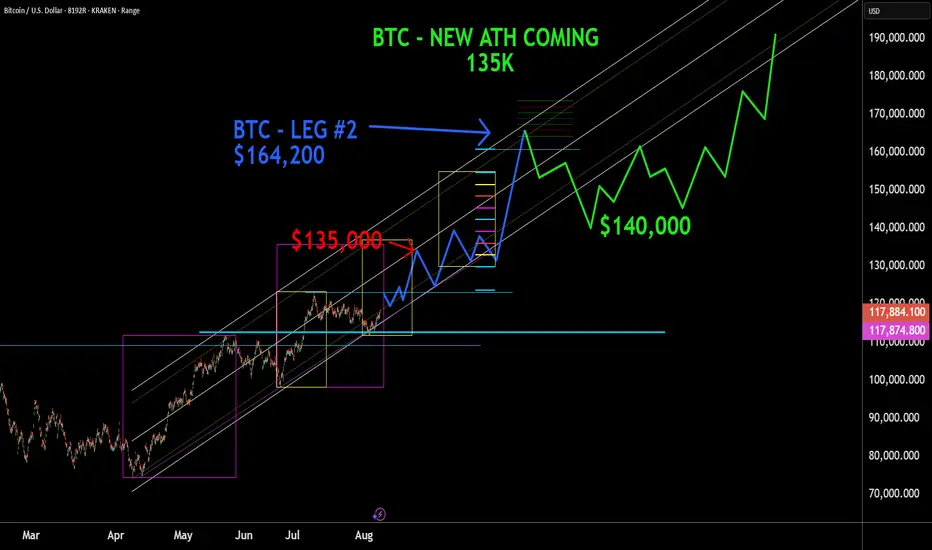
BTC - about to go full retardo - $135kI think the title says it all. BTC is about to go into a massive rally. We need to finish out the last little bits of this correction, and go all in. $135k is going to be an easy next target before the next area of Consolidation. That level of consolidation is unlikely to give much back, which will then unleash full retardo mode taking us to near $164,200. Time line is about 6-8 months or so as how it is looking to me today. I will update as we climb. Good Luck. Especially to the traders holding short positions. Ouch.
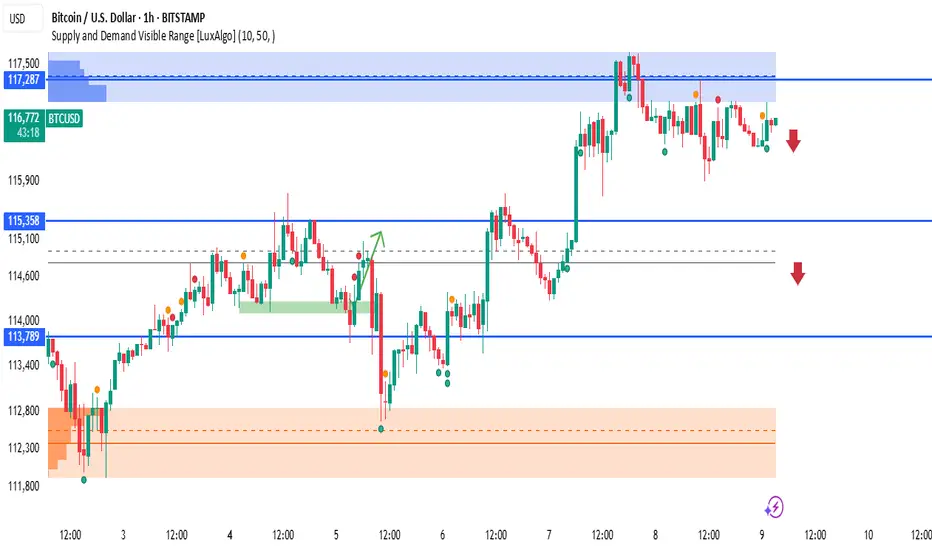
BTCUSD – 1H Supply & Demand Analysisupply Zone: $117,000 – $117,500 (marked in blue)
This zone previously triggered a sharp sell-off, indicating strong selling pressure.
Immediate Support: $115,358
A break below could open the way for further downside toward $113,789.
Demand Zone: $112,800 – $113,400 (orange zone)
Strong buying activity previously emerged here, pushing BTC upwards.
📈 Possible Scenarios:
Bearish Rejection – If price fails to break above $117,287, we could see a move back toward $115,358 and possibly $113,789.
Breakout Confirmation – A strong candle close above $117,500 could trigger a bullish continuation toward higher resistance levels.
🔻 Bias:
Short-term bearish while price remains below $117,287, with potential retracement toward the lower supports.
Disclaimer: This analysis is for educational purposes only and does not constitute financial advice. Always do your own research before trading.
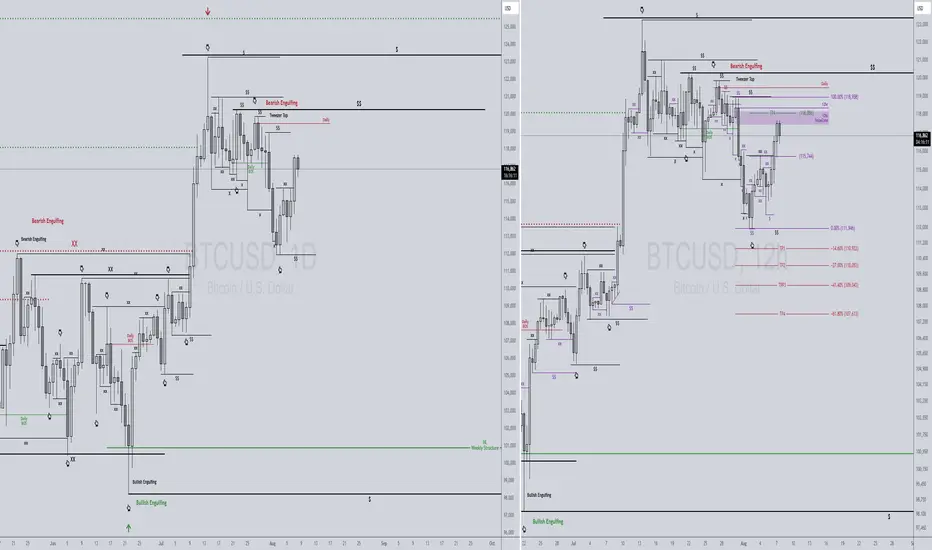
BTCUSD 8/8/2025Price is at a pivotal point in the market, where we should start to see Price breaking down to encounter its Bearish Continuation. Just reading Candles, we should see Equal Highs be formed here in the SnipeZone, that will be used as the catalyst for Price to produce a Bearish expansion.
_SnipeGoat_
_TheeCandleReadingGURU_
#PriceAction #MarketStructure #TechnicalAnalysis #Bearish #Bullish #Bitcoin #Crypto #BTCUSD #Forex #NakedChartReader #ZEROindicators #PreciseLevels #ProperTiming #PerfectDirection #ScalpingTrader #IntradayTrader #DayTrader #SwingTrader #PositionalTrader #HighLevelTrader #MambaMentality #GodMode #UltraInstinct #TheeBibleStrategy
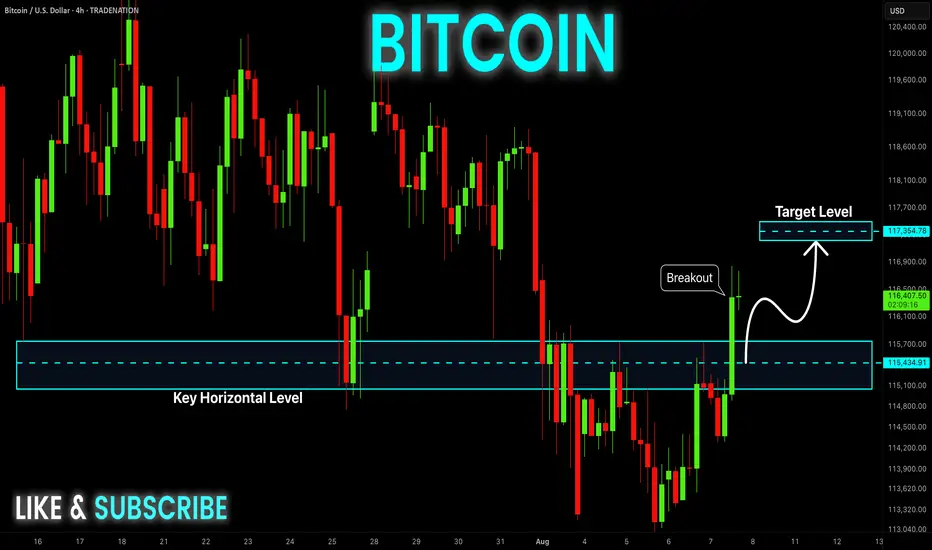
BITCOIN Bullish Breakout! Buy!
Hello,Traders!
BITCOIN made a bullish
Breakout of the key horizontal
Level of 115,5k$ and the
Breakout is confirmed so
We are bullish biased and
We will be expecting a
Further bullish move up
Buy!
Comment and subscribe to help us grow!
Check out other forecasts below too!
Disclosure: I am part of Trade Nation's Influencer program and receive a monthly fee for using their TradingView charts in my analysis.
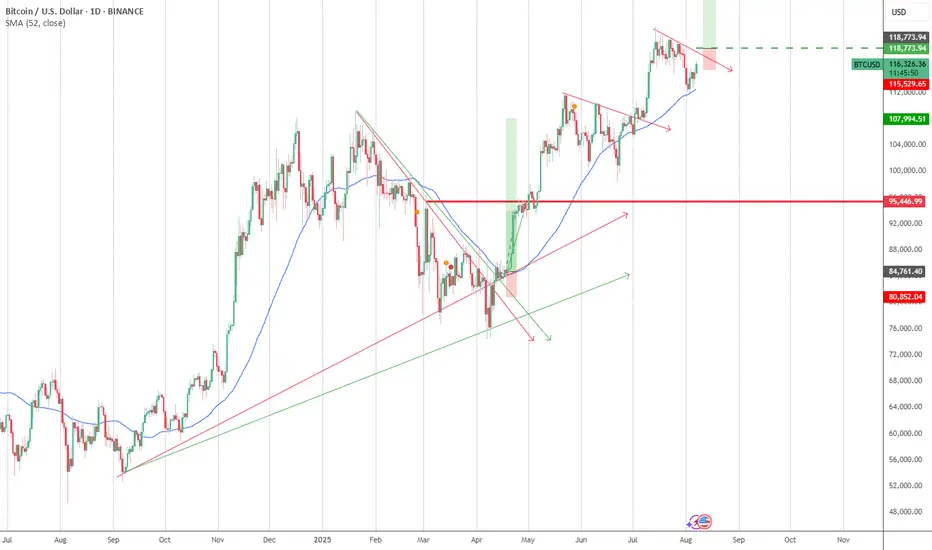
BITCOIN ready to fly.Bitcoin is going to fly the following 3 weeks arriving till 143k$-145k$
In September will see the price going down to visit the 125k$ level, and UPTOBER will bring us the last surprise, a bitcoin arriving till 167k$
And that´s all.
Good luck to everyone.
We´ll see 65k$ ending 2026 or begining 2027.
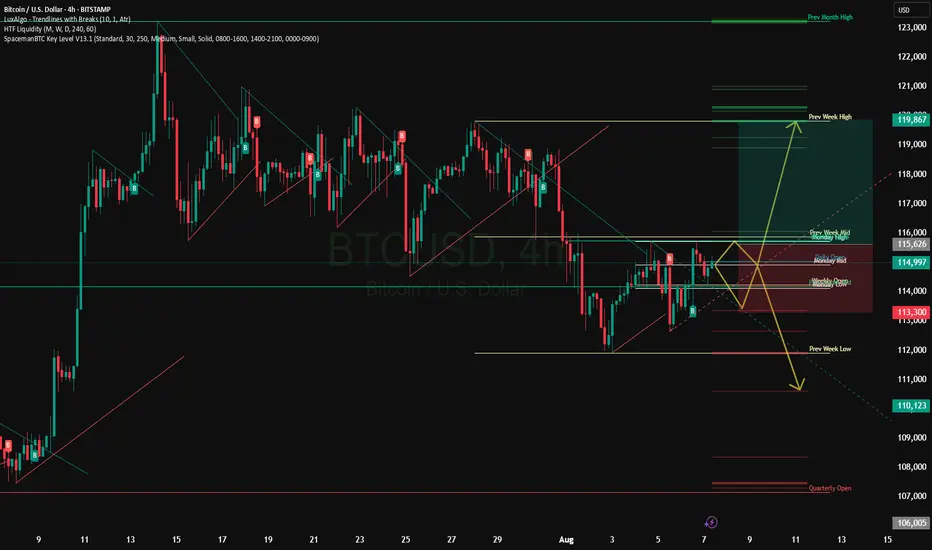
BTC intraday strategy analysis and operation layout#BTCUSD
Currently, BTC rebounded again to test the upper resistance area of 115000-116000, indicating that buyers are still defending this structure, but it is still suppressed by the upper resistance. From a derivatives perspective, open interest has fallen by 0.91% over the past 24 hours, while options trading volume has also fallen by over 13%, indicating a decrease in speculative activity. Despite a 34.28% increase in 24-hour trading volume to $61.71 billion, the long-short ratio has fallen below 1.0, reflecting cautious market sentiment.
As long as BTC maintains above 114,000-113,000, the short-term structure remains neutral. If it fails to break through the overhead resistance and stabilize above 116,500, bulls may lose control of the lower trendline of the channel, triggering a renewed bearish push.
If BTC can successfully hold above 116,500, it could potentially return to 118,000 or even challenge the macro resistance level of 120,000. On the contrary, if BTC finds it difficult to break through the short-term resistance level, it will still return to the 114,000-113,000 area.
🚀 BUY 116,500-117,000
🚀 TP 118,000-119,000
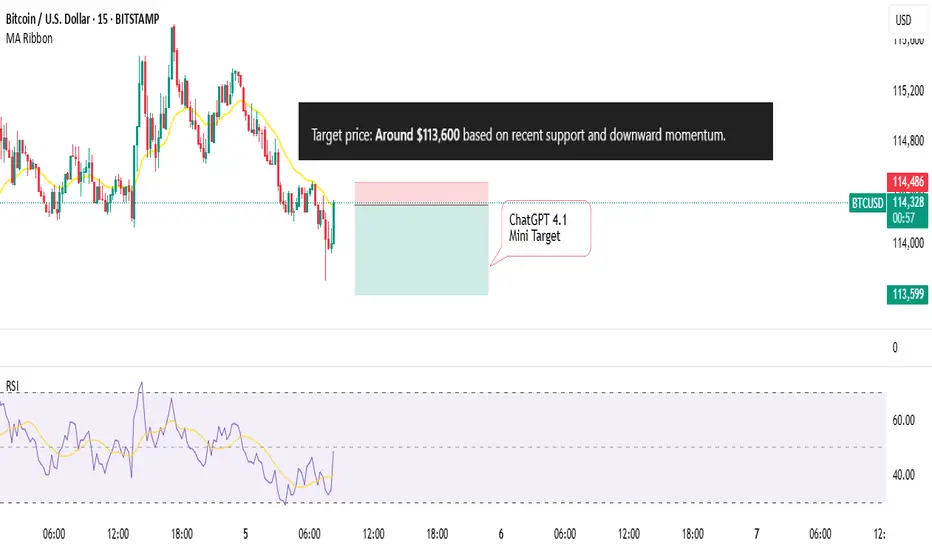
I asked ChatGPT to predict Bitcoin PriceAlso, I asked Grok to choose 2 indicators and then predict the next Move of
BITSTAMP:BTCUSD
We'll check back soon
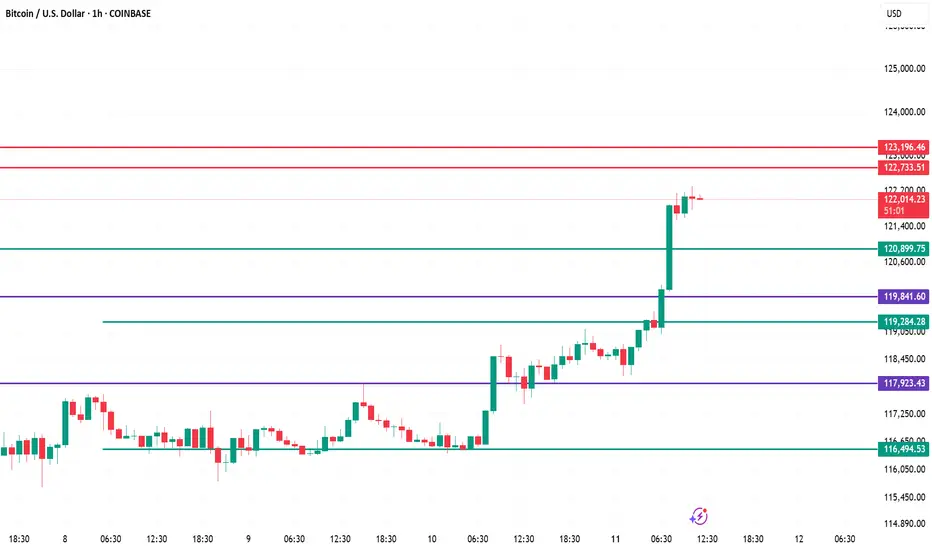
Bitcoin 1H Chart – Analysis
Current Momentum – Strong bullish breakout above key resistance zones 119,841 and 120,899, indicating aggressive buying pressure.
Immediate Resistance – Price is now approaching 122,733–123,196, a heavy supply zone; possible short-term profit booking area.
Support Levels – Nearest support now sits at 120,899, followed by 119,841. Holding above these keeps momentum intact.
Market Structure – Clear higher highs and higher lows; trend remains bullish unless price breaks below 119,284.
Trading Plan – Ride the uptrend with trailing stops; watch for reversal signals at 122,733–123,196 or continuation breakout above 123,200 for fresh upside.