#Bitcoin Sunday Analysis: $BTC is holding near $118,330 #Bitcoin Sunday Analysis:
CRYPTOCAP:BTC is holding near $118,330 after last week’s bounce from $112,398, maintaining strong bullish momentum. Macro developments — including Trump’s $12.5T pension fund order allowing BTC inclusion, pro-crypto Fed nomination, and anti-debanking executive order — mark historic steps toward full BTC integration into the U.S. financial system.
🔸 Key Support Zone at $112,000–$113,000:
Liquidity pools remain here; market makers may dip price into this zone before resuming upside. This area offers a high-probability long entry.
🔸 Upside Target: $120,000 (Short-Term)
A breakout above range resistance could open the path to $125,000–$130,000 mid-term, fueled by whale accumulation, strong ETF inflows, and returning retail interest.
🔸 Risk Level at $110,000:
A sustained loss below this zone could slow bullish momentum, but macro and on-chain data suggest dips are buying opportunities.
🔸 Outlook:
Watch $112K–$113K for entries. Stay bullish above $110K. Prepare for possible volatility with CPI data Tuesday and PPI Thursday as potential breakout catalysts.
BTCETH.P trade ideas
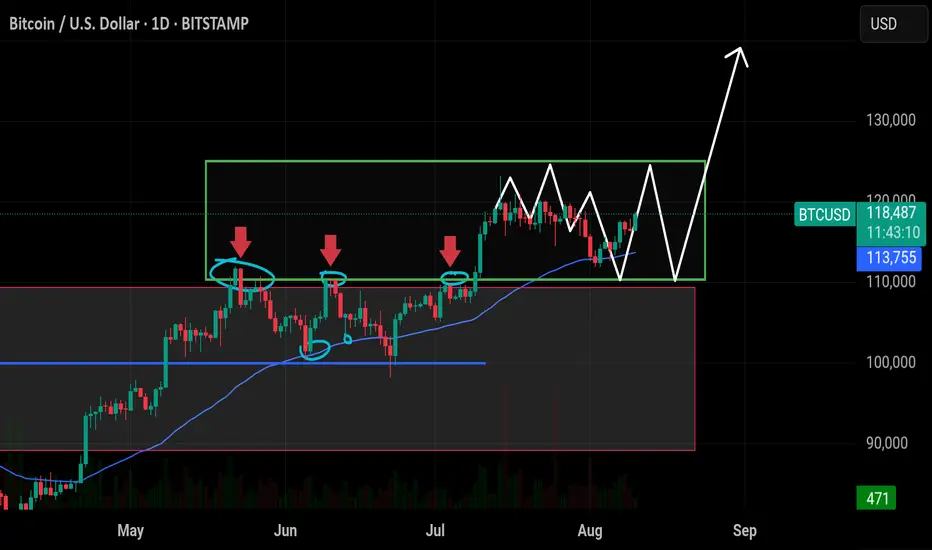
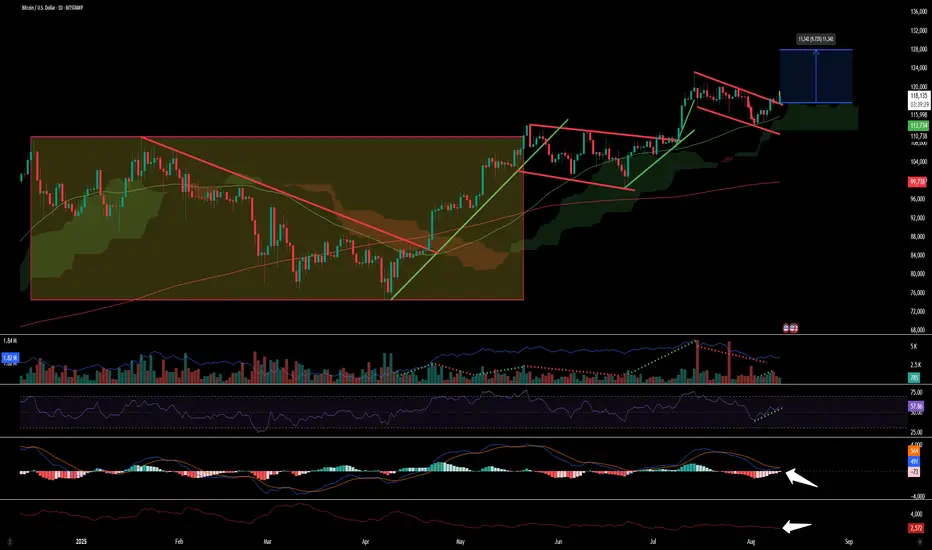
Bear trap 2 is the strongest 〉170k Next.An update from my latest BTC projection to 140K.
Seeing the current market structure and price action, I can start visualizing potential extensions above 140K, reaching 165-170K.
As illustrated, some key price action behavior that has occurred that supports the idea of a further bull run.
An initial bear trap following by a second one creating even more liquidity which the market will likely target faster and stronger as people go against the trend.
Fundamentals keep adding fuel to BTC...
US opening up more and more at an institutional level, adding BTC to citizen's 401k's;
El Salvador is very likely to be the first country in the world to open a BTC ONLY BANK.. offering private financial services nominated ONLY in BTC;
And the list goes on...
-
Of course, one can't fall in love with the idea and must adapt in case price action shows otherwise... the possibility for a correction to 60K is open, although more and more unlikely as price nears ATH and respects bullish structure.
...
GOOD LUCK
persaxu.

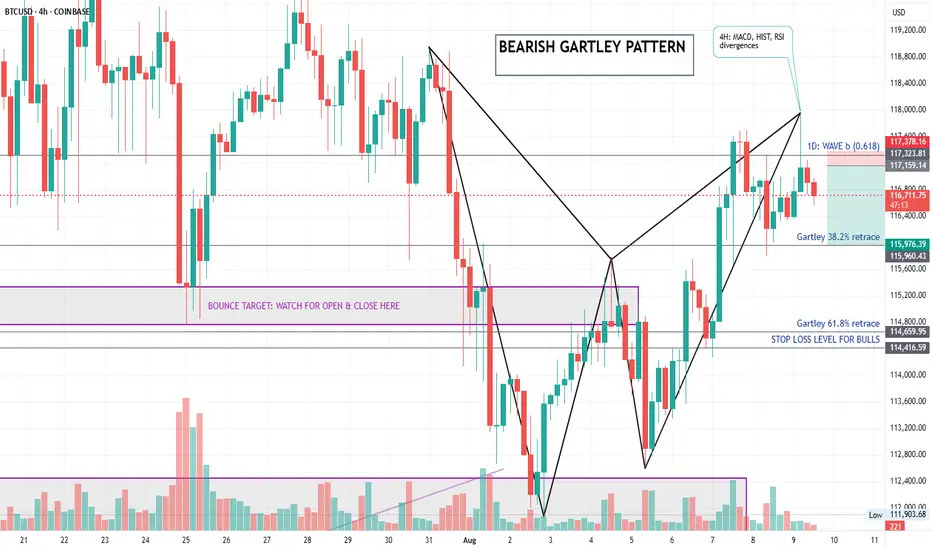
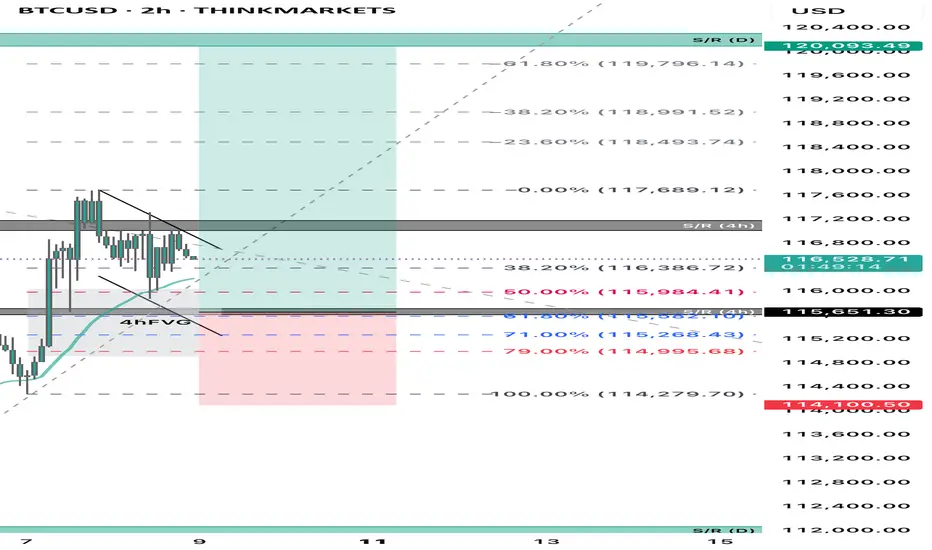
BITCOIN BEARISH GARTLEY SETUP A bearish Gartley harmonic pattern has completed on the 4 hour timeframe of Bitcoin suggesting a potential pullback. The pattern also has some indicators divergence as a confluence. Short position opened at the lower high has downside targets at the 38.2% and 61.8% Fibonacci retracements. Stop loss placed just above the lower high to protect against invalidation.
Cheers my fellow traders.
Major Warning: Bitcoin Breaches Key Support with Bearish SignalsBitcoin has officially broken down from its recent consolidation zone, closing below the critical 21 EMA on the daily chart. This move, combined with reversal signals on both the weekly and daily timeframes, suggests that downward pressure is intensifying.
In this video, I’ll walk you through:
• The candlestick patterns signaling reversal
• The significance of the 21 EMA breach
• Confirmed divergences from key indicators
• What this means for short-term and long-term price action
Whether you're holding Bitcoin or trading around it, this is a pivotal moment. The charts are speaking—are you listening?

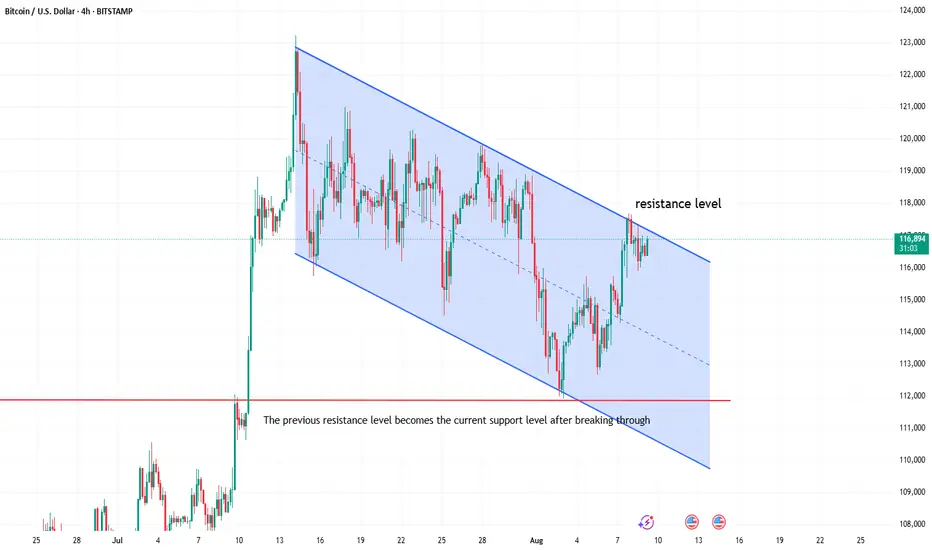
Bitcoin market analysisBitcoin has been fluctuating downward since it hit a new high on July 14. It rebounded upward after testing the downward support level on August 3. What we need to pay attention to now is the upper resistance level of the downward channel. If it breaks through, this adjustment will end and you can go long on the pullback. We need to pay attention to the support near 11,200 below. You can consider going long with a light position near 11,200, with a stop loss of 1,000-1,500, and see the strength of the rebound.
Break and Retest Idea for BitcoinLooking to test this break and retest setup on 2hr for bitcoin. Mark up says it all.
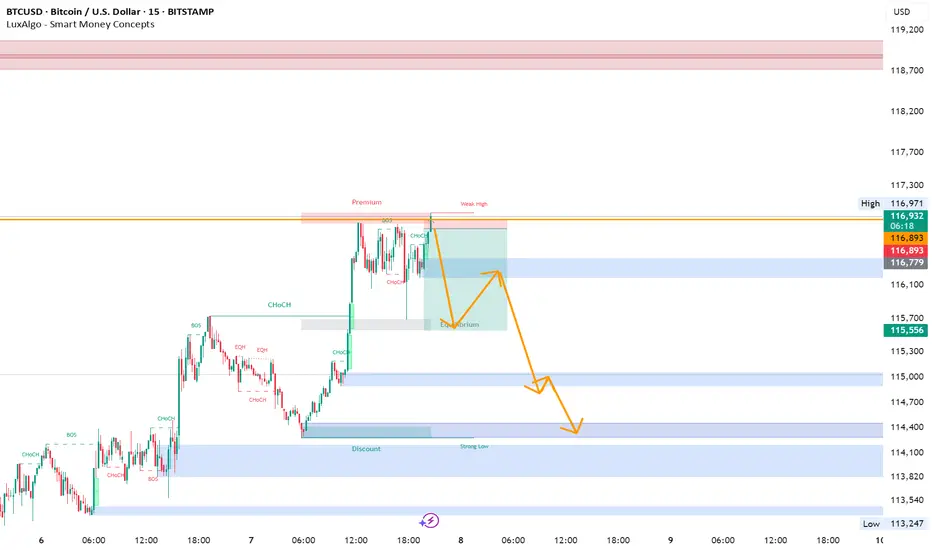
BTC sell set upBack in the markets 🔥
Finally trading again after one of the toughest years personally — and what a start.
📈 Currently up +21% on the account today! Some quick BTC scalps + a longer hold on BTC buys doing the heavy lifting.
🛑 Running a high-risk setup against the trend, but it’s tightly managed with a well-defined stop and fully within my risk profile.
🎯 Targeting a lower order block based on imbalance/FVG from the previous move. Risk-to-reward sits at a juicy 1:21 if we reach TP.
📌 Will secure break-even ASAP — even if I get tapped out, the setup is managed and calculated.
Let’s see how this plays out. Eyes on the chart 👀
#BTC #CryptoTrading #RiskManaged #BackAtIt #CryptoAnalysis #Scalping #OrderBlocks
Trade with me - my simple short term trading strategy - on BTCThis is a walk through of how I prepare and execute on one of my shorter-term and more simple trading strategies.
Unfortunately it's a longer video than I had hoped but feel free to watch sped up and skip around - most of the action happens towards the end but I offer a lot of great insights throughout for those with the time and patience to watch through.
Happy Trading :)

How to Analyze BTC/USD on TradingViewTradingView provides a variety of built-in tools and indicators that can help us analyze crypto markets more effectively. Once connected with Alpaca, these tools become part of a seamless workflow for charting and order execution.
Please note we are using BTC/USD as an example and it should not be considered investment advice.
How to connect Alpaca to TradingView account
To begin, link your Alpaca trading account with your TradingView account. You can follow the tutorial below by connecting your Alpaca account to your TradingView account. If you don’t have an Alpaca account but have a TradingView account, you can sign up for an Alpaca account.
Using Trendlines for Bitcoin Analysis
A trendline helps visualize the general direction of price movement. It’s commonly used to identify support and resistance zones in both uptrends and downtrends. The chart below displays BTC/USD price action on a daily timeframe. Two parallel trendlines define a descending price channel, capturing a series of lower highs and lower lows over an extended period. Descending channels like this are commonly used to monitor trend continuation or assess potential breakout scenarios.
Please note that this screenshot is for hypothetical and illustrative purposes only. Past results do not guarantee future returns, and actual results may vary from the analysis.
Bitcoin Analysis with Fibonacci Retracement
Fibonacci retracement is a technical tool used to identify potential support or resistance levels during pullbacks in a trending market. It’s drawn between a recent high and low, marking key levels like 38.2%, 50%, and 61.8% where price may temporarily reverse.
Please note that this screenshot is for hypothetical and illustrative purposes only. Past results do not guarantee future returns, and actual results may vary from the analysis.
Trend-based Fibonacci Extension for BTC/USD
Trend-based Fibonacci Expansion is a tool that projects how far a bullish or bearish trend may extend using Fibonacci ratios. By anchoring to key price points—such as the trend’s start, its initial move, and the corrective leg—it helps estimate future target levels. Traders may use long-term moving averages, like the 35, 50, or 200-period SMA, to validate the broader trend before applying this tool. Common Fibonacci extension levels include 1.0 as a conservative target and 1.618 as a widely used sweet spot for trend continuation.
Please note that this screenshot is for hypothetical and illustrative purposes only. Past results do not guarantee future returns, and actual results may vary from the analysis.
Conclusion
Trading BTC/USD is a popular starting point in cryptocurrency trading due to its liquidity, USD pricing, and readily available analysis tools. Traders may possibly employ various strategies, including day trading, swing trading, and long-term investment, depending on their risk tolerance and time commitment. Platforms like TradingView, integrated with Alpaca, offer robust charting and execution capabilities for both manual and algorithmic trading. Alpaca's Trading API further enables developers to automate strategies, such as bull call spreads.
However, it's crucial to remember that all trading involves risk, and cryptocurrency markets are particularly volatile. Effective risk management, a clear trading plan, and staying informed are essential.
We hope you've found this tutorial on how to trade “BTC/USD” in real-time with Alpaca’s Trading API, dashboard, or TradingView integration insightful and useful for getting started on your own strategy. As we put these concepts into practice, feel free to share your feedback and experiences on our forum, Slack community, or subreddit! And don’t forget to check out the rest of our crypto-trading tutorials.
For those looking to integrate crypto trading with Alpaca’s Trading API, you can find some additional resources on our Profile page.
=====================================================================
Disclosure
Alpaca and TradingView are not affiliated and neither are responsible for the liabilities of the other.
Please note that this article is for general informational purposes only and is believed to be accurate as of the posting date but may be subject to change. The examples above are for illustrative purposes only.
Please note that this article is for general informational purposes only and is believed to be accurate as of the posting date, but may be subject to change. The examples above are for illustrative purposes only. All examples are for illustrative purposes only.
Alpaca does not prepare, edit, or endorse Third Party Content. Alpaca does not guarantee the accuracy, timeliness, completeness or usefulness of Third Party Content, and is not responsible or liable for any content, advertising, products, or other materials on or available from third party sites.
All investments involve risk, and the past performance of a security, or financial product does not guarantee future results or returns. There is no guarantee that any investment strategy will achieve its objectives. Please note that diversification does not ensure a profit, or protect against loss. There is always the potential of losing money when you invest in securities, or other financial products. Investors should consider their investment objectives and risks carefully before investing.
Cryptocurrency is highly speculative in nature, involves a high degree of risks, such as volatile market price swings, market manipulation, flash crashes, and cybersecurity risks. Cryptocurrency regulations are continuously evolving, and it is your responsibility to understand and abide by them. Cryptocurrency trading can lead to large, immediate and permanent loss of financial value. You should have appropriate knowledge and experience before engaging in cryptocurrency trading. For additional information, please click here: files.alpaca.markets .
The Paper Trading API is offered by AlpacaDB, Inc. and does not require real money or permit a user to transact in real securities in the market. Providing use of the Paper Trading API is not an offer or solicitation to buy or sell securities, securities derivative or futures products of any kind, or any type of trading or investment advice, recommendation or strategy, given or in any manner endorsed by AlpacaDB, Inc. or any AlpacaDB, Inc. affiliate and the information made available through the Paper Trading API is not an offer or solicitation of any kind in any jurisdiction where AlpacaDB, Inc. or any AlpacaDB, Inc. affiliate (collectively, “Alpaca”) is not authorized to do business.
Securities brokerage services are provided by Alpaca Securities LLC ("Alpaca Securities"), member FINRA/SIPC, a wholly-owned subsidiary of AlpacaDB, Inc. Technology and services are offered by AlpacaDB, Inc.
Cryptocurrency services are made available by Alpaca Crypto LLC ("Alpaca Crypto"), a FinCEN registered money services business (NMLS # 2160858), and a wholly-owned subsidiary of AlpacaDB, Inc. Alpaca Crypto is not a member of SIPC or FINRA/ . Cryptocurrencies are not stocks and your cryptocurrency investments are not protected by either FDIC or SIPC. Please see the Alpaca Disclosure Library for more information.
This is not an offer, solicitation of an offer, or advice to buy or sell securities or cryptocurrencies or open a brokerage account or cryptocurrency account in any jurisdiction where Alpaca Securities or Alpaca Crypto, respectively, are not registered or licensed, as applicable.
Alpaca is not affiliated with this third-party website, which is not actively monitored by us. We do not review or update content here regularly and are not responsible for user comments or third-party content. For full disclosures, visit: alpaca.markets
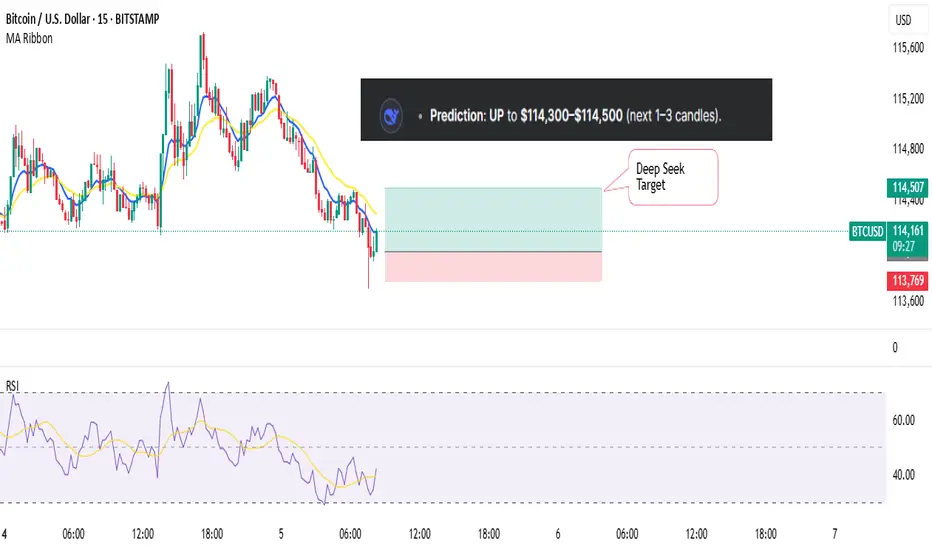
Asking Deepseek to Predict BTC priceI asked Grok to choose 2 indicators and then predict the next Move of
BITSTAMP:BTCUSD
We'll check back soon
Bitcoin, Ethereum Breakout: 401(k) funds & the next "Altseason"Bitcoin is up 10% in August, driven by strong ETF inflows and a game-changing executive order allowing 401(k) retirement funds to invest in cryptocurrencies, potentially bringing trillions of dollars into the sector.
Technically, Bitcoin and Ethereum are breaking out toward multi-year highs, with BTC leading and ETH close behind—setting the stage for a possible "altseason" if these levels hold and capital rotates into altcoins.
This content is not directed to residents of the EU or UK. Any opinions, news, research, analyses, prices or other information contained on this website is provided as general market commentary and does not constitute investment advice. ThinkMarkets will not accept liability for any loss or damage including, without limitation, to any loss of profit which may arise directly or indirectly from use of or reliance on such information.

BTC TO TO 130k!!!Price successfully break Above $120000.00 level. This is a validation/confirmation that BTCUSD is gonna trade a new all time high after we had a higher low around the $112,078 Technically, we’d be waiting for a slight retracement for get in a buy. Next buy target is at the 130k psychological level.

$BTCUSD TAOn the BITSTAMP:BTCUSD Daily Chart, price consolidated in a broad range from December to early May before breaking out. Since April 7th, the rally has formed two bull flags, with each retracement pulling back between the 38.2% and 50% Fibonacci levels. Volume patterns confirm the trend — strong buying volume on rallies and lighter volume during pullbacks.
Price has now broken above resistance, and a daily close above this level would project a minimum measured target near $128K. Momentum indicators — RSI, MACD, and ATR — are all turning higher, reinforcing the bullish breakout structure.
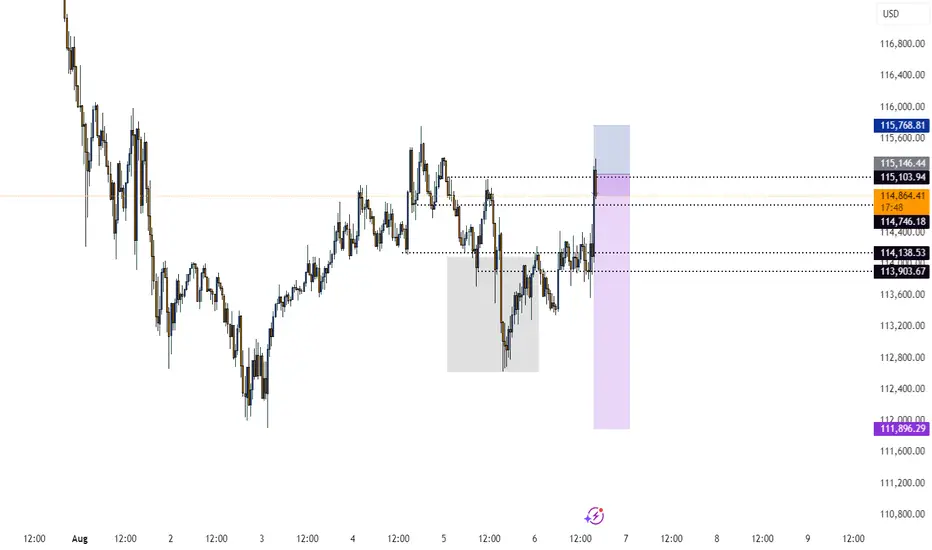
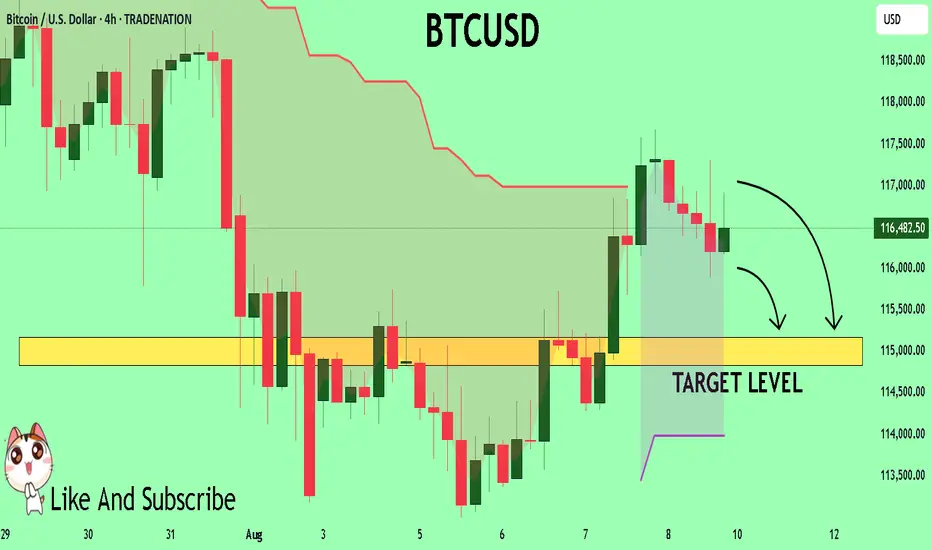
BTCUSD Trading Opportunity! SELL!
My dear subscribers,
This is my opinion on the BTCUSD next move:
The instrument tests an important psychological level 11648
Bias - Bearish
Technical Indicators: Supper Trend gives a precise Bearish signal, while Pivot Point HL predicts price changes and potential reversals in the market.
Target - 11516
About Used Indicators:
On the subsequent day, trading above the pivot point is thought to indicate ongoing bullish sentiment, while trading below the pivot point indicates bearish sentiment.
Disclosure: I am part of Trade Nation's Influencer program and receive a monthly fee for using their TradingView charts in my analysis.
———————————
WISH YOU ALL LUCK
Bitcoin trading ideasLooking at the 4-hour chart, Bitcoin has broken out of its downward channel, marking the end of a nearly two-week correction. The market will continue to test previous highs. Trading strategy remains unchanged, with a focus on buying on pullbacks and exiting the market on profit taking near previous highs. If you have any trading questions, please leave a comment and we'll respond to them.

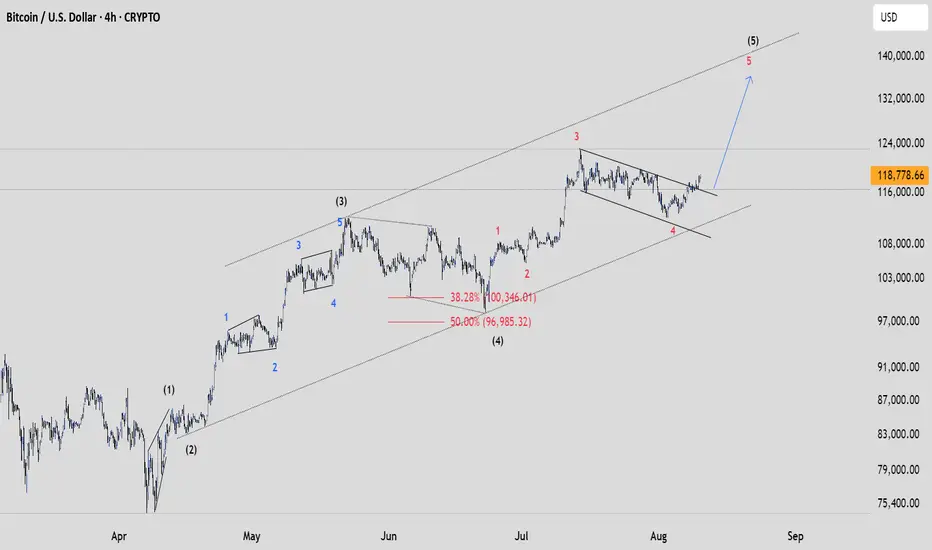
Final Leg Bitcoin just broke out of a wave 4 channel (bullish flag) and it's expected to surge to a new ATH.
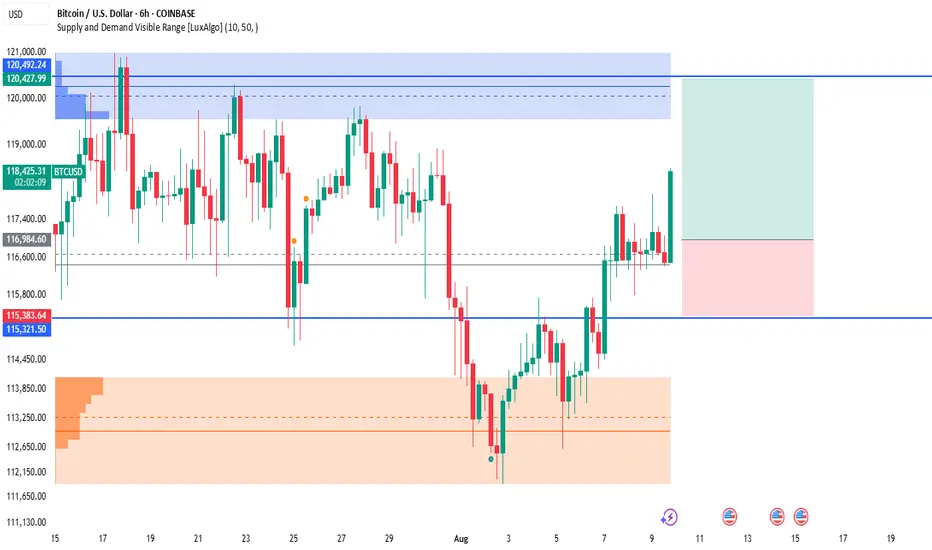
BTCUSD – Bullish Momentum Targeting Supply ZoneBitcoin (BTCUSD) is showing strong bullish momentum after bouncing from the $115,321 – $115,383 support level. Price is now aiming toward the supply zone between $120,428 – $120,492.
🔹 Key Levels:
Supply Zone (Resistance): $120,428 – $120,492
Current Price: ~$118,380
Support Zone: $115,321 – $115,383
Demand Zone: $113,250 – $112,130
🔹 Analysis:
Price has formed a solid rally after retesting key support, confirming bullish strength. As long as price holds above $116,984, the next target remains the supply zone near $120,492. If bulls break above this zone, further upside could be seen.
🔹 Bullish Scenario:
Entry: Above $116,984 support
Target 1: $120,428 – $120,492
Target 2: Potential breakout above $121,000
Stop loss below $115,321
🔹 Bearish Scenario:
Failure to hold above $116,984 could trigger a retracement toward $115,321 and possibly the demand zone at $113,250.
📍 Bias: Bullish toward $120,492 unless support is broken.
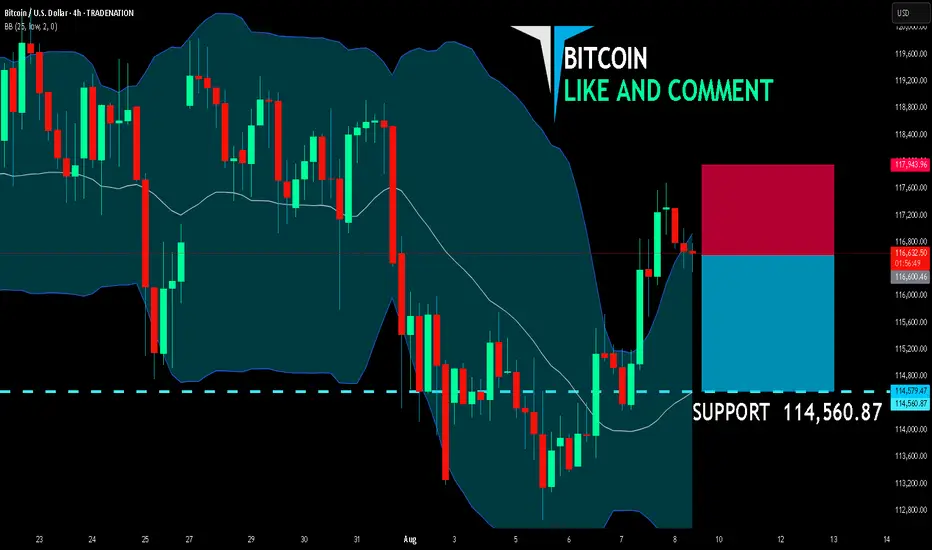
BITCOIN BEARS WILL DOMINATE THE MARKET|SHORT
BITCOIN SIGNAL
Trade Direction: short
Entry Level: 116,600.46
Target Level: 114,560.87
Stop Loss: 117,943.96
RISK PROFILE
Risk level: medium
Suggested risk: 1%
Timeframe: 4h
Disclosure: I am part of Trade Nation's Influencer program and receive a monthly fee for using their TradingView charts in my analysis.
✅LIKE AND COMMENT MY IDEAS✅
As ExpectedThe trend is still bullish, and we expect the price to reach 118.810.
A small correction — about one or two candles — is likely.

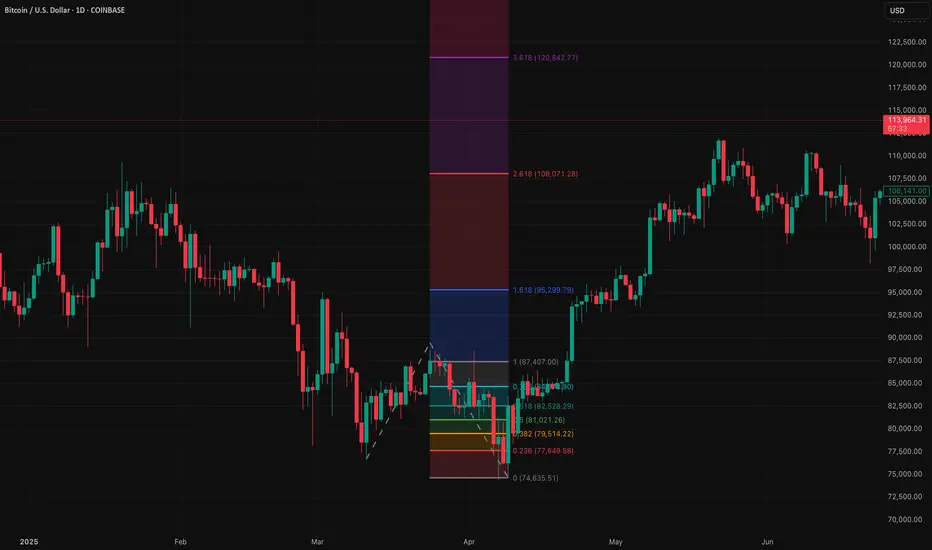
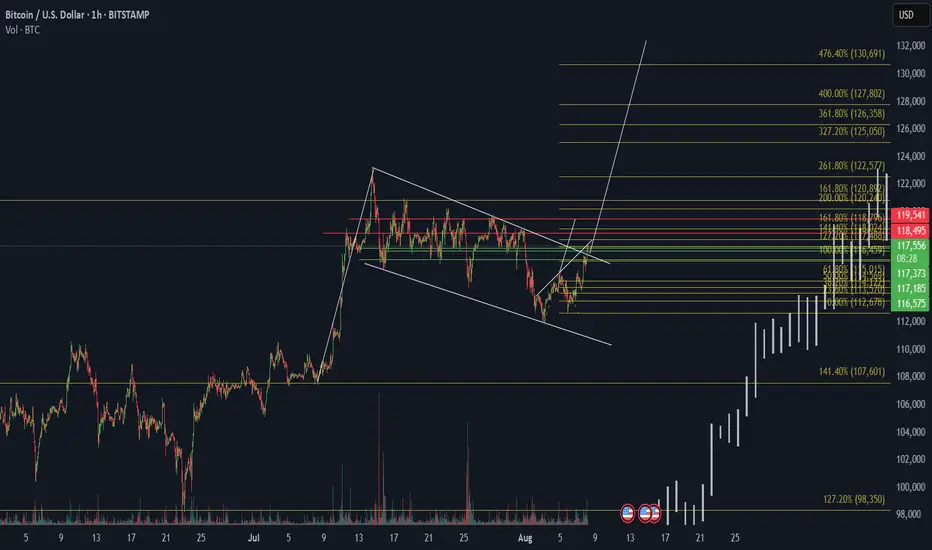
Btc Bullish breakoutTechnical Highlights:
Pattern Breakout: BTC has broken out of a descending wedge, a bullish reversal pattern.
Fibonacci Extensions: The price projection levels are drawn from the recent swing low to high:
1.618 (161.8%) 120,892
2.618 (261.8%) 122,577
3.618 (361.8%) 126,358
4.764 (476.4%) 130,691 = Target Area
Volume: A noticeable volume spike supports the breakout.
Current Price: Around 117,225 reclaiming above key resistance levels.
Bullish Confirmation Levels:
117,373 (Previous resistance now acting as support)
118,495 and 119,541 Strong horizontal resistance to clear
Sustained close above 120K could lead to a parabolic move toward 130K+
The successful trader anticipates activity in BSC🔁 Wallet 0x1ebab9c329317082577f0e495cbe5b0d4958c5e7 just bridged: 4 000 USDC left Ethereum → HitBTC, then 3 915 USDC hit BNB Chain minutes later.
DefiLlama shows ~$14M fresh inflows today in BSC, while ETH flows cool—signaling a rotation play.
Expect this whale to farm BSC yield or snipe rising alts next 📈
🔝 Score: #39 | Balance: $13.4k | Results: $16.4k→$219.5k (+1,340 %, 44 trades, avg buy $1,020 / sell $2,643).
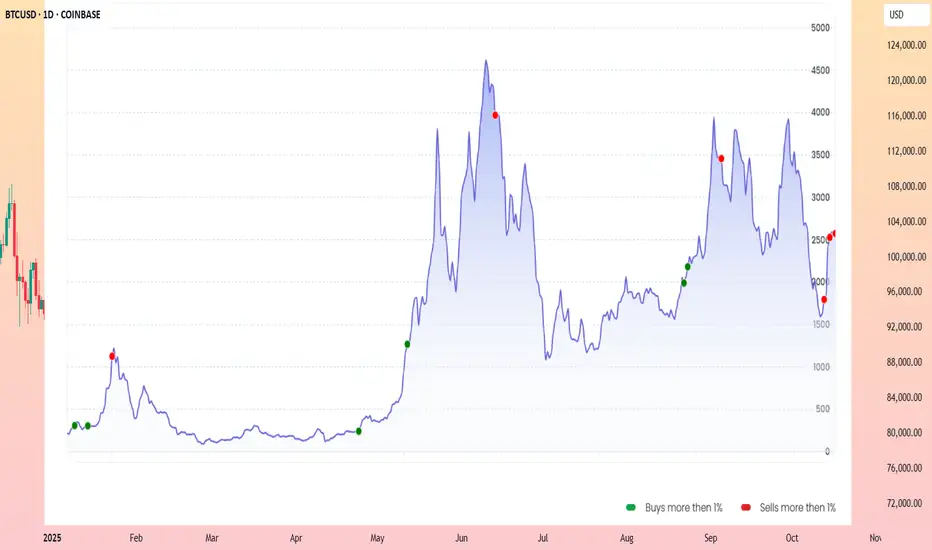
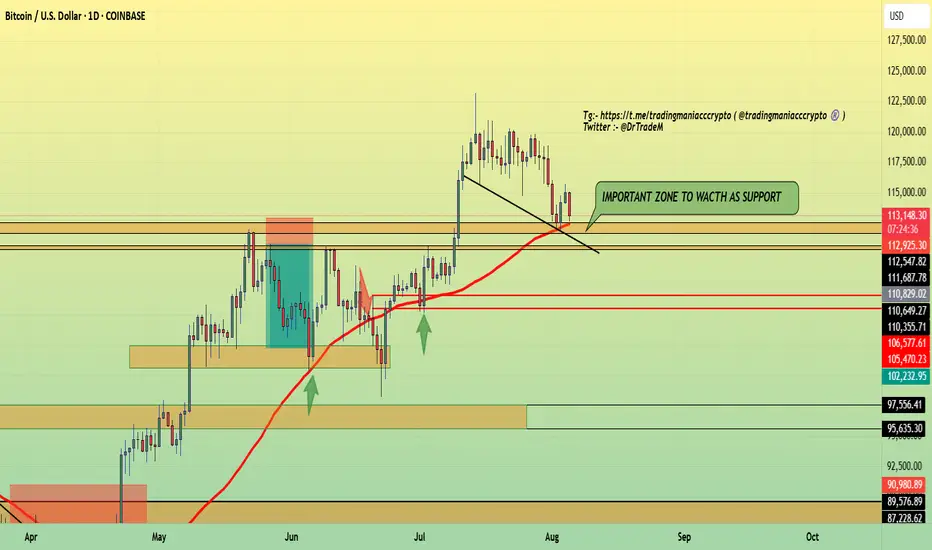
BTC IDEA🚨 #BTC Market Update 🪙
BTC is currently trading at a critical technical level — sitting right above a key horizontal support zone and the 50-day Moving Average (MA), both converging in the $112,500 – $111,600 range. 📊
This confluence of support is playing a crucial role in holding the price action, and historically, the 50 MA has acted as a reliable bounce zone, as highlighted by the green arrows on the chart. 📈✅
⚠️ However, if BTC fails to hold this level and breaks below the 50 MA, we could see a potential 6–7% correction toward the $105,000 ± $500 area.
📌 Key takeaway: This is a decisive zone — monitor it closely and approach long positions with strategic precision.
#Bitcoin #CryptoAnalysis #BTCUpdate #TradingView #CryptoTraders #TechnicalAnalysis