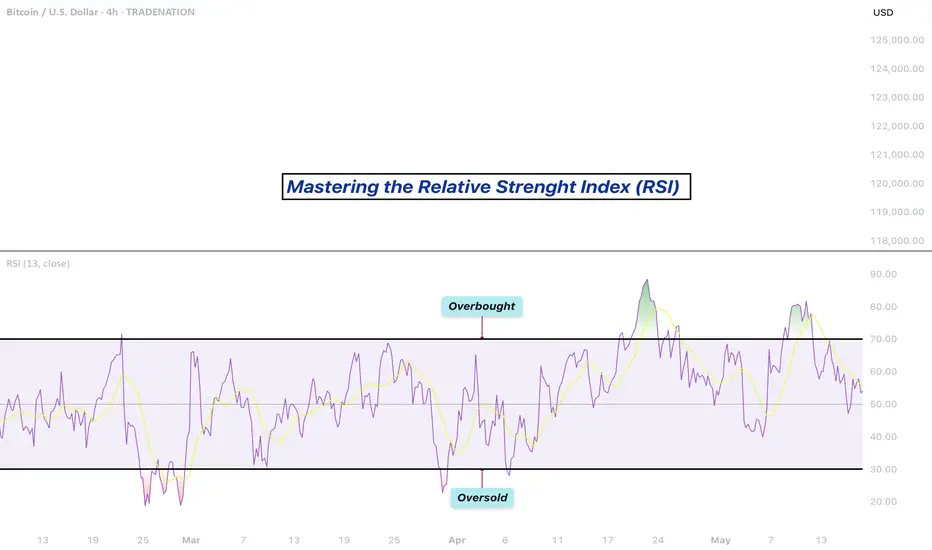
Mastering the RSI - How to use it in trading?What will be discussed?
- What is the RSI?
- RSI overbought
- RSI oversold
- RSI divergences
- How to use the RSI
- How to trade with the RSI
What is the RSI?
The Relative Strength Index (RSI) is a popular momentum oscillator used in technical analysis to measure the speed and change of price m
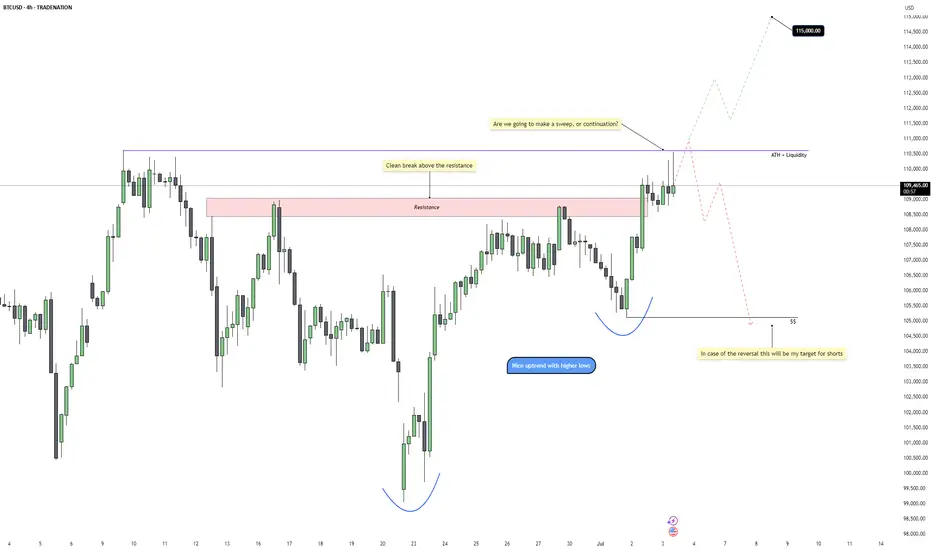
Bitcoin – ATH Sweep or Breakout?Bitcoin is pushing into a critical decision point as it challenges the previous all-time high near 110k. After a strong push out of a rounded bottom formation with clean higher lows, price has now broken above the last visible resistance area and is hovering just under the ATH liquidity. This rally
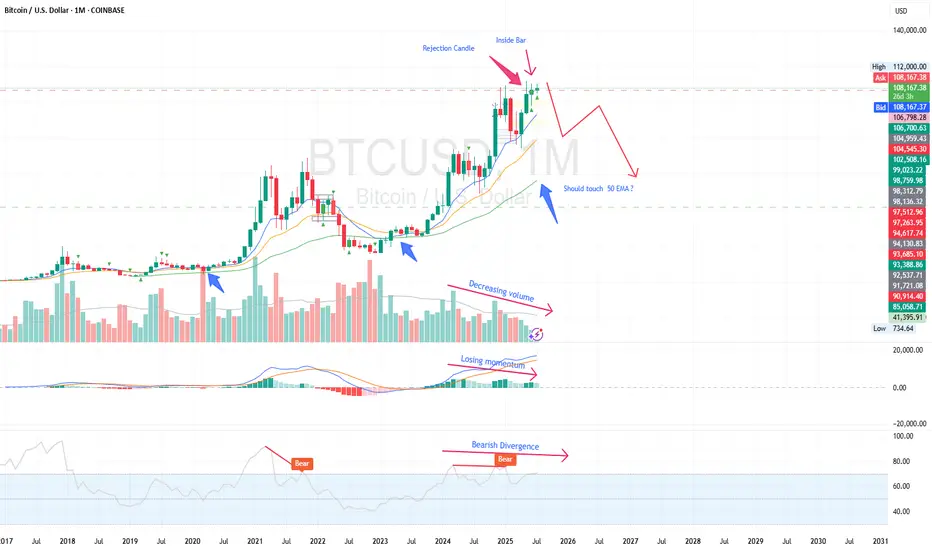
BTC monthly yelling at us for something interesting ?We read daily news about ETF, accumulation by institutes and scarcity in the exchanges, but I recognize something different in the chart based on multiple indicators. Historically, BTC boomed after touching 50 EMA and whenever it is extended it traces back to 50 EMA on monthly chart. As per current
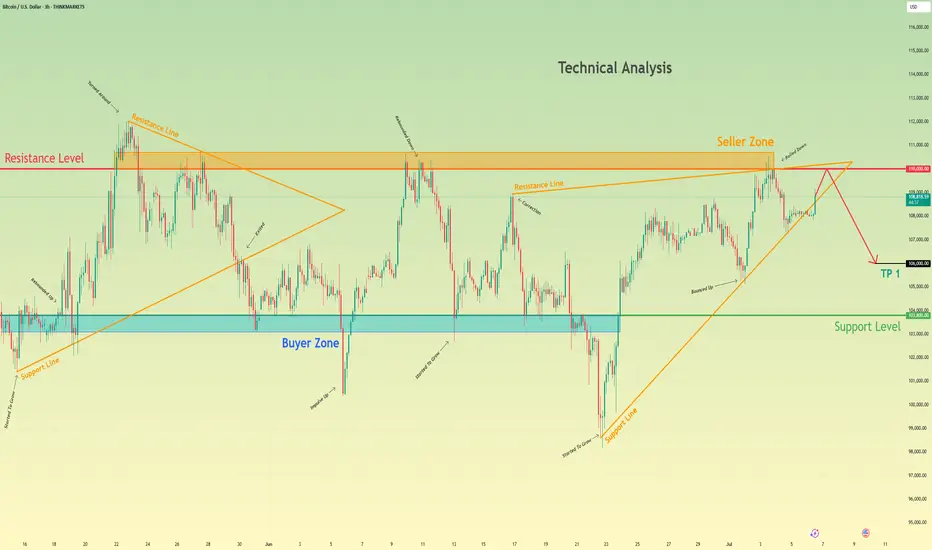
Bitcoin - Price struggles below resistance, correction to $104k?This 4-hour chart for BTC/USD illustrates a detailed technical analysis scenario highlighting key resistance and support zones, as well as a critical fair value gap (FVG). The chart shows that Bitcoin is currently facing strong resistance in the $108,000 to $109,000 range. This area has been tested

Bitcoin can rebound from resistance level and start to declineHello traders, I want share with you my opinion about Bitcoin. Recently, the price broke above a local resistance and quickly approached the key resistance level at 110000, which also aligns with the upper boundary of the seller zone (110000 - 110700 points). This area has already proven its strengt
Bitcoin - Trust the higher timeframe!⚔️Bitcoin ( CRYPTO:BTCUSD ) is still 100% bullish:
🔎Analysis summary:
For the past couple of months we have been seeing an overall consolidation on Bitcoin. But looking at the higher timeframe, Bitcoin remains in an underlying strong bullrun. Consolidations are always expected and no reason t

BTCUSD| Bitcoin’s Historic Parabolic Pattern🔥 Parabolic Pattern | Institutional COINBASE:BTCUSD Demand Mirrors Gold ETF Era 🔥
COINBASE:BTCUSD vs SP:SPX vs TVC:GOLD
The market is whispering something big — and it's not retail noise this time. For the third straight quarter, listed corporations have outpaced ETFs in Bitcoin purch

80k BTC On The Move - WHAT It Means 80,000 BTC Wallet Movement (2011 Miner)
• Source: 8 wallets containing 10,000 BTC each — mined in 2011, dormant for 14 years
• Total Value: Over $8.6 billion USD
• Timing: Moved on July 4, 2025 — largest dormant BTC transfer in history
• New Addresses: Funds moved to modern SegWit wallets

Internal and external liquidity Here's another mechanical lesson for you.
In my last post I covered a mechanical technique to identify swing ranges. Rule-based, simple and repeatable.
In this post, I want to share another little technique, again part of the mechanical series. But this time I want to talk about liquidity.

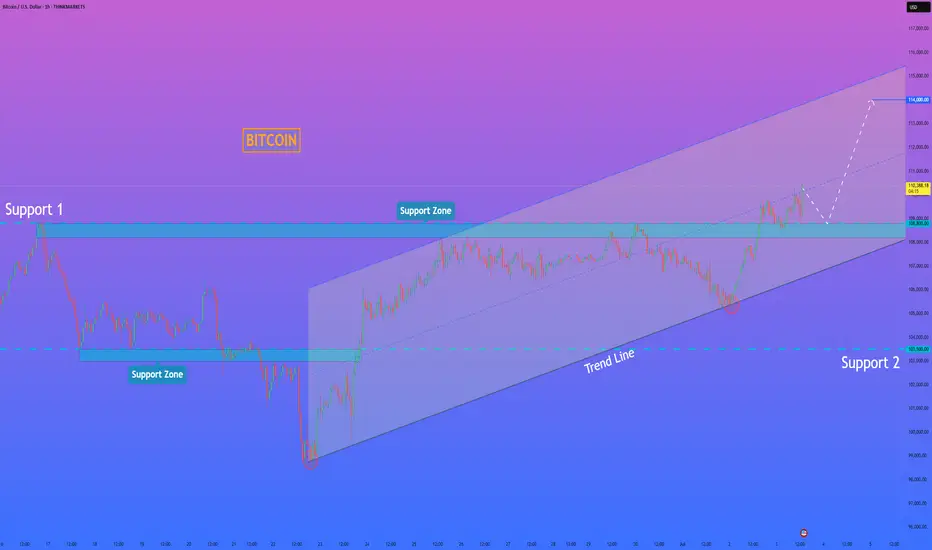
HelenP. I Bitcoin may correct to support level and continue growHi folks today I'm prepared for you Bitcoin analytics. If we look at the chart, the price has formed a clean upward channel after bouncing from the strong support zone at 103500 - 103000 points. This movement marked the beginning of a new bullish phase. Price continued to rise step by step, confirmi
See all ideas
Summarizing what the indicators are suggesting.
Oscillators
Neutral
SellBuy
Strong sellStrong buy
Strong sellSellNeutralBuyStrong buy
Oscillators
Neutral
SellBuy
Strong sellStrong buy
Strong sellSellNeutralBuyStrong buy
Summary
Neutral
SellBuy
Strong sellStrong buy
Strong sellSellNeutralBuyStrong buy
Summary
Neutral
SellBuy
Strong sellStrong buy
Strong sellSellNeutralBuyStrong buy
Summary
Neutral
SellBuy
Strong sellStrong buy
Strong sellSellNeutralBuyStrong buy
Moving Averages
Neutral
SellBuy
Strong sellStrong buy
Strong sellSellNeutralBuyStrong buy
Moving Averages
Neutral
SellBuy
Strong sellStrong buy
Strong sellSellNeutralBuyStrong buy
Displays a symbol's price movements over previous years to identify recurring trends.
Curated watchlists where BTCUSD.P is featured.

Gen 1 crypto: from little acorns grow
15 No. of Symbols

Proof of Work: Embracing the crunch
27 No. of Symbols
See all sparks