BTCUSD Will Explode! BUY!
My dear followers,
I analysed this chart on BTCUSD and concluded the following:
The market is trading on 11326 pivot level.
Bias - Bullish
Technical Indicators: Both Super Trend & Pivot HL indicate a highly probable Bullish continuation.
Target - 11517
Safe Stop Loss - 11236
About Used Indicators:
A super-trend indicator is plotted on either above or below the closing price to signal a buy or sell. The indicator changes color, based on whether or not you should be buying. If the super-trend indicator moves below the closing price, the indicator turns green, and it signals an entry point or points to buy.
Disclosure: I am part of Trade Nation's Influencer program and receive a monthly fee for using their TradingView charts in my analysis.
———————————
WISH YOU ALL LUCK
BTCUSD.P trade ideas

sell pullback wave 4🌀 Elliott Wave Analysis Overview
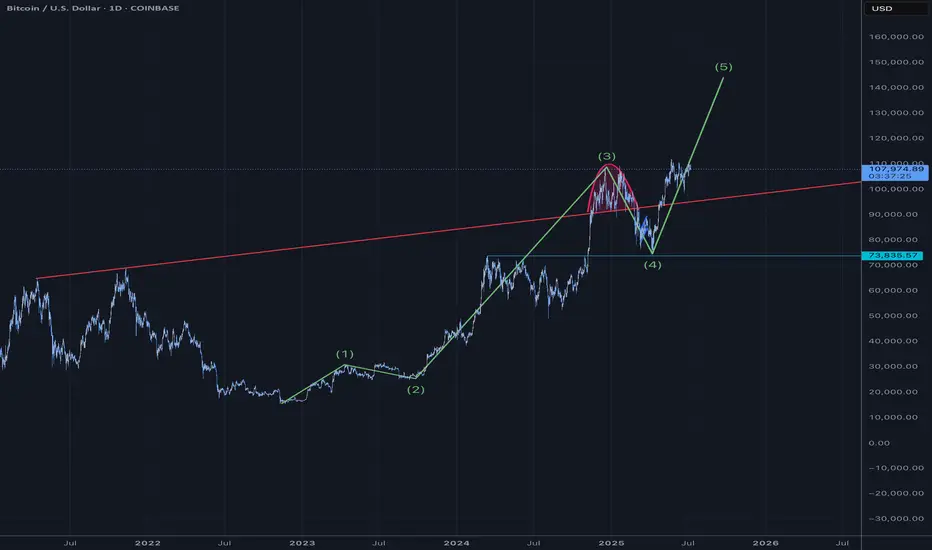
The chart shows a completed major Wave (3), followed by an ongoing correction forming Wave (4).
Inside Wave (5), there is a clear 5-wave impulsive structure (labeled 1 to 5 in red).
After the peak at subwave 5, the market entered an ABC correction (labeled A, B, C in red):
Wave A marked the initial drop,
Wave B a brief retracement,
Wave C is currently developing and may still continue.
📉 Rising Wedge & Breakdown
A rising wedge pattern formed and broke to the downside — typically a bearish signal.
Current price (around $113,813) sits below the resistance zone at $115,000–$120,000.
If the correction deepens, major support lies at:
$102,548 (key support level),
$100,000 (psychological level),
And deeper Fibonacci projections (2.618 to 4.886 extension) between $89,000 to $83,000 — potential completion zone for Wave C.
🚀 Next Move Expectation
If Wave C is complete, BTC could launch into the next impulsive Wave 3 of a larger cycle, targeting:
$120,000
$123,879
Or possibly higher as Wave (5) unfolds.
🔍 Summary
This chart suggests Bitcoin is at a critical turning point:
Either it bounces from current support to start a new impulsive move up (Wave 5), or the correction extends deeper into the Fibonacci zone before a real bullish continuation.

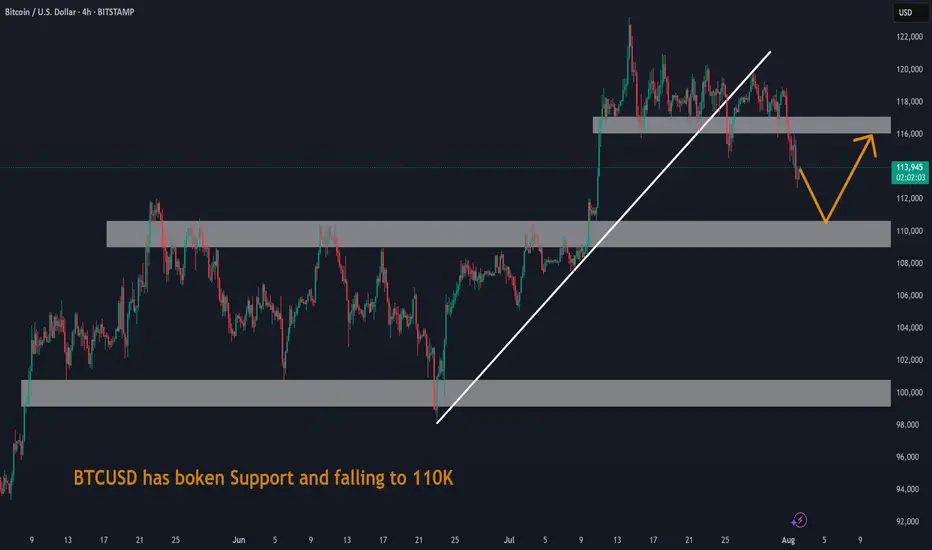
BTCUSD has boken Support and falling to 110KBTCUSD has boken Support and falling to 110K. This decline is due to General fall in equity market due to Tariff war.
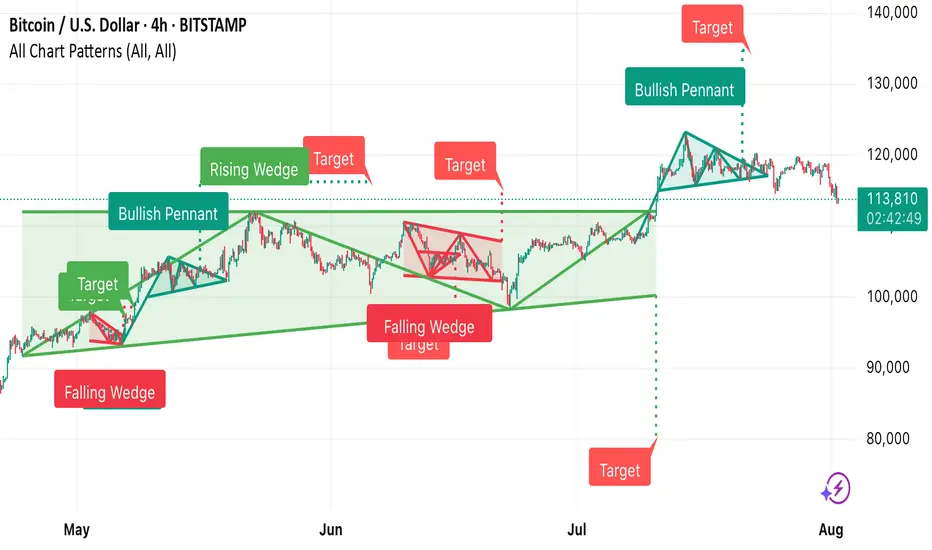
This Bitcoin 4-hour chart from TradingView shows multiple techni • Falling Wedge (early May) → Bullish breakout, target achieved.
• Bullish Pennant → Strong upward continuation.
• Rising Wedge (June) → Bearish breakdown, target met.
• Falling Wedge (mid-June) → Bullish breakout, target achieved.
• Bullish Pennant (late July) → Upward move toward the 140,000 target zone.
Currently, BTC is trading around 113,829, below recent highs, and near the dotted horizontal support zone from the last breakout.
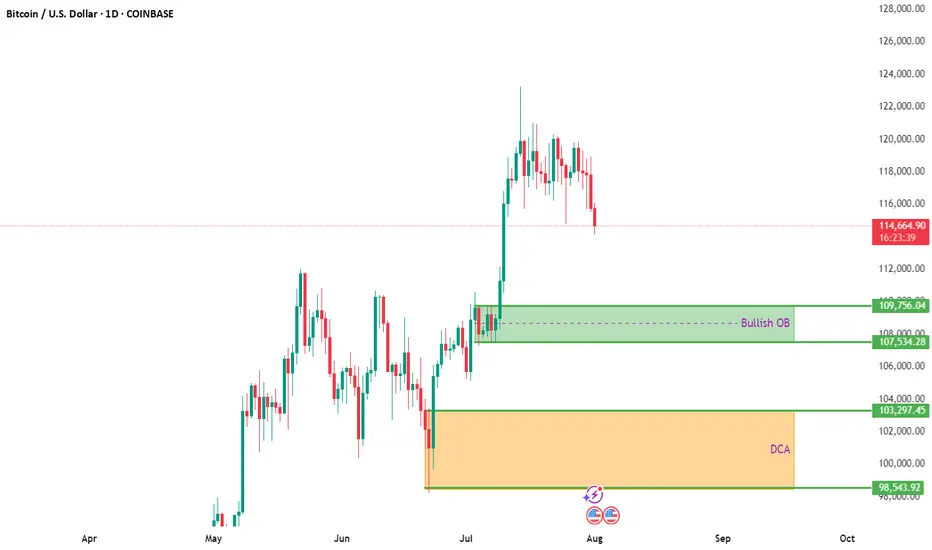
BTCUSD Daily Analysis – Key Entry & DCA ZonesBitcoin is currently pulling back after a strong bullish move, now hovering near $115K. The correction opens a potential window for smart entries based on prior market structure and order block analysis.
🔍 Bullish Order Block (OB):
✅ Zone: $107,534 – $109,756
This area previously served as a breakout zone after consolidation. A retest of this region could act as strong support, making it a prime candidate for short- to mid-term bullish setups.
🟧 DCA Zone (Long-Term Accumulation):
✅ Zone: $98,543 – $103,297
Ideal for long-term investors looking to build exposure gradually. Dollar-cost averaging in this zone allows entry at historically undervalued levels in case of a deeper pullback.
🧠 Trading Insight:
Patience pays. Let price come to your levels rather than chasing. Use alerts and consider scaling into positions with proper risk management.
📌 Chart Context: 1D | COINBASE
📆 August 2025
📈 TA by: @NFX_Solutions
#BTC #Bitcoin #Crypto #BTCUSD #TechnicalAnalysis #OrderBlock #TradingView #CryptoStrategy #DCA #SwingTrade #SupportZone
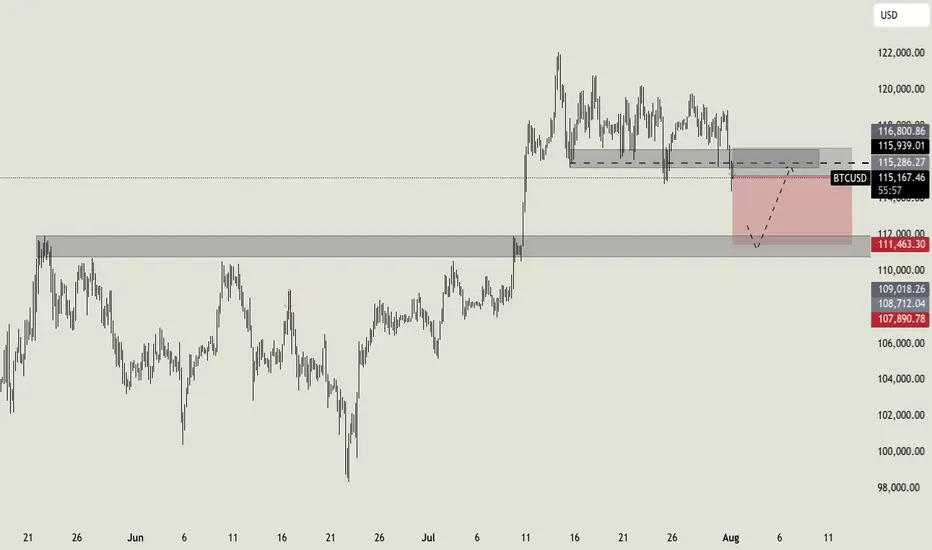
NO FEAR on BITCOIN!I was waiting for a break on this level from some days, and here we go! We catched a nice long setup previous days, and now Bitcoin broke down the key level i highlited last week. This is an important support area that will now act as resistance, so i expect a continuation to the downside till the second support area at $112.000. To invalidate this setup we should expect a clean break above $116.800.
Let me know in the comment what do you expect!
Bitcoin Elliot Wave CountBullish for the next 90 days
Blow off top thesis
Pump into rate cuts and Big Beautiful Bill.
BTC this other snicky guyit is amazing as the meassures remains the same
The buy it is not ready the buy is in 113.500
either from 121000 or from 122000 it will fall, Im in the internalk buy right now and also will be selling from 121.000 and 122.000 too
GG

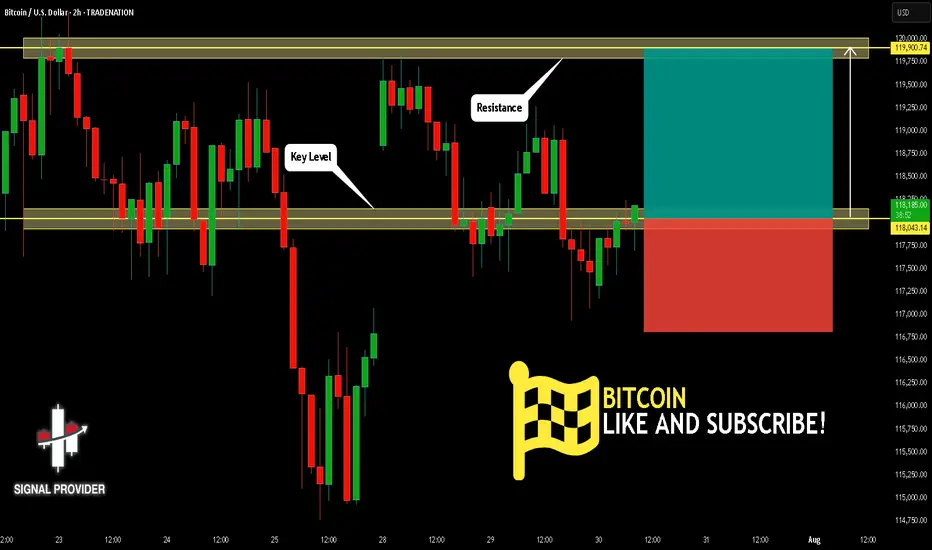
BITCOIN Will Move Higher! Long!
Take a look at our analysis for BITCOIN.
Time Frame: 2h
Current Trend: Bullish
Sentiment: Oversold (based on 7-period RSI)
Forecast: Bullish
The price is testing a key support 118,043.14.
Current market trend & oversold RSI makes me think that buyers will push the price. I will anticipate a bullish movement at least to 119,900.74 level.
P.S
The term oversold refers to a condition where an asset has traded lower in price and has the potential for a price bounce.
Overbought refers to market scenarios where the instrument is traded considerably higher than its fair value. Overvaluation is caused by market sentiments when there is positive news.
Disclosure: I am part of Trade Nation's Influencer program and receive a monthly fee for using their TradingView charts in my analysis.
Like and subscribe and comment my ideas if you enjoy them!
BTC / USD Daily ChartHello Crypto traders. Just a quick chart about what is happening in my opinion with Bitcoin. There is way too much institutional money and wall street money now flowing into Bitcoin, that when this pops, it will be epic. Saying that, I have marked the areas of interest on the chart. Until we break and close above $120k on a daily or 4 hour at the minimum, we are just ranging. As long as $117,087 / $118,000 area holds as support, we should push up at some point this week. If we lose support at said area, we can easily look to fill the wick. It's early in the week, so we will see what paths Bitcoin carves out. Be well and trade the trend. All my thanks goes to Big G. Thank you so much for checking out my chart/analysis.


$BTC New Cycle: It’s Hard Not to Notice the ShiftSince December 2024, CRYPTOCAP:BTC has been closely following the SPX500, forming three similar cycles—each decreasing in intensity and shorter in duration.
The similarities are striking, especially when analyzing the MACD and RSI.
Each cycle ends with a bearish divergence.
Each cycle sees a rebound or bottom during consolidation, often touching the top of the previous cycle.
Most importantly, the cycles are accelerating.
However, it’s difficult to draw a definitive conclusion. These patterns are new in Bitcoin’s history, and there's no past reference for such institutional-driven behavior.
I believe the entry of institutions is reshaping Bitcoin’s rhythm. Their strategy is accumulation, not speculation, which brings more stability but also alters traditional crypto cycles.
What do you think will be the consequences of this shift?
Drop your thoughts in the comments👇

bitcoin sell setup.price dropped below previous low and remain down there for a long time, this shows sellers strength and willingness to push down. we expect a sharp move from here

BTCUSD looking to SellI'm expecting BTC USD to enter into the break of structure and retest zone that is in f4HRS and and then push down from there with a 1:4RR hitting the next point of interest / area of interest

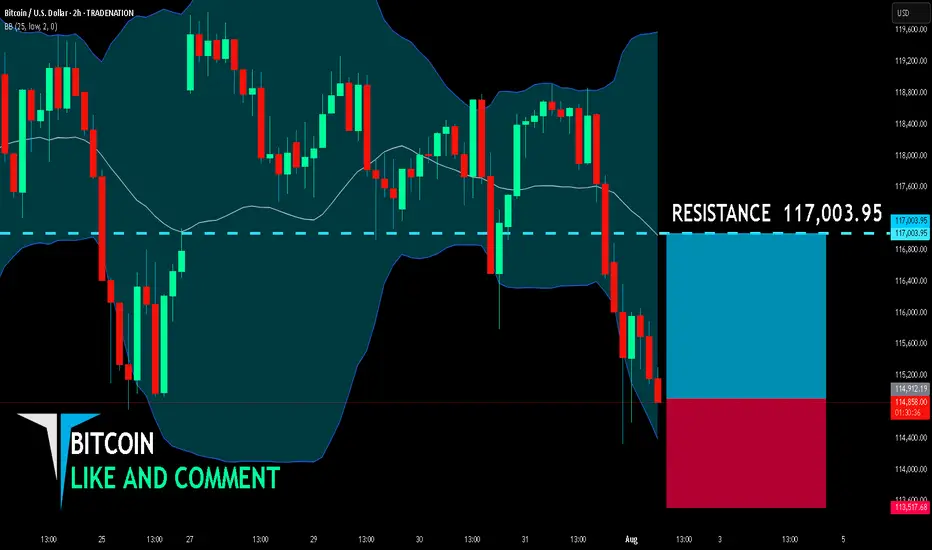
BITCOIN SENDS CLEAR BULLISH SIGNALS|LONG
BITCOIN SIGNAL
Trade Direction: long
Entry Level: 114,912.19
Target Level: 117,003.95
Stop Loss: 113,517.68
RISK PROFILE
Risk level: medium
Suggested risk: 1%
Timeframe: 2h
Disclosure: I am part of Trade Nation's Influencer program and receive a monthly fee for using their TradingView charts in my analysis.
✅LIKE AND COMMENT MY IDEAS✅
GOLD & BTC analysisWe did a detailed analysis on Gold and BTC to have our directional bias and we kick off the month of August with a profitable setup.

BTCUSD Analysis : Major Breakout Setup | Big Move Loading"Bitcoin Coiling Below Key Resistance – Breakout or Trap?"
🔍 Technical Overview:
Bitcoin is currently trading within a compressed range, sitting just below a key descending trendline that has capped upside movement for multiple sessions. Price is consolidating between minor highs and lows, hinting at a build-up of momentum for the next breakout move.
The setup presents a classic compression inside a bearish wedge, but with increasing bullish pressure evident from higher lows and wick rejections near minor supports.
🧱 Detailed Technical Breakdown:
🔸 1. Descending Trendline Structure
Price has formed a downward sloping resistance line from earlier highs.
This trendline has acted as a dynamic ceiling, rejecting multiple bullish attempts.
Each time price approaches it, the rejection gets weaker, indicating a possible breakout attempt soon.
🔸 2. Multiple Minor & Major Zones
Minor Resistance: Around $118,800–$119,200
A short-term ceiling that has paused bullish rallies.
Price needs a clean break and close above this to initiate momentum.
Major Resistance: ~$121,000–$121,200
This zone aligns with a previous significant swing high.
A break above here could result in strong bullish continuation toward ATH levels.
Minor Support: ~$117,000
Price has repeatedly bounced from this level.
A breakdown would indicate fading bullish strength and open the downside.
Major Support: ~$115,000
A historically strong demand zone.
If BTC fails all bullish attempts, this would be the final defense for buyers.
🧠 Market Psychology Insight:
Price is trapped between aggressive short-term sellers and accumulating buyers.
Buyers are placing confidence in this area by defending higher lows.
Sellers are still protecting the trendline, but with each retest, the defense weakens.
This is a classic equilibrium zone where liquidity is building—once imbalance hits, a strong impulsive breakout (either direction) is likely.
Volume and momentum should be watched closely as a breakout with confirmation may trap the opposite side, leading to a strong move (short squeeze or long liquidation).
🔮 Scenario Forecasts:
📈 Bullish Breakout Scenario:
Price breaks above $119,200 → minor resistance flips to support
Retest of the broken trendline confirms a bullish breakout
Price targets:
First Target: $121,000–$121,200 (major resistance)
Second Target: $122,500+
Third Target: $123,800–$124,000 (All-Time High)
Confirmation Needed: 4H candle close above descending trendline and $119,200 with rising volume.
📉 Bearish Rejection Scenario:
Price gets rejected from the trendline or minor resistance zone
Breaks below $117,000 minor support
Possible targets:
First Target: $116,000 (reaction zone)
Second Target: $115,000 (major support)
A fall below $115,000 could invalidate the bullish buildup and invite strong bearish continuation.
This would signal that bulls failed to reclaim control, and sellers maintain market structure dominance.
📌 Key Levels Summary:
Type Price Range Significance
🔺 All-Time High $123,800–124,000 Final upside target
🔸 Major Resistance $121,000–121,200 Key breakout level
🔹 Minor Resistance $118,800–119,200 Immediate trendline + local supply
🔹 Minor Support ~$117,000 Local demand base
🔻 Major Support $115,000 Last line of defense for bulls
🧭 Conclusion & Strategy:
Bitcoin is approaching a make-or-break zone under a significant descending trendline. Price compression is tightening, and a breakout looks imminent.
Traders should stay patient and wait for confirmation—either a breakout and successful retest for longs or a rejection and trendline defense for shorting opportunities.
Whether it’s a breakout toward $121K and ATH, or a drop toward $115K support, this setup offers a high-probability trade opportunity for both bulls and bears depending on the confirmation.
Btcusd techinical analysis.Btcusd techinical analysis next move posibale at h1 time frame not finchinal advice.

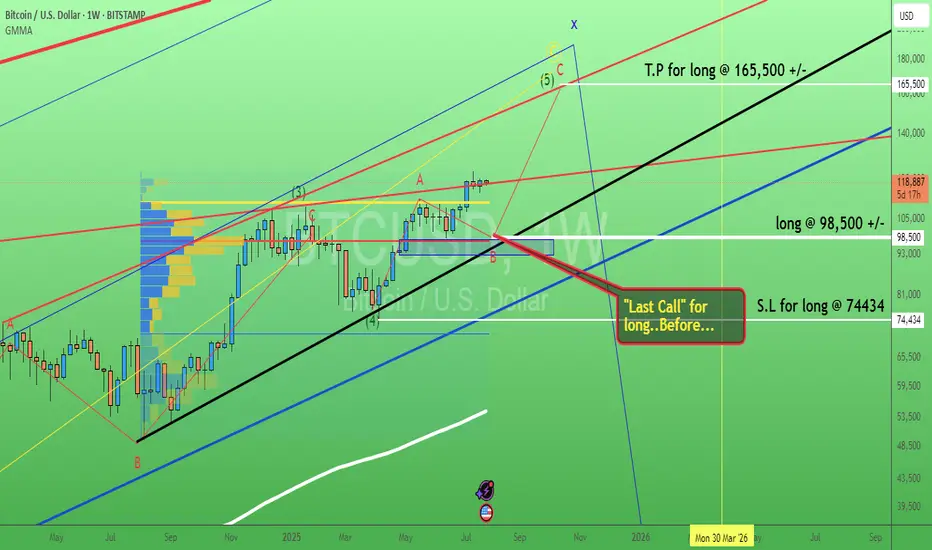
Bitcoin. Last call buy level? 29/July/25BTCUSD probably will have pullback toward confluence zone of 1) Trendline Support 2) Order Block 3) POC of volume before hitting ATH again
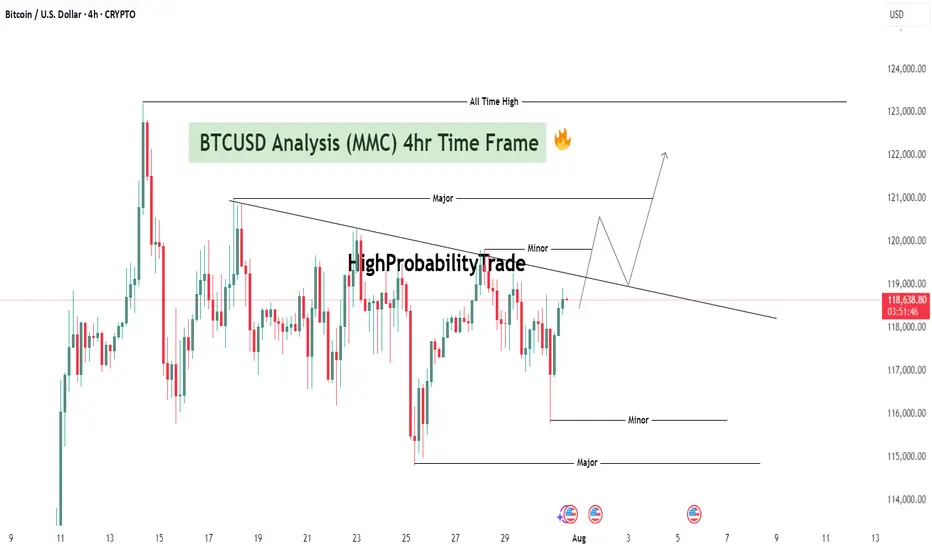
BTCUSD Analysis (MMC) – Breakout Confirmed + Target Next Zone⚙️ Chart Context (4H BTC/USD)
As part of our Mirror Market Concepts (MMC) strategy, today's BTCUSD 4H chart is a textbook representation of market structure shift, SR interchange, demand reaction, and target projection. After consolidating within a compressed range under a key descending structure, Bitcoin has successfully broken out of bearish control, signaling a fresh phase of bullish momentum.
🧩 Breakdown of Technical Structure
🔹 1. Demand Zone Reaction (July 13–14)
The initial impulse move originated from a well-defined demand zone, marked by a strong accumulation and breakout. This zone—highlighted on the chart—acted as the institutional demand base, where buyers stepped in with volume and aggression. Price respected this zone precisely, confirming it as a valid MMC "Power Base."
Why this matters: Demand zones like these reflect institutional footprints. Once price reacts from such zones, they often become foundational for future bullish legs.
🔹 2. SR Interchange Zone – Structure Flip Confirmed
The descending green channel acted as dynamic resistance for several sessions. Every touch along this zone resulted in a lower high, confirming bearish order flow. However, BTC has now closed decisively above this structure, transforming this zone from supply to support—this is our classic SR Interchange concept in MMC.
Interpretation: This structure flip implies a strong change in sentiment. What was once a zone of rejection now becomes a potential support for continuation.
Expect retests of this zone before price resumes to higher reversal levels.
🔹 3. Minor and Major Resistance Zones
Above current price, two critical zones have been mapped:
Minor Resistance (~$120,000):
Acts as the first liquidity grab area. This is where early sellers may place stops or where short-term traders could book profits. MMC logic expects minor resistance to either cause a pause or a fakeout to lure in shorts.
Major Resistance / Central Reversal Zone (CRZ):
Spanning roughly $121,000 to $121,800, this is a key zone where price will likely meet decision-making. This CRZ is derived from previous structure congestion, imbalance fills, and projected Fibonacci confluence.
Next Reversal Zone (Final Target Area):
Located near $123,000, this is the outer reversal box where the bullish wave may either end, consolidate, or reverse entirely. This is the final target for swing traders or MMC practitioners looking for exhaustion.
🧭 Price Forecast Structure – Predictive Pathway
The forecast path shown on the chart illustrates a stair-step rally, with bullish impulses followed by shallow pullbacks:
First, price may pull back slightly to retest the breakout zone (green SR area).
Then a leg upward to minor resistance (~$120K).
A healthy rejection or small correction before breaking into the CRZ (~$121.2K).
Final move toward the outer reversal zone at ~$123K.
This fractal progression is a common MMC pattern seen during structure shifts—not impulsive straight-line rallies, but controlled, zone-to-zone movements.
🔍 Strategic Insights & Trade Plan
📌 Conservative Entry:
Wait for a retest of the breakout zone (SR Interchange) around $118,200–$118,500.
Look for bullish rejection candles or order flow confirmation on LTF (lower timeframes).
📌 Aggressive Entry:
Break and close above $120,000, confirming liquidity clearance and path toward CRZ.
🎯 Target Zones:
TP1: $121,200 – Central Reversal Zone
TP2: $123,000 – Outer Reversal Zone
❌ Stop-Loss Ideas:
Below $117,000 (structure invalidation)
Below recent bullish impulse candle low
🧠 MMC Concepts in Action:
SR Flip: Strong indication of market shift
Demand Rejection: Institutional footprint detected
Zone Mapping: Controlled zone-to-zone movement
Liquidity Logic: Price moves where orders rest – CRZ = likely reaction
Reversal Framing: Structure analysis ahead of time, not after the move
📊 Conclusion:
This BTCUSD 4H analysis showcases a strong MMC-style breakout scenario. The reaction from demand, shift in SR structure, and projected reversal zones give us a clean roadmap. As long as the structure remains valid and price respects the new SR zone, this bullish move remains high-probability.
Trade with structure. Trust the zones. Mirror the Market.

BTCUSD 4HOUR TIME FRAME ANALYSISOverall Structure & Trend
Over the past several 4-hour candles, BTCUSD has carved out a series of higher lows around 116,500–117,000 and higher highs around 120,000–120,500, defining a gentle up-sloping channel.
The current price (118,758) sits just above the middle of that channel, suggesting there’s still room toward the upper trendline before meeting heavy supply.
Key Support & Entry Zone
Primary support lies at 117,200–117,500 (the former swing high from three bars ago), which also aligns with the 50% retracement of the move up from 114,500 to 120,500. That zone offers confluence for the 118,758 entry.
A secondary buffer sits at 116,849 (your stop-loss), just below the channel’s lower boundary—if price breaches here, the bullish structure would be invalidated.
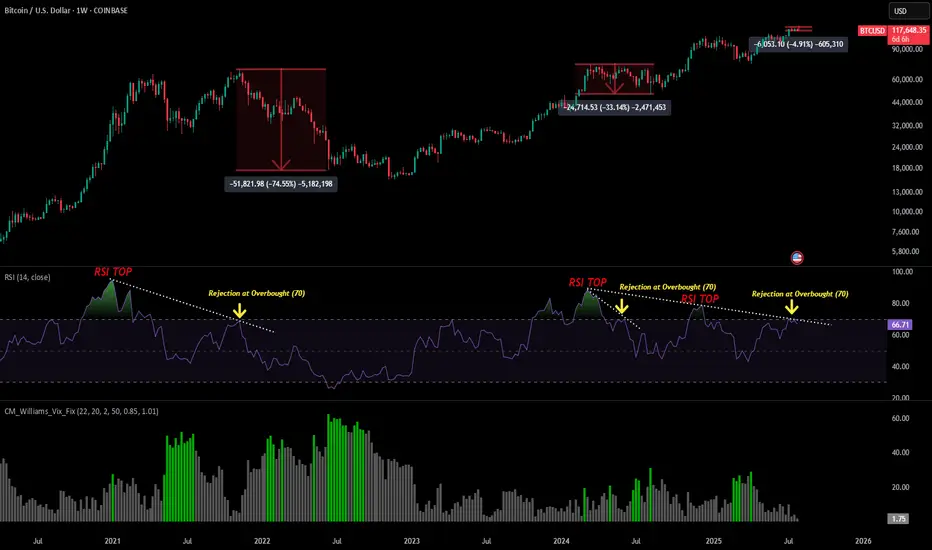
BTC - Weekly Warning SignsAfter seeing a 5% correction from our recent BTC ATH of $123k we are starting to see a few warning signs as momentum starts to decline.
Looking only at our RSI and price I have outline the last 3 time we have seen something similar since 2021. Without going into too much detail normally what we see is an RSI TOP followed by a retest + rejection right at the 70 level (overbought conditions).
We saw it at our market cycle high in 2021 that started the bear market (75% correction).
We saw it at our March 2024 high that started a mid cycle correction (33% correction).
And we are seeing it now after our recent 2025 ATH that has started a very mild correction so far (5%).
This does not mean it is the end of the world but absolutely something market participants need to be paying attention to as this is a make or break signal;.
If we see momentum continue to decline it could lead to our bull market structure being broken and lead us into a bear market that we have historically seen going into the new year.
However this correction can easily be negated to produce a strong bull market continuation move. All we need to see is bulls start to push our strength back above the 70 level (overbought conditions) and we can see the next leg of the bull market really kick off (WITH A CLOSE ABOVE).
For now pay attention to the weekly RSI as of the time of this post our strength has been declining from where we have seen previous tops align with.